Mercer county real estate market update January 25 2011
•
0 gefällt mir•236 views

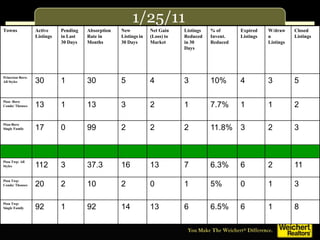
The following stats on West Windsor, Lawrence, East Windsor, Ewing, Hopewell, Cranbury, Plainsboro, South Brunswick, Montgomery, Hamilton, Franklin, Princeton Township, Princeton Boro, Robbinsville, Hightstown, Penningtion, and Monroe are provided: Active Listings NJ Pending in Last 30 Days Absorption Rate New Listings Net Gain (Loss) to Market Listings Reduced in 30 Days % of Inventory Reduced Expired Listings Withdrawn Listings Closed Listings Contact me at http://paulcamuto.com for more information.

Empfohlen
Weitere ähnliche Inhalte
Mehr von Weichert Real Estate Agent
Mehr von Weichert Real Estate Agent (20)
Kürzlich hochgeladen
Kürzlich hochgeladen (20)
Mercer county real estate market update January 25 2011
- 1. 1/25/11 Towns Active Pending Absorption New Net Gain Listings % of Expired W/draw Closed Listings in Last Rate in Listings in (Loss) to Reduced Invent. Listings n Listings 30 Days Months 30 Days Market in 30 Reduced Listings Days Princeton Boro: All Styles 30 1 30 5 4 3 10% 4 3 5 Pton -Boro Condo/ Thouses 13 1 13 3 2 1 7.7% 1 1 2 Pton-Boro Single Family 17 0 99 2 2 2 11.8% 3 2 3 Pton Twp: All Styles 112 3 37.3 16 13 7 6.3% 6 2 11 Pton Twp: Condo/ Thouses 20 2 10 2 0 1 5% 0 1 3 Pton Twp: Single Family 92 1 92 14 13 6 6.5% 6 1 8
- 2. 1/25/11 Towns Active Pending Absorption New Listings Net Gain Li1stings % of Expired W/drawn Closed Listings in Last Rate in in 30 Days (Loss) to Reduced in Invent. Listings Listings Listings 30 Days Months Market 30 Days Reduced West Windsor: 76 7 10.9 18 11 16 21.1% 8 9 19 All Styles West Windsor 19 3 6.3 6 5 3 15.8% 2 2 4 Condo/ T.Houses West Windsor 3 0 99 1 1 -- -- 0 1 0 55+ West Windsor 54 4 13.5 9 5 13 24.1% 6 6 15 Single Family Lawrence: All Styles 181 5 36.2 32 27 31 17.1% 12 5 15 Lawrence: Condo/ 66 2 33 13 11 11 16.7% 5 2 6 THouses Lawrence: 55+ 11 0 99 1 1 -- -- 2 0 1 Lawrence: Single 104 3 34.7 18 15 20 19.2% 5 3 8
- 3. 1/25/11 Towns Active Pending Absorption New Net Listings % of Expired W/drawn Closed Listings in Last Rate in Listings in Gain Reduced Invent. Listings Listings Listings 30 Days Months 30 Days (Loss) to in 30 Reduced Market Days Plainsboro All Styles 87 1 87 24 23 11 13% 17 0 8 Plainsboro Condo/ 45 0 99 15 15 6 13% 11 0 1 THouses Plainsboro 55+ 21 0 99 1 1 2 9% 1 0 2 Plainsboro Single 21 1 21 8 8 3 14% 5 0 5 Family Cranbury: All Styles 20 0 99 1 1 0 0 2 0 1 Cranbury: 55+ 3 0 99 0 0 0 0 0 0 0 Cranbury: Single 17 0 99 1 1 0 0 2 0 1 Family
- 4. 1/25/11 Towns Active Pending Absorption New Listings in Net Gain Listings % of Expire W/drawn Clos Listings in Last Rate in 30 Days (Loss) to Reduced in Invent. d Listings Listi 30 Days Months Market 30 Days Reduced Listings Ewing: All Styles 238 5 47.6 25 20 50 21% 26 7 6 Ewing : Condo/ 28 1 38 5 4 8 21.1% 2 0 0 T.Houses Ewing 55+: 8 0 99 0 0 -- -- 0 0 0 Ewing: Single 192 4 59.9 20 16 42 21.9% 24 7 6 Family East Windsor: 192 3 64 20 17 40 20.9% 22 4 3 All Styles East Windsor: 128 2 64 11 9 31 24.2% 14 3 1 Condo/ THouses East Windsor: 13 0 99 1 1 -- -- 5 0 0 55+ East Windsor: 51 1 51 8 7 9 17.6% 3 1 2 Single Family
- 5. 1/25/11 Towns Active Pending Absorptio New Net Gain Listings % of Expired W/drawn Closed Listings in Last n Rate in Listings in (Loss) to Reduced in Invent. Listings Listings Listings 30 Days Months 30 Days Market 30 Days Reduced Hopewell Twp. 127 7 19 15 8 20 16% 11 4 7 All Styles Hopewell Twp. Condo/ 9 3 3 4 1 3 33% 0 0 4 T.Houses Hopewell Twp.: 9 0 9 2 2 -- -- 0 1 0 55+ Hopewell Twp Single Family 109 4 27 9 5 17 15.5% 11 3 3 Hamilton: All Styles 565 25 22 100 75 122 21.5% 44 14 46 Hamilton: Condo/ THouses 99 6 16.5 18 12 26 26% 9 2 8 Hamilton: 55+ 35 0 35 6 6 -- -- 1 0 4 Hamilton: Single Family 431 19 23 76 57 96 23% 34 12 34
- 6. 1/25/11 Towns Active Pending Absorption New Net Gain Listings % of Expired W/draw Closed Listings in Last Rate in Listings (Loss) to Reduced Invent. Listings n Listings 30 Days Months in 30 Market in 30 Reduced Listings Days Days Robbinsville All Styles 134 12 11 26 14 29 22% 10 5 12 Robbinsville Condo/ 60 6 10 15 9 11 18% 5 2 5 T.Houses Single Family 74 6 12 11 5 18 24% 5 3 7 Hightstown Boro: All 53 0 99 7 7 10 8 1 0 Styles Pennington 10 3 3 1 (2) 0 0 2 1 3 Hopewell Boro 10 1 10 0 (1) 3 30% 1 2 3
- 7. 1/25/11 Towns Active Pending Absorption New Net Listings % of Expired W/drawn Closed Listings in Last Rate in Listings in Gain Reduced Invent. Listings Listings Listings 30 Days Months 30 Days (Loss) to in 30 Reduced Market Days South Brunswick All Styles South BrunswickCon do/ T.Houses South Brunswick 55+ South Brunswick Single Family Monroe: All Styles Monroe: 55+ Monroe: Single Family
- 8. 1/25/11 Towns Active Pending Absorption New Net Gain Listings % of Expired W/draw Closed Listings in Last Rate in Listings in (Loss) to Reduced Invent. Listings n Listings 30 Days Months 30 Days Market in 30 Reduced Listings Days Montgomery All Styles 105 12 8.75 16 +4 16 15% 12 7 15 Montgomery Condo/Twnhms 25 1 25 3 +2 7 28% 2 3 5 Single Family 80 11 7.3 13 +2 9 11% 10 4 10 Hillsborough All Styles 248 27 9.2 51 +24 30 12% 33 13 18 Hillsborough Condo/Twnhms 81 13 6.2 20 +7 15 18% 13 6 7 Hillsborough Single Family 167 14 12 31 +17 15 9% 20 7 11