Measures CGBI For KM
•Als PPT, PDF herunterladen•
0 gefällt mir•1,107 views

from Bridgett Garchek

Empfohlen
Weitere ähnliche Inhalte
Was ist angesagt?
Was ist angesagt? (20)
Ähnlich wie Measures CGBI For KM
Ähnlich wie Measures CGBI For KM (20)
Mehr von Peter Stinson
Mehr von Peter Stinson (20)
Kürzlich hochgeladen
Kürzlich hochgeladen (20)
Measures CGBI For KM
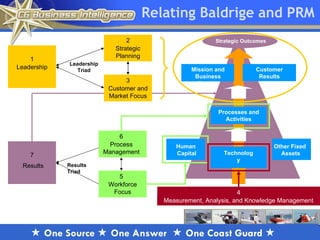
- 1. Relating Baldrige and PRM 2 Strategic Outcomes Strategic Planning 1 Leadership Leadership Leadership Mission and Customer Triad Business Results Results 3 Customer and Market Focus Processes and Activities 6 Process Human Other Fixed Management Technology Capital Assets 7 Results Triad Results 5 Workforce Focus 4 Measurement, Analysis, and Knowledge Management One Source One Answer One Coast Guard
- 2. Measures Overview Measures Overview One Source One Answer One Coast Guard
- 3. Coast Guard Measurement CG-0931 Goal: Integrate measures development with the enterprise architecture business & performance management framework. One Source One Answer One Coast Guard
- 4. Today’s EA: Urban Sprawl • Bottom Up development of the systems & the business • Overlapping and/or incongruent delivery • Not aligned with corporate strategy One Source One Answer One Coast Guard
- 5. Tomorrow’s EA: Urban Planned Enterprise Strategic Metrics Management Performance Metrics Process Performance Metrics One Source One Answer One Coast Guard
- 6. Urban Planning & Measurement Enterprise Strategy Defined: Aspirations, Plans, Stakeholders Enterprise Strategic Metrics Business Units Management Performance Metrics Business Functions Process Performance Metrics Business Process Metrics: Defined Performance Dimensions and Key Performance Indicators One Source One Answer One Coast Guard
- 7. Overview • Definitions – Enterprise Measure – Informal Measure – Tiers – Roles & Responsibilities • Process 1. Develop Request 2. Program Review 3. Measures Team Review 4. Implementation • Enterprise Architecture & Performance Logic Models One Source One Answer One Coast Guard
- 8. Enterprise Measures • What is an Enterprise Measure? One Source One Answer One Coast Guard
- 9. Enterprise Measure 1. Measure has a program sponsor and policy governing its purpose, standard/s and business rules 2. Measure is critical to understanding the performance logic that relates Coast Guard key outputs to outcomes and demonstrates activity/process efficiencies. a. Measure aligns with Coast Guard Enterprise Architecture (CGEA) business logic and performance logic models (CG Unified Performance Logic Model (UPLM)) 3. Data to populate the measure is drawn from an authoritative, certified and accredited (C&A) enterprise system 4. Measure promotes improved effectiveness and efficiency and is commensurate with a high service-wide return on investment (ROI) (cost effectiveness) One Source One Answer One Coast Guard
- 10. Informal Measure • If a measure does not meet all four elements of the Enterprise Measure criteria, it shall be considered an Informal Measure • CG-0931 manages Informal Measures because they generally have associated data and influence decisions in the workplace One Source One Answer One Coast Guard
- 11. Enterprise Standard Measure • 3 Tiers: – Tier I: Reported outside the Coast Guard; Measures have significant influence on national outcomes or pervasive influence over CG work processes – Tier II: Measures designed to link activities to the programs outcome – Tier III: Measures designed for monitoring internal program performance One Source One Answer One Coast Guard
- 12. Examples Tier I Tier II & III GPRA Reports Program Management Reports Congressional Justifications and FYHSP Report Acquisition Program Baselines Exhibit 300s and 53s Periodic Reporting Congressional Testimony OPAR GAO Evaluations Other ExpectMore.gov (PARTs) One Source One Answer One Coast Guard
- 13. – Measure Requester • desires to implement a new measure or change an existing measure – Program Manager (measure owner) • defines, maintains, evaluates, and articulates program goals and program and system requirements through the development of program doctrine, policies, and associated concepts of operations, including operational or end user training requirements One Source One Answer One Coast Guard
- 14. – The Measurement Steward (CG-0931) • provides enterprise measure oversight authority, access, and configuration and change management – The Enterprise Measures Matrix Team • Headquarters representatives responsible for enterprise measurement management oversight One Source One Answer One Coast Guard
- 15. Measures Organization VIEWS FILTERS – Facet – Formal • People • Enterprise • Equipment • Community • Supply – Informal • Training • Infrastructure • Information – Populated (Y/N) • Activities – Archived (Y/N) • Outcomes • Goals – Performance Reference One Source One Answer One Coast Guard
- 16. Process Overview Process • 1. Develop Request 2. Program Review 3. Measures Team Review 4. Implementation One Source One Answer One Coast Guard
- 17. Measures Process Figure 1-1: Measures Request Define the Submit the Does an existing measure clearly, equestor Measures completed MT to Coordinate with PM measure meet the NO using the Requirement Steward via Chain and Steward to need? Measures of Command implement the Template (MT) measure (go to Figure 1-3) R Use existing YES measure NO NO Advise Characterize Requestor measure as Is the MT of status Is the measure NO INFORMAL (go YES accurate and Review MT ard unique? complete? to Figure 1-2) Coordinate with Requestor, PM and Stew YES OSC to implement Submit MT to Does the measure Validate measures the measure (go to Program Manager YES meet Enterprise entry into Figure 1-3) for approval Measure criteria? Measures Repository (MR) anag (P ) er M Coordinate with Program Requestor and Is the measure Steward to YES NO YES approved? implement the measure (go to Figure 1-3) M Is the measure data Build a data currently collected by collection strategy USCG easures M trix NO, Requestor & PM make on -the-spot changes a YES Team Submit NO Is the measure Review MT requirements approved? to CIO NO M One Source One Answer One Coast Guard
- 18. The Process (cont’d) 1. Measures Request – Requester should coordinate with: – Steward and Program Managers – Chain of Command – Like-type organizations – Come in using the Measures Template via: – OSC Hotline or Customer Support (A help ticket is generated and comes to CG-0931) One Source One Answer One Coast Guard
- 19. The Process (cont’d) 1. Program Review • Steward – Ensures complete, accurate & unique – May determine measure to be Informal • PM – Confirms policy – Unifies effort of like-type organizations 2. Team Review • Approval • Data collection strategy One Source One Answer One Coast Guard
- 20. The Process (cont’d) 1. Implementation Figure 1-3: Measure Implementation NO, Steward makes appropriate changes S w rd Advise Steward Does Steward Measure te a Measure Approver Approver approve Clarify measure of MR entry measure? YES Is measure clear and NO complete? Measure Implemented OC S Ensure MR entry Request data from Developer is clear and YES authoritative Data enters EDW SCR Created approves measure complete source in MR One Source One Answer One Coast Guard
- 21. Coast Guard Measurement CG-0931 Goal: Integrate measures development with the enterprise architecture business & performance management framework. One Source One Answer One Coast Guard
- 22. Today’s Measures: Urban Sprawl • Too much focus on Bottom Up reporting of performance measures • And the measures are not always what your CEO or senior managers care about • Need to align with corporate strategy One Source One Answer One Coast Guard
- 23. Enterprise Measures • How do we manage them? One Source One Answer One Coast Guard
- 24. One Source One Answer One Coast Guard
- 25. CGBI 2.0 CGBI 2.0 One Source One Answer One Coast Guard
- 26. How it works ALMIS AMVER AOPS AUXDATA CASP CG Central CSD CG Help DENCAS CGBI Direct Access (DA) EDW CGBI FLS HMIS Homeport TMT MISLE MMLD MRRS NESS SANS SAM Legacy System Data One Source One Answer One Coast Guard
- 27. What’s old? • CG Central Tabs – Executive Scorecard Portlet – My Unit Portlet – My Readiness Portlet – Analytics TAB One Source One Answer One Coast Guard
- 28. What’s new? One Source One Answer One Coast Guard
- 29. What’s new? One Source One Answer One Coast Guard
- 30. What’s new? • Faster – Response • Cleaner – Interface • Better – Search One Source One Answer One Coast Guard
- 31. Accessing CGBI CGBI provides the following views: – Enterprise – Unit Personal – Toolbox – Help One Source One Answer One Coast Guard
- 32. CGBI Search • Allows a user to search for a specific item. • Searches for the following: The exact phrase entered • Each word of the phase entered Anything that sounds similar to the phase. One Source One Answer One Coast Guard
- 33. CGBI Search Results are broken down by result type (person, unit, measure, cube/report) • Focuses on the group with the most results. One Source One Answer One Coast Guard
- 34. Common Functionality Provides the ability to create a bookmark. Provides the ability for a user to view user specific information, set their default view/position, and view interface bookmark details. Informs users of overall system notices that are informational and not related to specific products. Launches CGBI Online Help system One Source One Answer One Coast Guard
- 35. Common Functionality Provides the ability to Print, Export to Microsoft Excel, or Export to PDF. Provides the ability to view details on measures or products. Informs users that CGBI is experiencing problems with that specific area/product. Provides the ability for users to send feedback regarding CGBI. One Source One Answer One Coast Guard
- 36. Importance of the Icon Product Details provides users with a wealth of information about that specific product: At-A-Glance (Name, Detailed Description, Refresh Rate, and Data Sources with automatic alerting) – Get Assistance (Specific Contact, CGBI Online Help, and OSC Customer Support) – Related Content Analytical Data (Included Measures, Facts/Dimensions, and Data Filters). One Source One Answer One Coast Guard
- 37. Importance of the Icon Product Details Example One Source One Answer One Coast Guard
- 38. Importance of the Icon Measure Details provides users with a wealth of information about that specific measure: At-A-Glance (Short Name, Full Name, Measure Number, and Detailed Description) – Get Assistance (CGBI Online Help and OSC Customer Support) – Related Content In-depth (Algorithm, Standards, Description, Bands, Targets, and Exceptions). One Source One Answer One Coast Guard
- 39. Importance of the Icon Measure Details Example One Source One Answer One Coast Guard
- 40. CGBI Online Help Can be accessed in four places: By clicking the CGBI Help view – By clicking CGBI’s – located under Get Assistance. CG Central’s Global Toolbar – By clicking the CGBI Help program on the CG Analytics tab. One Source One Answer One Coast Guard
- 41. CGBI Product Lines Views Enterprise – Unit – Personal Toolbox – Help Cubes • Reports One Source One Answer One Coast Guard
- 42. Enterprise View Contains the following: Executive Summary Tab – Executive Details Tab One Source One Answer One Coast Guard
- 43. Enterprise View Provides the ability to view an overall summary of Coast Guard Measures or view the details on user selected measures. One Source One Answer One Coast Guard
- 44. Executive Summary Tab Provides the user the ability to interactively select and view measures by All Coast Guard, Districts, and Sectors for a specified time period. Users can view details for a point in time on the graph line or hover to display a single line on a graph. One Source One Answer One Coast Guard
- 45. Executive Details Tab Provides the user with the ability to create their own graph of up to four measures View unit specific details and also compare against All CG and Sublevels. One Source One Answer One Coast Guard
- 46. Unit View Contains the following: People Tab (default) – Training Tab – Equipment Tab Infrastructure Tab – Cube & Report Groupings (All Cubes & Reports is the default) NOTE: Click to view tab information for other departments. One Source One Answer One Coast Guard
- 47. Unit View Provides a user with their unit related information and access to Cubes & Reports. One Source One Answer One Coast Guard
- 48. People Tab Provides the following details for Human Resource information/measures: Standard Color Indicator – Current Count/Percentage. – Trend/Graph – displays a trend arrow and provides the ability to launch a graph displaying the trend. Detail - links to categorical information for each individual in the selected Unit. One Source One Answer One Coast Guard
- 49. Training Tab Provides Person, Position, and Unit Based training information such as: Competencies Tasks – – Training Education – – Aviation Proficiency. NOTE: Only Competencies in the Competency Dictionary are displayed. One Source One Answer One Coast Guard
- 50. Equipment Tab Includes resource information on CASREP(S), Capacity, Target/Resource Hours, POTF, and MTTF. One Source One Answer One Coast Guard
- 51. Infrastructure Tab Provides the following information: Condition Index – Real Property Facility Number (RPFN) – Name – Mission Dependency Index (MDI) – Descriptive and Update. One Source One Answer One Coast Guard
- 52. Personal View Contains the following: – Compliance Tab (default) – Skills Tab – Cube & Report Groupings (My Cubes & Reports is the default) One Source One Answer One Coast Guard
- 53. Personal View Provides a user with their readiness related information and access to Cubes & Reports. One Source One Answer One Coast Guard
- 54. Personal View • Improvements… One Source One Answer One Coast Guard
- 55. Compliance Tab Provides personal compliance and deployability status/details for Military and Civilians. One Source One Answer One Coast Guard
- 56. Skills Tab Available in categories: My Skills – My Pipeline Skills or Civilian Resources – Official Passport – My CPRL Assignment – My Info. NOTE: Only Competencies in the Competency Dictionary are displayed. One Source One Answer One Coast Guard
- 57. Toolbox View Provides a user with links to launch the following tools: – PAA - Personnel Allowance Amendment (PAA) reporting tool used to monitor and report on personnel position related data. – Enterprise Data Catalog - An EDC search tool to locate and determine availability of Coast Guard enterprise data. – Measures Repository - Measures and standards. One Source One Answer One Coast Guard
- 58. Help View Provides a user with the ability to: Launch the CGBI Online Help system – Submit a Help Desk ticket – Launch the CG Analytics tab in CG Central to view the CGBI channels – View Customer Support contact information. One Source One Answer One Coast Guard
- 59. CGBI Cubes & Reports Provides preformatted reports and cubes to extract and display data in a dynamic, multidimensional format. • Ability to select from multiple groupings: All Cubes & Reports – Related Cubes & Reports – My Cubes & Reports – System Cubes & Reports. One Source One Answer One Coast Guard
- 60. Cube & Report Icons Click the to expand/collapse a grouping Cubes are distinguished by this icon • Reports are distinguished by this icon – If more than 1 cube/report is available per category, the following screen will display your choices: One Source One Answer One Coast Guard
- 61. Cube & Report Common Functionality Click the to expand cube/report additional functionality: Launches Product Details screen Provides the ability to bookmark cubes and reports in Internet Explorer Favorites by clicking the icon. One Source One Answer One Coast Guard
- 62. Cube & Report Common Functionality Provides the ability to add cubes and reports to the My Cubes & Reports grouping by clicking the icon. Provides the ability to remove cubes and reports from the My Cubes & Reports grouping by clicking the icon. NOTE: The removal icon will only appear under the My Cubes & Reports grouping. One Source One Answer One Coast Guard
- 63. CGBI Reports Available in the following types: Static – Dynamic. NOTE: Data is refreshed nightly. One Source One Answer One Coast Guard
- 64. Static Reports Pre-filtered and pre-processed reports built for a specific set of departments, communities (generally by Area or District), or enterprise data system type. Preformatted and printable. One Source One Answer One Coast Guard
- 65. Dynamic Reports Dynamic Reports provide multiple output formats: Output (HTML, PDF, Excel) One Source One Answer One Coast Guard
- 66. Dynamic Reports Dynamic Reports provide customizable filters, such as: Report View (Department or Individual summary) – Organization Level/Department (COMMANDANT, CG LANTAREA, CG PACAREA, and so forth) – Employee Sources (Active and Reserve). One Source One Answer One Coast Guard
- 67. Dynamic Reports There may be more than 1 page of filters available. Run Report/Finish can be clicked after all required filters have been selected. • May generate slower than Static Reports due to use of multi-layered, custom filters. • Displays CGBI information in a printable file format. One Source One Answer One Coast Guard
- 68. CGBI Cubes Dynamically extract, compile, and display USCG information. Presented in a multidimensional format according to mission, organization, and enterprise data system and/or department type. • Use a variety of interdependent filters to drill to the specific type and level of information needed. One Source One Answer One Coast Guard
- 69. Cube Toolbar Provides the ability to display or remove the graph gridlines. Provides the ability to display graph data in chart format. Provides alternatives to the way the cube information is displayed. The Options Menu includes: Display Options, Edit Title, Split View, Get Data Later, and Reset. Provides the ability to switch the rows and columns. One Source One Answer One Coast Guard
- 70. Cube Toolbar Provides the ability to add or remove rows, columns, and/or specific dimensions from the display. Provides the ability to insert a custom calculated column or row using the displayed data. Provides the ability to add ranks to a report so categories can be compared against each other. Provides the ability to hide columns and/or rows in a cube which contain nothing but zeroes or N/A (Not Applicable). One Source One Answer One Coast Guard
- 71. Cube Toolbar Provides the ability to remove rows and/or columns whose absolute values do not contribute to the top 80% of results. Provides the ability to automatically highlight exceptions that stand out in a report or crosstab. Provides the ability for a user to define exceptions that stand out in a report or crosstab and their formatting. One Source One Answer One Coast Guard
- 72. Cube Toolbar Provides the ability to create a defined group of data in a dimension. Provides the ability to view detail data that may not be available in the cube. Provides the ability to export cube data in various formats or prepare an IE bookmark Provides the ability to access to Online Help, Search Capability, and General Information about the cube. One Source One Answer One Coast Guard
- 73. i One Source One Answer One Coast Guard
- 74. One Source One Answer One Coast Guard
- 75. CGBI Questions/Help • For Questions, Concerns, Enhancement Requests, and so forth please contact OSC Customer Support (Help Desk): – Hours: Monday – Friday 6:30 to 18:30 EST – Phone: 877.USCG.SYS (877.872.4797) or 304.264.2500 – Web Form: http://csd.osc.uscg.mil/cghelp/ One Source One Answer One Coast Guard
- 76. “Urban Planning” Enterprise Strategy Defined: Aspirations, Plans, Stakeholders Enterprise Strategic Metrics Business Units Management Performance Metrics Business Functions Process Performance Metrics Business Process Metrics: Defined Performance Dimensions and Key Performance Indicators One Source One Answer One Coast Guard
- 77. Measuring the Real Drivers of Business Value Best Practices: 2. Collectively exhaustive and mutually exclusive Corporate Financial Metrics Business BU 1 BU 2 BU 3 Units – P&Ls KPIs KPIs KPIs KPIs KPIs KPIs Business Marketing Operations Marketing Operations Marketing Operations Functions Key Performance Indicators Key Performance Indicators Key Performance Indicators Business Op. 1 Op. 2 Op. 3 Op. 4 Op. 5 Op. 6 Op. 7 Op. 8 Op. 9 Operations Let's look at an example of a metrics that meet these criteria … One Source One Answer One Coast Guard
- 78. Business Intelligence linked with Performance Management 0 1 2 3 4 5 Acknowledge Enterprise Intraprocess Process Agile Interprocess Operational Valuation Automation Aware Business Automation Inefficiencies Control and Control Structure and Control BI Continuum Measure Decide Align Optimize Discover Innovate Analyze Align process with market alternatives driven strategy. by various optimization Model and techniques in Establish Create a analyze process Directly link real time. business Innovate new business governance. process performance businesses, processes. model and framework that products and Craft process rules to links business Measure services through automation and execution. valuation to and monitor Identify an agile business control across process process business structure. the enterprise, execution. owners. activities. Integrate customers and activity-based trading partners. accounting with process steps. Generally, where we are today One Source One Answer One Coast Guard
- 79. Performance Management • Performance Management - A fact-based approach to assessing, planning, and monitoring the controllable activities performed within the organization. One Source One Answer One Coast Guard
- 80. FEA as related to USCG FEA Model DHS Model Program Performance Performance Performance Mission Goals Objectives Programs Performance Measures Targets Results Goals Coast Guard Model http://cgea.uscg.mil/Pages/Default.aspx One Source One Answer One Coast Guard
- 81. Enterprise Architecture • Business Reference Model – What we do • Performance Reference Model – How we do it One Source One Answer One Coast Guard
- 82. Basic Performance Logic/ Reference Model (PRM) OUTCOMES OUTPUTS GOALS PROCESSES Activities • Tasks • INPUTS One Source One Answer One Coast Guard
- 83. Terms of Reference • Input – Any items required to perform a task • Process - A series of time-based activities that are linked to complete a specific output. – Activity - Work performed by people, equipment, technologies, or facilities • Task - The breakdown of work in an activity into smaller elements • Output - A product or service desired by a customer that is the immediate result of an activity. Outputs influence outcomes. • Outcome - The public benefit which the Coast Guard seeks to achieve or influence. One Source One Answer One Coast Guard
- 84. FEA PRM Strategic Outcomes Outcomes Mission and Business Customer Results Results Outputs •Customer Benefits •Services for Citizens •Service Coverage •Support Delivery of Services •Timeliness & Responsiveness •Service Quality •Management of Gov’t Resources •Service Accessibility Processes and Activities •Financial Processes •Productivity •Cycle Time and Timeliness •Quality •Security & Privacy •Management & Innovation Technology Inputs Human Other Fixed •Technology Costs •Quality Assurance Capital Assets •Efficiency •Information and Data •Reliability & Availability •Effectiveness Value One Source One Answer One Coast Guard
- 85. Relating the BRM and PRM PRM BRM Strategic Outcomes Business Area Service for Citizens: Mission and Customer Maritime Safety Business Results Results Line of Business Processes and Activities Commercial Vessel Safety Response Technology Human Other Fixed Capital Assets Sub-function Investigate Accidents Value One Source One Answer One Coast Guard
- 86. USCG Unified Performance Logic Model (UPLM) One Source One Answer One Coast Guard
- 87. USCG Unified Performance Logic Model (UPLM) Mission Execution PLM + Support PLM _____________________ Unified Performance Logic Model OPERATIONAL SUPPORT The intersection of the two models = Requirements & Capability One Source One Answer One Coast Guard
- 88. USCG UPLM Basic Execution Mission Requirements SUPPORT & Capability One Source One Answer One Coast Guard
- 89. UPLM Basic Details GOALS (External) OUTCOMES (External) Operational OUTPUTS Operational PROCESSES Activities • Tasks • INPUTS PROCESSES OUTCOMES (Readiness) SUPPORT OUTPUTS •Activities (Internal) (Internal) INPUTS GOALS •Tasks One Source One Answer One Coast Guard
- 90. Comments & Questions Comments & Questions One Source One Answer One Coast Guard
Hinweis der Redaktion
- <number>The leadership triad (leadership, strategic planning, and customer and market focus) directly relates to the outputs in the PRM. Mission and business results, as well as customer results, are a result of an organizations leadership and planning.Also, an organization achieves customer and business results because of the way it focuses on it’s customers.Baldrige’s Category 4 (measurement, analysis, and knowledge management) directly relates to the technology input of the PRM. The technology area of measurement includes data, efficiency, quality assurance…all things that could not exist without careful measurement, analysis, and knowledge management.Two categories in the results triad (workforce focus and process management) directly relate to both human capital and processes and activities in the PRM.Without workforce focus, effort put into developing and maintaining a quality workforce, there can be no growth in human capital. Process management directly relates to processes and activities in the PRM.Baldrige’s Category 7 (results) directly relates to the “value” of the PRM. What gives an organization its value? The results that it achieves.
- <number>
- Key Issue 1: The above picture of the urban sprawl surrounding Marrakech is meant as an analogy of the departmental BI Projects often based on bottom up requirements gathering. The see of buildings is meant to represent the hundreds or thousands of reports and other sources of analytic information scattered throughout a large company that have been built without a common architecture or governance strategy. <number>
- Partizanske, Slovakia
- <number>
- <number>
- <number>
- <number>
- <number>
- The requester should coordinate with “like-type” units to the greatest extent practical and engage the chain of command in the measurement process. Measures related to a program are owned by that program. The Measurement Steward provides access, configuration control and management of CG measures, but does not own the measures.
- <number>
- Measures Template (Formal)…CGBI Requirements Request (Informal)How is “Community” defined?BRM Relationship?Change “Measure Owner” to “Authoritative Source System”?Add Measure Owner (use list of top 4? Levels)How are “User Groups” defined? Classification Guidance…More Explanation on FACETS…What is the new direction for FACETS!!!!!!
- <number>
- At START: Measures Template (Formal)…CGBI Requirements Request (Informal)<number>
- Measures Template (Formal)…CGBI Requirements Request (Informal)<number>
- Populated/UnpopulatedMeasures Template CGBI Requirements Request<number>
- Measures Template (Formal)…CGBI Requirements Request (Informal)
- <number>
- Key Issue 1: The above picture of the urban sprawl surrounding Marrakech is meant as an analogy of the departmental BI Projects often based on bottom up requirements gathering. The see of buildings is meant to represent the hundreds or thousands of reports and other sources of analytic information scattered throughout a large company that have been built without a common architecture or governance strategy. <number>
- <number>
- How is “Community” defined?BRM Relationship?Change “Measure Owner” to “Authoritative Source System”?Add Measure Owner (use list of top 4? Levels)How are “User Groups” defined? Classification Guidance…More Explanation on FACETS…What is the new direction for FACETS!!!!!!
- <number>
- Key Issue: Why are BI and BPM technologies converging? BPM requires maturing the enterprise from a state of process-ignorance to process-awareness. Although the successful enterprise will pass through numerous stages, not all of them will traverse the full maturation model. This is understandable and there are benefits to be had at each stage of the process. Acknowledging business inefficiencies, the first step toward process-awareness, can be assisted by BI measurement and monitoring techniques and tools. Once a need for change is established, analysis and modeling of target business processes is the next natural step. Process automation — placing the modeled BPM process into action — gives way to process optimization, making the process more efficient and effective. Departmental processes give way to enterprise processes and enterprisewide benefits. Many enterprises will stop at this point. For those that continue, there are two high-value stages: 1) enterprise valuation control — creating a business performance framework that links business valuation (near real time) to process execution. This is where BI BPM convergence becomes reality. 2) Agile Business Structure — innovating new businesses, products and services through agile business architecture. BPM, like BI is a difficult journey. However, the rewards are substantial: ROI, increased stakeholder satisfaction and agility.Action Item: Join the governance of the BI and BPM maturity journey through common sponsors. Tactical Guideline: Growing BI and process maturity begins with proper assessment of where you stand. The degree of maturity is a good indicator of how much agility you may achieve.
- <number>
- <number>
- The BRM provides a framework facilitating a functional (rather than organizational) view of thefederal government’s lines of business (LoBs), including its internal operations and its servicesfor citizens, independent of the agencies, bureaus and offices performing them. The BRMdescribes the federal government around common business areas instead of through a stovepiped,agency-by-agency view. It thus promotes agency collaboration and serves as theunderlying foundation for the FEA and E-Gov strategies.While the BRM does provide an improved way of thinking about government operations, its trueutility as a model can only be realized when agencies effectively use it. The functional approachpromoted by the BRM will do little to help accomplish the E-Gov strategic goals if it is notincorporated into business-focused enterprise architectures and the management processes offederal agencies and OMB.The BRM is structured into a tiered hierarchy representing the business functions of the federalgovernment. Refer to Figure 2 for the BRM tiered hierarchy.
- <number>
- Use a streamlined version of the parable here to help communicate the definitions <number>
- FEA PRM also shows these five categories, Inputs, Processes, Outputs, Outcomes, and Goals (can be found in the value)Example: I just got a GPS for my new car; GPS company (i.e. – Magellan)Inputs: Technology, materials to build GPSProcesses: Actual building of GPS, how quickly (quantity vs. quality), how is it done (human labor, machine)Outputs: Physical GPS, services it provides, potential it has to help citizensOutcomes: what gives the business value? Making money? Helping people be more safe, helping people get from point A to point B more easily?Goals: Business objectives (i.e. – the majority of middle-income people who own GPS’s purchased them from our company)<number>
- BRM (recall previous example)Business Area: Maritime SafetyLOB: Subset of Maritime Safety, commercial vessel safety responseSub-function: investigate accidentsPRM – each box is an area of measurementThe focal point of a Business Area is your mission and business resultsThe focal points of a line of business are your processes and activitiesThe focal points of a sub-function are the customer results(Shown in red and purple) Mission and business-critical results in the PRM are aligned with Levels 1 (Business Areas) and 3 (Sub-functions) of the BRM. Included in these sections are Services for Citizens, Delivery of Services, and Management of Govt. Resources, as well as Service Quality, Service Coverage, Service Accessibility, Timeliness and Responsiveness, and Customer Benefit. These things are all outputs.(Shown in green) The direct effects of day-to-day activities and broader processes measured as driven by desired outcomes in the PRM are aligned with Level 2 (Lines of Business) of the BRM. Lines of Business include internal operations (processes), and this directly relates to the Processes and Activities category in the PRM.
- <number>
- The Requirements & Capability Module is primarily used for requirements and capability management and is an integral part of both the Support Logic Model and the Operational Logic Model. The performance of operational activities exposes operational issues and problems while consuming capability. Analysis of these issues and problems yields the Functional Requirements needed to accomplish the operational activities. Functional Requirements are then transformed and mapped into Implementing Capabilities by further analysis guided by the Support Goals and Strategic Support Goals. Where Implementing Capabilities currently exist, they are replenished by Support Outputs. As new Implementing Capabilities are identified, additional Support Outputs are defined that will provide the desired capability. From these outputs, necessary Support Activities are defined. When executed, Support Activities generate Support Outcomes that provide new, or replenish existing, capability. The Readiness Management System (RMS) provides an understanding of capability and capacity by measuring and monitoring status levels, consumption rates, and replenishment rates through six facets: people, training, equipment, supply, infrastructure, and information. The basic layers of the Requirements & Capability Module include:Functional Requirements. Detailed, measurable requirements needed to perform Operational and Support Activities. Functional Requirements are a direct result of analyzing problems/issues encountered during the performance of Operational Activities. Implementing Capabilities. The people, training, equipment, supplies, information, and infrastructure necessary to satisfy operational and support requirements. Functional Requirements may be satisfied by multiple Implementing Capabilities.
- <number>
- Where Implementing Capabilities currently exist, they are replenished by Support Outputs. As new Implementing Capabilities are identified, additional Support Outputs are defined that will provide the desired capability. From these outputs, necessary Support Activities are defined. When executed, Support Activities generate Support Outcomes that provide new, or replenish existing, capability.