1. Chapter 5
Processing of Seismic Reflection
Data
In this chapter, the steps are discussed of how to obtain a seismic reflectivity image from
seismic records. Here, we assume that the records only contain reflections. Before we
discuss these steps, we derive which property gives a reflection back from a boundary:
the impedance contrast, also called the reflectivity. Then we will discuss the main basic
steps of a processing sequence, commonly used to obtain a seismic image and common
to seismic data gathered on land (on-shore) as well as at sea (off-shore): CMP sorting,
velocity analysis and NMO correction, stacking, (zero-offset) migration and time-to-depth
conversion.
5.1 Making the seismic image: seismic velocity
As said in the last chapter, the goal of exploration seismics is obtaining structural subsur-
face information from seismic data. In the previous chapter we discussed different types
of ”noise” that are always present in raw seismic records. In this chapter we assume that
we analyze and process data that contain only primary reflected waves, and therefore we
assume that we have somehow removed all the noise elements. The task now is to obtain
an image of the subsurface from these data.
In this chapter, we will look at a basic processing sequence to obtain a seismic image
from the raw seismic data, containing only reflections. The most important information
that must be added to the data, is the seismic velocity. This is crucial for obtaining a
proper image. In this chapter it is discussed how to obtain a first estimate of the seismic
velocities of the subsurface, and how to use this information to make the final image.
The problem can also be seen as being information we measure at the surface, which is a
function of time, is mapped to the correct position in depth. In other words, we want to
convert ”time”-data to ”depth”-data.
78
2. The steps that will be considered here are common to seismic processing of data gath-
ered on land (on-shore) as well as at sea (off-shore). They are: CMP sorting, velocity
analysis and NMO correction (invoking velocities for imaging), stacking and migration
(again using velocities for focussing the energy). Although this is a basic processing se-
quence, it does not mean that this will always give a good image: on land topography
effects and the first layer can be the largest problem and have to be dealt with separately;
at sea the source wavelet is not always a clean one and one has to compensate for this
effect via so-called signature deconvolution.
5.2 Reflection and transmission at boundaries
Before we go to the process of how to make a seismic image from seismic records contain-
ing only primary reflections, it needs to be shown which characteristics are responsible
for giving a reflection at all. Therefore, in this section we will focus on the basic physical
and theoretical principles of reflection and transmission. To that end, the basic equations
describing wave motion in one direction will be used to derive an expression for the re-
flection and transmission coefficient at a boundary between two layers with different wave
speeds and densities. In Chapter 2, the solution for the wave equation was given:
p(x, t) = s(t ± x/c). (5.1)
For the solution of the reflection and transmission coefficients, it is easier to use the
expressions in the Fourier domain. The expression for the pressure in the Fourier domain
was given in Chapter 2, i.e.,:
P (x, ω) = S(ω) exp(±iωx/c). (5.2)
Let us consider figure (5.1). We defined a plane boundary between two regions with
different wave speeds and mass densities. The boundary will reflect some of the energy
back, and some will be transmitted. Above the boundary (x < 0), we will have a so-called
incident wave with some amplitude S(ω). In addition, we have a reflected wave above the
boundary, which is travelling in the opposite direction of the incident field. This reflected
field has a scaled version of the amplitude of the incident field. This scaling factor is called
R, which is called the reflection coefficient. Below the boundary (x > 0), we have a wave
travelling in the same direction as the incident field, but has a scaled amplitude due to the
transmission through the boundary. We call this amplitude T , which is the transmission
coefficient. So, above the boundary (x < 0), we have:
P (x, ω) = S(ω) exp(−iωx/c1 ) + RS(ω) exp(iωx/c1 ) (5.3)
Below the boundary (x > 0), we have:
P (x, ω) = T S(ω) exp(−iωx/c2 ) (5.4)
79
3. incident field: reflected field
S(ω) exp(-iωx/c1) S(ω) R exp(+iωx/c )
1
ρ , c1
1
boundary
ρ , c2
2
transmitted field
S(ω) T exp(-iωx/c2 )
Figure 5.1: Reflection and transmission at boundary between two media with different
properties.
80
4. We have defined the reflection and transmission coefficient, but we still need to quantify
them. This is achieved by posing the boundary conditions, which are that both the pressure
and the particle velocity must be continuous, i.e.:
lim P (x, ω) = lim P (x, ω) (5.5)
x↑0 x↓0
lim Vx (x, ω) = lim Vx (x, ω) (5.6)
x↑0 x↓0
The first boundary condition can be retrieved directly from the solutions for the pressure.
However, for the second boundary condition, we need to use the equation of motion, in
its Fourier-transformed version, which is:
1 ∂P (x, ω)
Vx (x, ω) = − (5.7)
iωρ ∂x
Working these out for the the regions above and below the boundary, we obtain respec-
tively:
1 1
Vx (x, ω) = S(ω) exp(−iωx/c1 ) − RS(ω) exp(iωx/c1 ) for x < 0 (5.8)
ρ1 c1 ρ1 c1
1
Vx (x, ω) = T S(ω) exp(−iωx/c2 ) for x>0 (5.9)
ρ2 c2
Now it is simply substituting the equations in the boundary conditions, and we obtain
for the reflection and transmission coefficient:
ρ2 c2 − ρ 1 c1
R = (5.10)
ρ2 c2 + ρ 1 c1
2ρ2 c2
T = (5.11)
ρ2 c2 + ρ 1 c1
These are the desired expressions. First notice that we have expressions in terms of
seismic impedances, which are the product of the wave speed with the mass density, i.e.,
ρc. Secondly, notice that the reflection coefficient is determined by the contrast in seismic
impedances of the different regions.
81
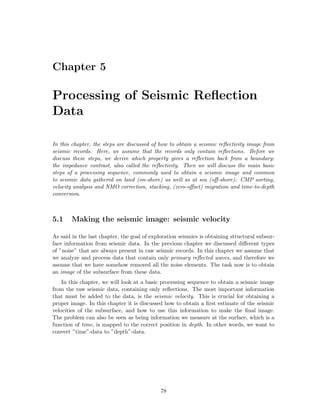
5. distance (m)
1000 1500 2000 2500 3000
0
0.5
time (s)
1.0
1.5
2.0
Figure 5.2: Shot gather measurement.
5.3 Sorting of seismic data
Common shot and common receiver gathers
When data is shot in the field, we record the shots sequentially. So by a record we
mean all the recordings from the sensors for a single shot experiment. Normally, the
measurement for one source at one receiver location is called a trace, which is a time
series of reflections. It is obvious that for each shot we will order these recordings (traces)
by increasing (or decreasing) offset. The offset is defined as the distance from source to
receiver. A simple simulated example of such a shot is given in figure 5.2. In this figure
on the left hand side the ray paths from source to the receivers of the seismic waves are
shown. Note that due to the different velocities in the different layers, the ray paths are
bended according to Snell’s law. For this record, one shot consists of the explosion from
one charge of dynamite (supposed it is measured on land). The data is stored in the
recording instrument and then put onto a magnetic tape, record by record.
When the next shot is fired, we do the same, record with the instrument and then
write the data onto tape. We say that the data is shot ordered. A section as shown in
figure 5.2 is commonly called a common-shot gather, or common-shot panel: we show the
recorded wave fields for one shot.
It can be guessed that if we talk about shot ordered data, we could also have receiver
ordered data. This is indeed the case. One could get all the shots together, of course in
82
6. an increasing shot position, belonging to one receiver position. Such a gather is called
a common-receiver gather (or panel). However, this assumes that during acquisition the
same receiver position is covered by different shots. In practice, we often make use of
reciprocity: interchanging source and receiver will give exactly the same response (if the
directional properties of the source and receiver can be considered identical). In fact figure
5.2 can also be considered as a common receiver gather, where all ray paths from different
shots come together at one receiver position.
Why should we need these distinctions? A nice feature about a common-shot gather is
to see whether a receiver position has a higher elevation than its neighbors and thus gives
an extra time shift in its record. This effect is called ”statics”. Therefore common-shot
gathers are good for detecting geophone statics. In the same way, we can see on common
receiver gathers whether a shot was set deeper than the neighboring shot positions, and
therefore common-receiver gathers are good for detecting shot statics.
offset
shot 1 o x x x x
source midpoints receivers
shot 2 o x x x x
shot 3 o x x x x
Figure 5.3: Midpoint definition in between sources and receivers.
Common midpoint gathers
The way of organizing the data in common-shot gathers is just a consequence of the
logistics in the field, but for some processing steps it is not a convenient sorting the data.
A commonly used way of sorting the data is in common-midpoint gathers. A mid-point is
here defined as the mid-point between source and receiver position. An illustration of the
mid-point is given in figure 5.3. We gather those traces that have a certain midpoint in
common, like in figure 5.3, the record from receiver 3 due to shot 1, and the record from
receiver 1 due to shot 2. Once we have gathered all the traces with a common-midpoint
(CMP) position, we have to decide how to order these records for one CMP, and the logical
choice is to order them by increasing (or decreasing) offset. A gather for one mid-point
position with the traces for increasing (or decreasing) offsets is called a common-midpoint
gather (or panel). Figure 5.4 shows a CMP gather for the same subsurface model as figure
5.2.
For what reason is the common-midpoint gather convenient? The most important one
is for stacking which we shall discuss in one of the next sections. Suppose the earth would
consist of horizontal layers as depicted in figure 5.5. Then the geometrical arrival from shot
to receiver all reflect right below the midpoint between the source and receiver, and thus
83
7. offset (m)
500 1000150020002500
0
0.5
time (s)
1.0
1.5
2.0
Figure 5.4: Common midpoint gather.
the reflection points in the subsurface then only differ in depths. With other words, all
the reflections measured at the different offsets in a CMP gather carry information on the
same subsurface points (below the midpoint position). If we would make a correction for
the offset dependence of the traveltime for each trace, the reflections from the same place
would arrive at the same time for all the traces, and thus we could add the traces together
to increase the signal-to-noise ratio. This process is called NMO correction and stacking
respectively, as will be discussed later. This argumentation is not valid for common-shot
gathers since the reflection points in the subsurface do not coincide for each trace (for a
horizontally layered earth). However, for a laterally varying medium, as shown in figure
5.4 the reflections within a CMP gather are coming still from a small region, and the
stacking procedure may still give acceptable results.
Common offset gathers
As can be expected, we can also form a common-offset gather, a gather in which we
collect all those source-receiver pairs that have a certain offset in common. Usually, we
shoot with fixed distances between source and receivers, and so we will have as many traces
in our common-offset gather as there are shots, thus often quite a large amount. For the
model of figure 5.2 and figure 5.4 the zero offset configuration (i.e. source and receivers
at the same positions) is shown in figure 5.6. Note that in the zero offset section the
general structures can already be recognized. Common offset gathers are used in prestack
migration algorithms since it can give a check on velocities. Migrating a common-offset
84
8. Figure 5.5: Common shot and common midpoint gather for horizontally layered earth.
distance (m)
1000 2000 3000 4000
0
0.5
time (s)
1.0
1.5
2.0
Figure 5.6: Zero offset gather.
gather for a small offset should give the same image as a migration of such a gather for a
large offset, otherwise the velocity used in the migration is not the right one.
A graph combining all this information is given in figure 5.7. Here we assumed we have
recorded along a line in the field, which we call the x-direction. Also, we have assumed
that we have 10 receiver positions with the first receiver at the source location (i.e. at zero
offset). On the horizontal axis we have plotted the x–coordinate of the source (x s ), while
on the vertical axis we have put the x–coordinate of the receiver (x r ). Then, each grid
point determines where a recording has taken place. In this graph a column represents a
85
9. xs
x
x x
x x x
x x x x CMP gather
x x x x x
x x x x x x
x x x x x x x
x x x x x x x x
x x x x x x x x x
x x x x x x x x x x common receiver gather
x x x x x x x x x x
x x x x x x x x x x
x x x x x x x x x x
x x x x x x x x x
x x x x x x x x
x x x x x x x common offset gather
shot gather x x x x x x
x x x x x
x x x x
x x x
x x
x
xr
Figure 5.7: Relation between different sortings of seismic data.
common-shot gather, and a horizontal line a common-receiver gather. A common-midpoint
gather is given by the line xs + xr = constant, which is a line at 45 degrees with a negative
slope. A common-offset gather is given by the line x s − xr = constant, which is a line of
45 degrees but now with a positive slope.
What can be noticed in the graph, is that we started out with 10 receiver positions
for each shot, while the CMP gather contains only 5 traces. Why that so? This can be
seen in figure 5.3. When we shift one source position to the next, we actually shift two
CMP’s because the distance between each CMP is half the source spacing. So a factor
two is involved. On the other hand there are twice as many CMP gathers, as the total of
traces in the survey is of course constant.
In figure 5.7 we assumed the spacing between the shot positions and the receiver
positions were the same but this does not need to be so. This also influences the number
of traces in a CMP. The number of traces in a CMP is called the multiplicity or the fold.
It can be shown easily that the multiplicity M is:
Nrec
M= (5.12)
2∆xs /∆xr
in which Nrec is the number of receivers per shot, ∆x s is the spacing between the shot
positions, and ∆xr is the spacing between the receivers.
In the above argumentation there is still one assumption made, and that is that the
earth is horizontally layered. When the earth is not like that, the reflection points do
not coincide any more, see figure 5.4. Still, the results obtained with this assumption are
86
10. 0
x
0.5
d R
time (s)
1
1.5
0 200 400 600 800 1000 1200 1400 1600 1800 2000
offset (m)
Figure 5.8: a) Distances in a subsurface model with one flat reflector. b) NMO curve
for geometry of a) with depth 300 m and velocity of 1500 m/s. The dashed line is the
parabolic approximation of the hyperbola.
very good, it only gets worse results when the dips of the layers of the earth are becoming
steep. We will come to that later on when discussing stacking.
5.4 Normal move-out and velocity analysis
NMO curve for single interface
The most important physical constant needed for obtaining an accurate image of the
subsurface, is the velocity of the medium. We record our data at the surface in time, and
what we wish to obtain is an image of the subsurface in depth. The link between time
and depth is of course the wave velocity. Unfortunately, it is not so easy to obtain a good
velocity model and this is often an iterative process. In this section we will discuss the
effect of the velocity on the obtained data. We will first discuss some simple models in
order to understand the features we can encounter in real data. As a consequence of this,
we will discuss which operations have to be applied to the data in order to obtain the
desired information. We assume here that we deal with a CMP gather.
Let us first consider the reflection from a single interface as depicted in figure 5.8. The
time for the geometrical ray from source to receiver is given by:
R (4d2 + x2 )1/2
T = = (5.13)
c c
in which x is the source-receiver distance, R is the total distance traveled by the ray, d is
the thickness of the layer and c is the wave speed. When we write 2d/c as T 0 , then we can
87
11. write this as:
1/2
x2
T = T0 1 + 2 (5.14)
c2 T0
note that this function describes a hyperbola. We can see that we have an extra time
delay due to the factor x2 /(c2 T0 ). The extra time delay is called the Normal Move Out,
2
abbreviated to NMO. This extra term is solely due to the extra offset of the receiver with
respect to the source; at coincident source-receiver position this term is zero. Often, the
square-root term in this equation is approximated by its one-term Taylor series expansion,
i.e.:
x2
T T0 + . (5.15)
2c2 T0
Figure 5.8b shows the traveltime curve for a layer of 300 meter depth and a velocity of
1500 m/s. The dashed line in this figure shows the parabolic approximation according to
equation (5.15).
In seismic processing we are not interested in the extra time delay due to the receiver
position: the image of the subsurface should be independent of it. The removal of the
extra time delay due to NMO is called the NMO correction.
NMO curve for more than one interface
Let us now move to a model with two interfaces, as depicted in figure 5.9. We call the
source-receiver distance x, the horizontal distance the ray has traveled in the second layer
x2 , the wave speed in the first layer c1 , and in the second c2 , the thickness of the first
layer d1 , and of the second d2 . Then the traveltime from source to receiver is given by:
1/2 1/2
(x − x2 )2 + 4d2
1 x2 + 4d2
T = + 2 2
(5.16)
c1 c2
1/2 1/2
2d1 (x − x2 )2 2d2 x2
= 1+ + 1 + 22 (5.17)
c1 4d2
1 c2 4d2
1/2 1/2
x21 x22
= T1 1 + + T2 1 + , (5.18)
T1 c2
2
1 T2 c2
2
2
in which T1 and T2 are the zero-offset traveltimes through the first and second layer
respectively, and x1 = x − x2 . The problem with this formula is that, if we assume that c 1
and c2 , are known, we do not know x2 . Therefore we cannot directly use this expression
to describe the move-out behaviour of this two-reflector model.
88
12. 0
x
d2 α R
0.5
x2
time (s)
1
d β
2
1.5
0 200 400 600 800 1000 1200 1400 1600 1800 2000
offset (m)
Figure 5.9: a) Distances in a subsurface model with two flat reflectors. b) NMO curve for
second reflector with depth 300 m of each layer and velocities of 1500 m/s and 2500 m/s
in the first and second layer respectively. The dashed line is the hyperbolic approximation
of the traveltime curve.
In order to tackle this, we first expand the square-root terms in equation (5.18) in a
Taylor series expansion as we did for the one-interface case:
x2
1 x2
2
T T1 + + T2 + . (5.19)
2T1 c2
1 2T2 c2
2
and we square this equation in order to obtain:
x21 x2
T 2 = (T1 + T2 )2 + (T1 + T2 ) + 22 + O(x4 ). (5.20)
T1 c2 T2 c2
1
In this equation, we still have the distances x 1 and x2 present. A relation between x1
and x2 can be found using Snell’s law at the interface, being:
sin α sin β
= , (5.21)
c1 c2
with α and β are the angles of the ray with the normal in layer 1 and 2 respectively,
when crossing the first interface (see also figure 5.9). We make an approximation for small
angles for which sin α ≈ tan α and sin β ≈ tan β, such that equation (5.21) becomes:
x1 x2
≈ , (5.22)
2d1 c1 2d2 c2
or
x1 x2
2 ≈ T c2 .
T1 c1
(5.23)
2 2
89
13. Writing this as x2 = (T2 c2 )/(T1 c2 )x1 and substituting this in x1 + x2 = x, we have:
2 1
T1 c2
1
x1 = x , (5.24)
T1 c2 + T 2 c2
1 2
Similarly for x2 , we obtain:
T2 c2
2
x2 = x . (5.25)
T1 c2 + T 2 c2
1 2
We can use equations (5.24) and (5.25) in the quadratic form of eq.(5.20) to obtain:
T1 c2 + T 2 c2
1 2
T 2 ≈ (T1 + T2 )2 + (T1 + T2 )x2 2 + T c2 )2 (5.26)
(T1 c1 2 2
(T1 + T2 ) 2
≈ (T1 + T2 )2 + x . (5.27)
T1 c2 + T 2 c2
1 2
This equation is of the form:
x2
T 2 = Ttot (0)2 + . (5.28)
c2
rms
with crms is what is called the root-mean-square velocity:
N
1
c2
rms = c2 Ti (0),
i (5.29)
Ttot (0) i=1
in which Ti (0) denotes the zero-offset traveltime through the i–th layer; T tot (0) denotes
the total zero-offset time:
N
Ttot (0) = Ti (0). (5.30)
i=1
We see here that with the assumptions made, a hyperbolic move-out for the interfaces
below the first one is obtained. The approximation however is a very good one at small
and intermediate offsets (for horizontal layers) but becomes worse when the offset becomes
large. This effect can be observed in figure 5.9b, where the hyperbolic approximation of
the second interface reflection is plotted with a dashed line.
Applying NMO correction
Then, how do we apply this NMO correction? First we have to determine the stacking
(i.e. root-mean-square) velocities for each zero offset time T 0 (see next section). Then, for
90
14. offset (m) offset (m)
500 1000 500 1000
0 0
time (s)
time (s)
0.5 0.5
1.0 1.0
Figure 5.10: CMP gather with one reflection before and after NMO correction.
each sample of the zero-offset trace will remain in its position. For a trace with offset x,
we calculate the position of the reflection according to equation (5.28) and find the sample
nearest to this time T . This sample is then time-shifted back with the time difference
between T and T0 (in fact it is mapped from time T to time T 0 ). In this simple scheme
we have taken the sample nearest to the time T , but in general we can be much more
accurate by using a better interpolation scheme. It is important to realize that with NMO
we interpolate the data.
An artifact of the NMO correction is the NMO stretch. An example of this effect is
shown in figure 5.10. How does this occur? We can see that the correction factor not only
depends on the offset x and the velocity c rms , but also on the time T0 . So given a certain
stacking velocity and offset, the correction T −T 0 becomes smaller when T0 becomes larger.
Thus, the correction is not constant along a trace, even if we have a constant offset and
constant velocity. Also, we can see from this correction that the effect will become more
prominent when the offset becomes larger as well. This effect is called NMO stretching.
Velocity estimation
In the application of the NMO correction, there is of course one big question: which
velocity do we use? Indeed, we do not know the velocity on beforehand. Actually, we use
the alignment of a reflection in a CMP gather as a measure for the velocity. Since, if the
velocity is right, the reflection will align perfectly. However, when the velocity is taken too
small, the correction is too large and the reflection will not align well; in the same way,
91
15. offset (m) offset (m) offset (m)
500 1000 500 1000 500 1000
time (s) 0 0 0
time (s)
time (s)
0.5 0.5 0.5
1.0 1.0 1.0
vnmo < vrms vnmo = vrms vnmo > vrms
Figure 5.11: CMP gather with one reflection after NMO correction with too low, correct
and too high stacking velocities.
when the velocity is chosen too big, the correction is too small, and again the reflection
will not align. An example of these cases is given in figure 5.11.
As the earth is consisting of more than one interface, we need to determine the veloci-
ties, although they may just be root-mean square velocities for each layer. The goal is the
same as in the case of just one interface: we would like all the reflections to be horizontally
aligned. A systematic way of determining these velocities is to make common-midpoint
panels which are each NMO corrected for a constant velocity. Then we can see for those
velocities the reflector will align or not; usually the deeper the interface the higher the
(root-mean-square) velocity. An example of such an analysis is given for a four reflector
median (see figure 5.5) in figure 5.12.
Another way of determining velocities is via t 2 − x2 analysis. For this analysis we have
to pick the traveltimes for a certain reflector and plot them as a function of x 2 . As we
have seen with multiple interfaces, the slope of this curve should be 1/c 2 S , and thus we
RM
know the stacking velocity. This method can be quite accurate but depends on the quality
of the data whether we are able to pick the reflection times from the data.
The most commonly used way of determining velocities is via the velocity spectrum,
which has some relation to the aligning of reflectors. What we do with a velocity spectrum
is that for a certain velocity, we correct the CMP gather and apply a coherency measure
to the data. This gives us one output trace. Then, for a next velocity, we do the same. For
92
16. velocity (m/s)
1300 1500 1700 1900 2100 2300 2500
0
0.5
time (s)
1.0
Figure 5.12: CMP gather NMO corrected with a range of constant NMO velocities from
1300 to 2700 m/s with steps of 200 m/s.
a complete set of velocities, we plot these results next to each other, which is then called
the velocity spectrum. On the vertical axis we then have the time, while on the horizontal
axis we have the velocity. As an example we consider again the synthetic CMP gather in
the model of figure 5.5, for which we calculate the semblance for velocities between 1000
m/s and 3000 m/s, see figure 5.13. The result we obtain is often displayed in contour
mode or color mode.
As a coherency measure, the semblance is most often used. The semblance S(t, c) at
a time t for a velocity c is defined as:
M 2
1 m=1 A(xm , t, c)
S(t, c) = M
, (5.31)
M m=1 A2 (xm , t, c)
in which M is the number of traces in a CMP and A is the amplitude of the seismogram
at offset xm and time t after NMO correction with velocity c. For the definition of other
coherency measures, the reader is referred to Yilmaz (1987, page 169, 173). Note that
if an event is perfectly aligned with constant amplitude for all offsets, the semblance has
value 1. Therefore, the semblance has always values between 0 and 1.
For a more extensive discussion on the velocity analysis we would like to refer to the
book of Yilmaz (1987, pp.166—182).
93
17. offset (m) stacking velocity (m/s)
500 1000 1000 1500 2000 2500 3000
0 0
0.5 0.5
time (s)
time (s)
1.0 1.0
Figure 5.13: CMP gather with its velocity spectrum, using a semblance calculation with
window length of 20 ms.
The effect of dip on move-out (Dip Move-Out)
When we applied the NMO correction to the CMP gather, we assumed we were dealing
with horizontal layers, giving rise to quasi-hyperbolic events. When we have dipping
reflectors, the NMO correction still corrects for the hyperbolic move out, but the velocities
we use are not the true velocities any more, since they include the dip of the reflector. In
order to obtain the true velocity, an extra term needs to be added, and the extra correction
for the dip is called Dip Move-out, abbreviated to DMO.
Let us consider figure (5.14). We see that when we take a line perpendicular to the
reflector at subsurface reflection point for a finite offset in the subsurface and take the
intersection of this line with the surface (z = 0), that this point does not lie half-way
between the source and receiver. This would not be so troublesome if the subsurface
reflection point would be the same for the neighboring source-receiver pair in the CMP.
But, as can be seen in the figure, the reflection points are smeared out over the reflector.
We will now derive the extra term due to the reflection-point smear. To this purpose,
consider figure (5.15). We have a source S with a geophone G; the distance between these
two is called 2xh , where the subscript h stands for half-offset. The depth of the reflector,
measured perpendicular to the interface at the receiver location, is called d G ; the depth
of the reflector half-way between S and G is called d H ; the angle of the reflector with
the horizontal is called α. When we take the image of the receiver, we can apply the
94
18. 0 200 400 600 800 1000 1200
0
50
100
150
200
250
300
350
400
Figure 5.14: The effect of a dipping reflector on the ray pattern.
”cosine-rule” to determine the distance R of the ray path from source to receiver, i.e.:
π
R2 = (2xh )2 + (2dG )2 − 2(2xh )(2dG ) cos( + α)
2
= 4x2 + 4d2 + 8xh dG sin(α)
h G (5.32)
so we see an extra term arising in the distance, and thus also in the traveltime. But before
writing down the traveltime, we should consider that we want to get the same common
reflection point for a CMP gather, so we do not want d G in the equation but dH . To this
effect, consider the extra lines drawn in figure (5.15) to determine the relation between
dH and dG . Hence,
dH = dH,1 + dH,2
= dG + xh sin(α) (5.33)
Now substituting dH for dG , we obtain:
R2 = 4x2 + 4(dH − xh sin α)2 + 8xh sin(α)(dH − xh sin α)
h (5.34)
= 4d2 + 4x2 cos2 α
H h (5.35)
This is the distance travelled by the ray, so the traveltime becomes:
R 4x2 cos2 (α)
h
t= = t2 +
H (5.36)
c c2
95
19. x x
h h
S H G
I
dG
d H,1
x
h
α
d H,2
Figure 5.15: A model to derive the DMO term.
in which tH is given by:
2dH
tH = (5.37)
c
We see that we have a dip-dependent velocity c dip which is related to the true velocity c
by cdip = c/ cos(α). The NMO correction with a velocity of c = c dip = c/ cos(α) will still
do a good job, only the velocity used for the correction is not the true one: it includes the
dip.
5.5 Stacking
A characteristic of seismic data as obtained for the exploration for oil and gas, is that they
generally show a poor signal-to-noise ratio, not only due to coherent events such as surface
waves, but also due to uncorrelated noise. Often, only the strong reflectors show up in
raw seismic data. An important goal in seismic processing is to increase the signal-to-
noise ratio, and the most important steps towards this goal, is CMP sorting and stacking
With horizontal stacking we add the NMO-corrected traces in a CMP gather to give one
output trace. A better nomenclature is perhaps horizontal stacking because we stack
in the horizontal direction. This is in contrast to vertical stacking, which is recording
the data at the same place from the same shot position several times and adding (i.e.
96
20. offset (m) offset (m)
500 1000 500 1000
0 0 1
0
0.2 0.2 0.2
0.4 0.4 0.4
time (s)
time (s)
time (s)
0.6 0.6 0.6
0.8 0.8 0.8
1.0 1.0 1.0
a) b) c)
Figure 5.16: CMP gather with 2 primaries and 1 multiple before (a) and after (b) NMO
correction and after stacking (c).
averaging) these results. With stacking, we average over different angles of incidence of
the waves, even in horizontally layered media. This means that we loose some information
on the reflection coefficient since, as the reader may know, the reflection coefficient of an
interface is angle-dependent. Therefore, the stacked section will contain the average angle
dependent reflection information.
In figure 5.16 a CMP gather with two -primaries and one multiple is shown before and
after NMO correction in figures (a) and (b), respectively. What can be seen in the figure
that after NMO, which is correct for the primary reflections, the multiple has not been
corrected properly. For the multiple, the velocity that is chosen at that time, is too large
compared to the velocity necessary for the multiple. Since the velocity is too large for
the multiple, the correction is too small so the wrongly corrected multiple still shos some
hyperbolic behaviour. The stacked result is obtained by adding all traces for a particular
time, so we add along the horizontal direction. The result of this adding, or stacking, is
given in figure (c). The resulting stacked trace shows a reduced multiple energy, which is
a desired feature of the stack.
Although the signal-to-noise ratio is increased by stacking, we will also have introduced
some distortions. We have already discussed the NMO stretch and the approximation with
the root-mean-square velocity. Therefore, when we add traces, we do not do a perfect job
so we loose resolution. The effect of an erroneous velocity for the NMO is shown in
figure 5.17, which shows a stacked section with the correct stacking velocities and with
7% too high stacking velocities for the data generated in the model of figure 5.2. One can
see that the stacked trace is getting a lower frequency content and that the amplitudes
are decreasing in some parts with the erroneous velocities. Note that a stacked section
simulates a zero offset section, but with much better signal to noise ratio. Compare
therefore the stacked result to the zero offset section of figure 5.6, which shows exactly
the same region (1000 - 4000 m) in the model. Note the resemblance of the stack with
97
21. distance (m)
1000 2000 3000 4000
0
0.5
time (s)
1.0
1.5
2.0
correct stacking velocities
distance (m)
1000 2000 3000 4000
0
0.5
time (s)
1.0
1.5
2.0
stacking velocities 7% too high
Figure 5.17: Stacked sections with correct and too high stacking velocities.
98
22. the zero offset section. Note also that the stack is twice as dense sampled in the trace
direction, due to the fact that there are twice as many CMP positions as there are shot
positions.
Finally, it should be emphasized that, with stacking, we reduce the data volume. The
amount of data reduction is the number of added traces in a CMP gather. There are
certain algorithms which are expensive to compute and are therefore applied to stacked
data rather than on pre-stack data. An example of this is migration as shall be discussed
in the next section.
5.6 Zero-offset migration
Introduction
Although we have removed some timing effects with the NMO correction, this does
not mean that we have removed the wave effects: it is just one of many. We still need to
”focus” the energy further. Migration deals with a further removal of wave phenomena via
focussing in order to arrive at a section which is a true representation of the subsurface.
After the NMO correction and stacking, we have only synthesized a zero-offset section,
since we removed the offset dependence of the receiver position with respect to the source.
That means, we have a section as if we did a seismic survey with source and receiver at
the same place, thus zero-offset. Migration could be defined as :
Migration is the focussing process which results in a true image of the subsurface from
primary-reflection data, assuming the velocity model is correct.
Equivalently, migration obtains the true image in (x, y, z) from data that are obtained in
(x, y, t), where x, y and z stand for the two horizontal and vertical coordinate, respectively;
again, under the assumption the velocity model is correct.
Three simple configurations and their zero-offset time sections
Let us consider the simple example of a point diffractor in the subsurface. A point
diffractor is like a ”ball” in the subsurface: when wave energy impinges on it, it scatters
(reflects) energy back in all directions. When the source and reciever are at the same
point at the surface, the receiver will only receive the ray that is scattered back as drawn
in picture 5.18. So notice that even not right above the diffractor, we will receive energy.
The (zero-offset) time section for a diffractor at position (x d , zd ) is described by:
2
2R 4(xs − xd )2
T2 = 2
= Td + , (5.38)
c c2
where R being the distance in a homogeneous medium with velocity c, T d being the time
2zd /c and xs being the surface position of source/receiver. This time section is (again) a
hyperbola. As may be clear now, a zero-offset section is not a good representation of the
subsurface, since that should be the left picture in figure 5.18. The process that converts
the right picture (hyperbola) into the left picture (ball) is called seismic migration.
99
23. x x
R
depth z
time T
Figure 5.18: A diffractor (left) and its seismic response (right), a hyperbola in the zero
offset section.
So far, we considered one point diffractor, but we can build up any reflector by putting
all point diffractors on that reflector. When the spacing between the point diffractors
become infinitely small, the responses become identical. This concept agrees with Huygens’
principle. As example, consider four point diffractors, as depicted on the top left of figure
(5.19). Each diffractor has the behaviour as discussed above, as can be seen on the right
of figure (5.19), but the combination of the time responses shows an apparent dip. The
actual dip goes, of course, through the apexes of the hyperbolae. In the next figures, the
number of point diffractors is increased to 8, 16 and 32. Note that for 32, the separate
diffractors are hardly observable any more, and the response also looks more like a dipping
reflector (with some end-point effects).
Let us now look at a full dipping reflector. Of course, it has some of the characteristics
as we saw with the point diffractors, only with a full reflector we no longer see the separate
hyperbolae. Actually, we will only see the apparent dip. As we saw with the point
diffractors, we need to bring the reflection energy back to where they came from, namely
the apex of each hyperbola. When connecting all the apexes of the hyperbolae, we get the
real dip. This is depicted in figure (5.20).
The next figure (5.21) quantifies the effect of migrating the energy to its actual location.
In particular, compare the figures in the middle and and on the right: the difference is
a factor cos θ, where θ is the dip of the reflector with the horizontal. The zero offset
traveltime at a certain x-value can be specified by t ZO = (2/c)x sin θ, assuming that x = 0
corresponds to the point where the reflector hits the surface in figure 5.21a. The slope in
the zero offset section is therefore dt/dx = (2/c) sin θ, see figure 5.21b. If this zero offset
section is migrated and the result is displayed in vertical time τ = z/c, the resulting slope
of the reflector is dτ /dx = (2/c) tan θ (figure 5.21c). Thus, migration increases the time
dip in the section by cos θ and thus reflectors in the unmigrated section are increased in
100
24. 0 0
depth
time
0 0
depth
time
0 0
depth
time
0 0
depth
time
Figure 5.19: Point diffractors (left) and their seismic responses (right). From top to
bottom: 4, 8, 16 and 32 points. Note the apparent dip from the hyperbolae.
101
25. θ
θ’
Figure 5.20: Relation between the reflection points in depth (a) and the traveltimes in the
zero offset section (b) for a dipping reflector (from Yilmaz, 1987, fig. 4-14).
their up-dip direction in the migrated section. At the same time, migration decreases the
apparent signal frequency by the factor cos θ. The reason that the dip is increased by cos θ
and the frequency decreased by cos θ lies in the fact that the horizontal wavenumber is
preserved.
Another commonly observed phenomena is the so-called ”bow-tie” shaped zero offset
response, due to synclinal structures in the earth. This is shown in figure 5.22, where it
can be observed how in the middle above the syncline multi-valued arrivals are present.
This behaviour canbe predicted by considering small portions of the reflected signal, and
increasing the dip of each portion of the reflected signal. Note that in figure 5.23 such
102
26. x x x
dt/dx = (2/c) sin θ
dt/dx = (2/c) tan θ
dz/dx = tan θ
z t τ
depth section zero offset section migrated zero offset section
Figure 5.21: Migration increases the dip in the zero offset section.
structures are also visible.
So far, we discussed three typical cases: point diffractor, dipping reflector and a syn-
cline. From field observation, we usually obtain much more complicated structures. An
example is given in figure 5.23. When we consider our typical configurations, we can well
(in a qualitative sense) understand the effect of migration of the real data set, as shown
in figure 5.23. We can observe that all the diffractions in the stacked section are well
collapsed after the migration.
Diffraction stack
So far, we haven’t described how to migrate a full dataset like the one shown in figure
5.23. The simplest case of a migration is adding (stacking) the data along hyperbolae. In
that case, each point of the section (each time and space point!) is seen as a diffractor.
As we saw in the 4-point-diffractor case compared with the dipping-reflector case, any
reflector can be synthesized by point diffractors (although infinite). So if each point of
the zero-offset time section is seen as a point diffractor (and the velocity is known), we
can add data along the particular hyperbola for that point. In case a real hyperbola is
present in the observed time section, due to a real point diffractor, energy will be added
up constructively to give a relatively large output signal (=migrated) at that point. In
0
0
0.05
50
100 0.1
z [m]
0.15
t [s]
150
200 0.2
250
0 100 200 300 400 500 600 700 800 900 1000 0.25
x m[m]
0.3
0 100 200 300 400 500 600 700 800 900 1000
x [m]
depth section with zero offset ray paths zero offset section
Figure 5.22: A syncline reflector (left) yields ”bow-tie” shape in zero offset section (right).
103
27. Figure 5.23: Stacked section (a) and its time migrated version (b) (from Yilmaz, 1987, fig.
4-20)
case no real diffractor is present, the energy along the hyperbola at that point does not
add up constructively and therefore the output signal (=migrated) will be small.
This procedure is called a diffraction stack. In the early days of computers the diffrac-
tion stack was used to apply the migration. In formula form, the diffraction stack is given
by (assumed to have a discrete number of x’s, being the traces in a zero offset section):
)2
(xs − xd
pzo (xd , td ) = pzo xs , t = t2 + 4
d , (5.39)
xs c2
where pzo stand for zero-offset data and c is the stacking velocity. From the formula it
may be obvious that data are added along hyperbolae for each output point (x d , td ), being
104
28. the apex of the hyperbola for point (x d , td ). (Note that we used the same notation as in
equation 5.38.) What we do when stacking along hyperbolae, is actually removing the
wave propagation effect from a point diffractor to the source/receiver positions. A very
nice feature about the diffraction stack is that it visualizes our intuitive idea of migration,
and is very useful in a conceptual sense. Of course, for this procedure to be effective we
need to know the stacking velocity.
What is lacking in the approach of the diffraction stack is the basis on deeper physical
principles than (kinematic) ray theory alone. The final migrated result may be correct in
position (if the diffraction responses can be assumed to have a hyperbolic shape, i.e. if
the subsurface exhibits moderate variations in velocity), but not in amplitude.
Zero-offset migration and wave theory: Exploding reflector model
In this subsection we are going to look at the so-called exploding reflector model.
It helps us in understanding the migration process. Consider a simple model with one
reflector in the subsurface. When we have a source which emits a signal at t = 0, the
signal will propagate through the medium to the reflector, will be reflected and will arrive
back at the receiver (= shot position for a zero offset experiment). This is shown in figure
5.24 at the left-hand side. Say the wave takes a time T to do this. Apart from some
amplitude differences, the data recorded in such a way would be the same if we could fire
off the sources on the reflector at time 0 but assume half the velocity of the medium in
between. Putting the imaginary sources this way on the reflector is called the exploding
reflector model. This is shown in figure 5.24 at the right-hand side. If we put the sources
on the reflector this way, we could synthesize the response at the surface, also in the case
the velocity is laterally varying. In this way, the shape can be not purely hyperbolic, which
is often the case in real observations.
The next item has to do with the fact that we record in time, while we want to obtain
properties in depth. In 3-D seismic, we record (x, y, t) and want to obtain an image in
(x, y, z). The link between these two is the so-called imaging condition. Say, we have
recorded the data at time T , and would keep track of the time to get back from time T
to the reflector. Then, we would obtain the image at time t = 0, again assuming we have
taken the right (i.e. half the original) velocity. Because we take the time to be zero, the
result does not depend on time any more, and we obtain an image in depth. The condition
of t = 0 is called the imaging condition.
The other effect we can investigate and did not mention before, is the effect of the sub-
surface on the amplitude of the signal. The most well-known one is geometrical spreading,
the effect that when observations are made at a larger distance, the amplitude is smaller
due to wavefront spreading. In case of the exploding reflector model, first each exploding
source should have the strength of the reflection coefficient of the reflector, and second it
should take into account the geometrical spreading. In this way, we will see that along a
hyperbola (in case of constant velocity), the amplitude is changing.
105
29. c c/2
Figure 5.24: Exploding reflector model for zero offset data. A zero offset measurement
can be considered as an exploding reflector response in a medium with half the velocity.
In the above, we have discussed aspects that can be derived from fundamental laws of
physics but the derivation falls outside the scope of these lecture notes. When applying
the fundamental laws to this migration problem, we get the formula known as Kirchhoff
migration (Schneider, 1978). The data is recorded at the surface. Let us call our surface
measurement pzo , where the subscript zo stands for zero offset. Then we set c → c/2 in
order to correct for two-way traveltime. Then, we calculate the response for each point in
the subsurface and put t = 0, the imaging condition, which images the exploding reflector
which starts to act at t = 0. With other words, we start with our measurements at the
surface and do a downward continuation (inverse wave field extrapolation) to all depth
levels, and pick the t = 0 point at each subsurface point. If there was a reflector at a
certain point, it will be imaged with this procedure. If there is no reflector at a certain
depth point, no contribution at t = 0 is expected for that point. So we can obtain a depth
section by integrating over the surface to obtain (Schneider, 1978):
−1 pzo (xs , 2R/c)
p(x) = ∂z dAs . (5.40)
2π z s =0 R
Remember that R is the distance between the output point on the depth section and
the particular trace location on the surface z s = 0. So as we integrate along the surface
z s = 0 we are actually summing along diffraction hyperbolae (in the case of a constant
velocity medium), defined by the time curve t = 2R/c, but then in a weighted fashion.
Note indeed the large resemblance with the diffraction stack definition of equation (5.39).
The extra 1/R factor takes the spherical divergence of the wave front into account and
the factor ∂z compensates for the frequency dependent and wave front angle dependent
effects of the lateral summation process. Note that the integral over surface A s will
numerically be implemented as a summation over all (x s , ys ) positions, i.e. a summation
over all traces in the seismic section. Although the diffraction stack of equation (5.39) has
been written as a summation over xs only, the extension to 3D by adding a summation
over the ys coordinate is straightforward; in that situation the hyperbola is replaced by a
hyperboloid: Ts = T 2 + 4[(xs − x)2 + (ys − y)2 ]/c2 .
2
For inhomogeneous media, the diffraction responses are no longer hyperbolic, and the
106
30. y
p(x,y,z=0,t)
x
p(x,y,z,t)
z
p(xs ,y s ,z s =0,t+2R/c)
Downward extrapolation: p(x, y, z, t) = −1
2π ∂z xs ,y s R dxs dy s
Figure 5.25: Downward continuation step used in migration.
concept of diffraction stack is wrong. Here, we are doing the summation much better than
the diffraction stack because we have included the wave equation.
The complete 3D zero offset migration procedure can now be as follows:
• Step 1 : Extract or simulate by stacking the zero offset dataset p(x, y, z = 0, t).
Consider this to be measured in a half-velocity medium with exploding reflectors .
• Step 2 : Do a downward continuation (inverse extrapolation) step from the surface
level to a level in the subsurface. For this extrapolation step we need the velocities
in the subsurface. This extrapolation is visualized in figure 5.25.
• Select at each depth level the zero time component, which yields the migrated section:
pmig (x, y, z) = p(x, y, z, t = 0). (5.41)
Our final result is a depth section, as we would obtain when we would make a geolog-
ical cross-section through the subsurface (of course with a limited resolution). However,
migration is not a simple process without any artifacts, and most importantly, we usually
do not exactly know the velocity as a function of x, y and z. Therefore, we would like
to be able to compare our original stacked section with the migrated section directly in
order to see what the migration has done. Especially seismic interpreters need this type
of comparison. To this aim, the depth coordinate z is mapped backed onto time τ via:
z
τ= (5.42)
c
107
31. for a constant-velocity medium. For an inhomogeneous subsurface, this mapping is more
complicated. For this purpose often ray-trace techniques are used to locate the reflectors
in time.
Time migration using the stacking velocities
To overcome the problem of not knowing the interval velocities in your medium, people
have thought of a work-around, using the stacking velocities. As we have done a stack in
general, the stacking velocities are already known. For a good migration we need to know
the distance R from subsurface point to the surface (which depends on the velocities in
the subsurface). It is often assumed that this path can be approximated by a straight line
(as in a homogeneous medium) using the stacking velocity. Therefore, R is replaced by:
4xs2 + 4y s2 1/2
R/c ≈ τ = (τ 2 + ) . (5.43)
c2
rms
Furthermore, the extrapolated data is considered in migrated time τ and not in depth.
This describes a diffraction stack, but now again in a weighted fashion, according to wave
theory. In these type of migrations, it is assumed that the structures in the subsurface
are simple enough to use the hyperbolic approximation of the response of an exploding
reflector source.
Effects of wrong migration velocities
The only important parameter we can actually set is the velocity distribution. It is
therefore important to know how a wrong velocity distribution will manifest itself in the
final result. This is shown in figure 5.26 where we see a correctly and incorrectly migrated
V-shaped reflector response. Note again the effect of migration: the increase of the slopes
and the collapsing of the diffraction hyperbola into a point (i.e. the edge of the V-shape).
When we put the velocity too low, the diffraction hyperbolae are not completely collapsed
yet and we keep a hyperbola in our result. Such a section is undermigrated. In the same
way, when the velocity is too high, then the diffraction hyperbolae are corrected too much,
and an over-migrated section will arise. As such, migration can also be used to determine
velocities: it is th´t velocity that images the diffractor(s) in its original point with no
a
diffraction effects visible anymore. A well-known effect of over-migrated sections is the
creation of so-called ”migration smiles” and crossing events, as visible in figure 5.27.
5.7 Conversion from time to depth
In the previous section we have spoken of time and depth migration, referring to whether
the output section is in time or depth, respectively. In time, we do not need to know the
velocities that well, stacking velocities will often do. In depth migration we need to know
the velocities very well, which is often a difficult task. Still, our goal is to obtain a section
108
32. distance (m) distance (m)
500 1000 500 1000
0 0
time (s)
time (s)
0.5 0.5
1.0 1.0
zero offset section migration, correct velocity
distance (m) distance (m)
500 1000 500 1000
0 0
time (s)
time (s)
0.5 0.5
1.0 1.0
migration, too high velocity migration, too low velocity
Figure 5.26: Stacked section and its time migrated version with the correct and wrong
velocities.
109
33. Figure 5.27: Stacked section and its time migrated version with the correct and wrong
velocities (from Yilmaz, 1987, fig. 4-54).
which is as close as possible to a geological cross-section; to that effect we want to have
our section in depth. In this section we will briefly discuss the conversion from time to
depth, via so-called Dix formula, valid for media varying slowly in lateral direction.
Dix formula
Let us first consider a model with plane horizontal layers. We showed earlier in this
110
34. Chapter that we could determine the root-mean-square velocities from the interval veloc-
ities via:
N
1
c2
rms,N = c2 Ti (0),
i (5.44)
Ttot,N (0) i=1
where we have included an extra N in the notation of c rms,N and Ttot,N . We can invert
this formula, which means that we can determine the interval velocities from the root-
mean-square velocities. When we consider the root-mean-square velocities for N = 2 and
N = 3, we have:
c2 T1 (0) + c2 T2 (0)
c2
rms,2 =
1 2
(5.45)
T1 (0) + T2 (0)
c2 T1 (0) + c2 T2 (0) + c2 T3 (0)
1 2 3
c2
rms,3 = (5.46)
T1 (0) + T2 (0) + T3 (0)
We bring the denominator on the right-hand side to the left-hand side, subtract the first
equation from the second, and obtain:
c2 2 2
rms,3 (T1 (0) + T2 (0) + T3 (0)) − crms,2 (T1 (0) + T2 (0)) = c3 T3 (0) (5.47)
in which we recall that T3 (0) is the zero-offset traveltime through layer 3, so in fact the
difference between the total time up to the time at level 3 minus the time at level 2, so
T3 (0) = Ttot,3 (0) − Ttot,2 (0). So then the interval velocity c 3 becomes:
1/2
c2 2
rms,3 Ttot,3 (0) − crms,2 Ttot,2 (0)
c3 = (5.48)
Ttot,3 (0) − Ttot,2 (0)
The values for crms,n and Ttot,n can directly be obtained from the velocity file as used for
stacking the data. This is Dix formula (Dix,1955). Dix’ formula converts RMS-velocities
to interval velocities.
In our procedure to get a depth section for a model with horizontal plane layers, we
convert the time axis on our (zero-offset) stacked section to a depth axis using this formula.
Although we derived Dix formula for horizontal layers, the formula will still be good
when we have mild lateral velocity variations. It has been shown that even in the case of
dipping events, the formula will still be good. In that case however, in order to obtain a
good depth section, we must first time-migrate the data before we can convert the time
axis to a depth axis.
Check–shot survey or Vertical Seismic Profile (VSP)
In general, the velocities obtained from the velocity analysis is not very accurate for
depth determination of reflectors. The RMS velocities are accurate in the sense that they
111
35. align reflectors in a CMP gather. However, for a correct positioning in depth, the RMS ve-
locities or updated velocities after migration must be converted to interval velocities. Still,
the interval velocities determined this way are not good enough for accurate positioning.
Therefore, in practice, a so–called check-shot survey is done. A check–shot survey
consists of a set–up where a geophone is put in a well while a source is put at the surface
near the well. Another name often used, is a Vertical Seismic Profile, or VSP. This will
be the main topic of the next chapter, but at this moment it suffices to say that in such
a set–up we know the depth of the receiver as well as the time of the direct arrival. So
from many recordings at many depths along the well, we can determine the velocities of
the intervals between the subsequent recording depths and therefore the velocity model.
This gives, at the scale of wavelengths of the surface seismics, a velocity model accurate
enough to convert the seismic data from time to depth.
112