2. 15 m depth by inverting first-arrival traveltimes using the regular-
ized inversion algorithm of Zelt and Barton ͑1998͒. This algorithm
typically has been applied to crustal-scale 3D data sets ͑e.g.,
Schlindwein et al., 2003; Ramachandran et al., 2004͒, although
Deen and Gohl ͑2002͒ have used it in a mining application to ap-
proximately 100 m depth. This is the first time the Zelt and Barton
͑1998͒ algorithm has been applied in three dimensions to the near-
surface ͑Ͻ20 m͒ environment. Dana et al. ͑1999͒ have applied the
Zelt and Barton algorithm to 2D data from a pilot survey at OU2 and
imaged the known geology and a channel feature important to reme-
diation efforts.
The areal dimensions of the 3D study area are nearly 1000 times
smaller than a typical crustal survey study area, but the center fre-
quency is only about 10 times higher; the typical center frequency
for crustal data is approximately 5 Hz. Therefore, a wave traveling
the length of the model ͑100 m͒ consists of only 5–10 wavelengths
at the center frequency. The relative change in velocity over a short
distance is also very different from a crustal survey. From the 2D pi-
lot study, we know that velocity increases by at least a factor of five
in the upper 15 m ͑Dana et al., 1999͒ or a velocity gradient of
ϳ80 s−1
, compared with a typical crustal velocity gradient of
ϳ0.1 s−1
. Our study serves as a test of the 3D refraction method to
characterize the shallow environment accurately and thereby to aid
remediation efforts. The resulting 3D velocity model is compared to
the known structure of the subsurface from well data and the results
of other seismic surveys at the site.
GEOLOGIC SETTING AND SITE
CHARACTERIZATION
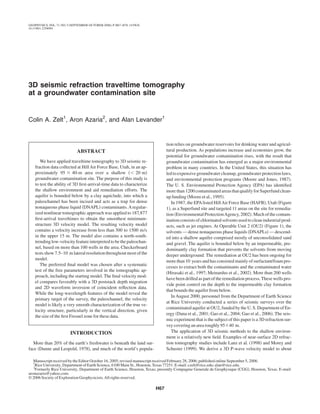
HillAir Force Base is located 60 km north of Salt Lake City, Utah,
west of the Wasatch Mountains and east of the Great Salt Lake ͑Fig-
ure 1͒. The Great Salt Lake is a remnant of the ancient glacial Lake
Bonneville, a large terminal lake that existed roughly 32,000–
14,000 years ago.TheWeber River delta, which supplied Lake Bon-
neville, is between the Wasatch Mountains and the Great Salt Lake.
It was formed during the Pleistocene epoch by the Weber River as it
flowed into the eastern edge of Lake Bonneville ͑Curry, 1980͒.
HAFB is built on a plateau west of the Weber River Valley and
rests on deltaic sediments of the Provo Formation, composed prima-
rily of sand and gravel.The Provo Formation was deposited as sheet-
flood lobes, braided channels, sieve deposits, and debris flow on a
wave-reworked lacustrine fan delta ͑Curry, 1980͒. The Weber delta
changed locations many times, leading to the deposition of laterally
heterogeneous sands and gravels ͑Feth, 1955͒. Beneath the Provo
Formation, which ranges in thickness from 2–15 m, lies the Alpine
Formation, composed primarily of clay and silt and also a product of
Weber delta deposition during the Pleistocene. The Alpine Forma-
tion is at least 17 m thick, and Cambrian basement lies beneath it.
HAFB has been active since the early 1940s and covers 27 km2
͑Figure 1͒. For about 20 years, liquid degreasing solvents and jet
fuel were deposited as waste into the ground at various sites located
at the outer edges of the base. These sites include landfills, disposal
pits, and spill areas. HAFB began investigating releases in 1976
when a civilian reported an orange discharge from a spring on his
property near the base boundary ͑Environmental ProtectionAgency,
2002͒.As a result, theAir Force, Utah Department of Environmental
Quality, and EPA began investigating and cleaning up the contami-
nation. The EPA placed HAFB on the Superfund National Priorities
list on July 22, 1987.
Site OU2 is located on the northeastern boundary of HAFB and
was used from 1967 to 1975 to dispose unknown quantities of sol-
vents into at least two unlined disposal trenches. The disposal pro-
cess resulted in groundwater contamination from trichloroethene
͑TCE͒, trichloroethane ͑TCA͒, and tetrachloroethylene ͑PCE͒ ͑Ool-
man et al., 1995͒. These solvents are DNAPLs because they are im-
miscible with water and have a higher density than water. During
vertical migration, DNAPLs may be captured by capillary forces in
the aquifer’s pore space, but most of the substance will sink until it
comes in contact with a low-permeability surface, resulting in the
formation of DNAPL pools at the bottom of the aquifer. More than
200 monitoring wells drilled as part of the remediation efforts at
OU2 have shown that pools of DNAPL lie at the base of the Provo
Formation at depths of 10–15 m ͑Hirasaki et al., 1997͒.The underly-
ing Alpine Formation functions as an impermeable boundary to the
DNAPLand the shallowest water table at approximately 9–10 m be-
low the surface.
Accurate characterization of the top of theAlpine Formation is in-
tegral for remediation efforts because the DNAPL tends to pond in
the topographic lows at the top of the clay surface. The depth to the
clay surface was recorded at 267 monitoring wells at OU2, of which
141 are within the 95ϫ40 m area of the 3D refraction survey.The to-
pography of the clay surface determined from the well data led to the
discovery of a paleochannel incised into the clay, trending roughly
north to south ͑Figure 2͒.At OU1, 1.3 km southeast of OU2, Young
and Sun ͑1996, 1998͒ used ground penetrating radar ͑GPR͒ to image
the top of the clay, although the presence of clay strongly attenuated
the GPR signal. Nevertheless, their results clearly demonstrate the
strong heterogeneity of the local geology.
3D EXPERIMENT AND DATA
In 2000, a team of about 20 people led by personnel from the De-
partment of Earth Science at Rice University conducted a series of
seismic experiments at OU2, including a 3D refraction survey, 3D
reflection survey ͑Dana et al., 2001; Gao et al., 2004͒, and combined
dual vertical seismic profile/surface experiment ͑Gao et al., 2006͒.
The 3D refraction and reflection experiments both occupied an area
of roughly 95ϫ40 m, centered over a portion of the buried pale-
Figure 1. Aerial photo of Hill Air Force Base. The study area is in
Operable Unit 2 in the northeast section of the base near the Weber
Canal. Dashed line marks the boundary of the base. Inset shows lo-
cation of base in northeastern Utah between the Wasatch Range and
the Great Salt Lake.
H68 Zelt et al.
3. ochannel ͑Figure 2͒.The seismic experiments were surveyed using a
Topcon Total Station unit, providing location accuracy of better than
10 cm. The ground surface is fairly smooth, with a gradual increase
in elevation to the south and a total relief of about 2.5 m.The average
elevation is nearly 1 m above the survey datum, which corresponds
to 1430 m above sea level; this datum is zero in our models.
The 3D refraction survey geometry consists of a single deploy-
ment of 601 receivers in a stationary grid, each receiver consisting of
a single-channel RefTek 125 Texan recorder attached to a 40-Hz
Mark Products vertical geophone ͑Figure 2͒. There are 45 east-west
lines consisting of alternating rows of 13 and 14 geophones with an
inline receiver interval of 2.8 m. The crossline spacing is 2.1 m,
with each line staggered by 1.4 m relative to the adjacent line. To-
ward the southern end of the survey, the lines sys-
tematically shift to the east, ending roughly 7 m
east of the lines in the north ͑Figure 2͒. The shot
locations are 0.3 m east of each receiver station.
A single shot from a .223-caliber rifle was fired
into a 6-cm-deep hole drilled into the ground be-
side each receiver. Because of onsite obstacles
such as propane tanks and trailers, 48 shot or re-
ceiver stations deviate slightly from the standard
geometry and seven stations have no shots or re-
ceivers, while no shots were fired at an additional
five stations. There were 596 shots, yielding
about 360,000 traces and a maximum source-re-
ceiver offset of 102 m. To our knowledge, this is
the most dense 3D refraction experiment in terms
of the number of shots and receivers ͑ϳ600
each͒.
The data were recorded using a 1-ms sample
rate and contain frequencies ranging from about
40–250 Hz ͑Figure 3͒. The dominant frequency
varies from 40 to 80 Hz. The data were pro-
cessed minimally using only a 40–80–240–400
-Hz band-pass filter and notch filters of 60 and
120 Hz to remove ground roll, low-frequency
cultural noise, and noise from onsite electrical
equipment.After filtering, the dominant frequen-
cy of the data is near 75 Hz ͑Figures 3 and 4͒. The
airwave obscures refracted energy at offsets less
than about 12 m because the seismic velocity of
air ͑ϳ330 m/s͒ is faster than the seismic velocity
of the near surface ͑Dana et al., 1999͒. Despite
filtering, the data contain significant noise from
U. S.Air Force jets and remediation activities, in-
cluding pumps in monitoring, injection, and ex-
traction wells.
A 3D reflection experiment was carried out
over the same area as the refraction experiment
using the same east-west recording lines and rifle
source as the refraction survey ͑Dana et al., 2001;
Gao et al., 2004͒. The survey took 16 days to
complete, compared to two days for the refraction
survey, and produced a nominal fold of 52. The
reflection survey took more time because it in-
volved many more shots and a rolling geophone
array, as compared to a static array for the refrac-
tion survey.Acomparison of the 3D refraction ve-
locity model with a 3D depth-migrated common-
midpoint ͑CMP͒ stack, and the results of 2D waveform inversion of
the reflection data are presented later.
Traveltime picking and uncertainties
A semiautomated interactive picking program was used to pick
the first arrivals of the 360,000 traces. A total of 187,877 picks from
349 shots were made; the remaining 40% of the shots were not pick-
able because of noise ͑Figure 2͒. Traveltimes were picked from shot
gathers plotted versus offset in 12° azimuth bins ͑Figure 4͒. The bin
aperture is a compromise between minimizing the variability in
first-arrival time at different azimuths as a result of 3D structure and
maximizing the number of traces. About every tenth trace was
Figure 2. Experimental geometry of 3D refraction survey superimposed on the depth to
clay from well data. White xs are shot locations. Green circles indicate shots for which
traveltimes were picked. Black dots are receiver stations. Pink dots are well locations.
There is some clipping of the depths to emphasize the paleochannel structure.
3D seismic refraction tomography H69
4. picked manually, and an automatic picker was applied to the inter-
vening traces using the crosscorrelation between the unpicked traces
and the two adjacent picked traces.
The uniform areal distribution of shots and receivers over the sur-
vey area has the advantage of providing uniform illumination of the
subsurface but the disadvantage of spatial aliasing in both the inline
and crossline direction. Results from a 2D pilot survey at OU2 using
a 0.35-m receiver spacing clearly show that the near-offset
͑Ͻ12 m͒ refracted P-wave is slower than the airwave ͑Dana et al.,
1999͒. However, it generally is impossible to distinguish the refract-
ed arrival from the airwave in the 3D data because of the coarser re-
ceiver spacing ͑2.8 m inline and 2.1 m crossline͒. Therefore, the
first-arriving energy, interpreted to be an amalgamation of the air-
wave and refracted wave, was picked and regarded as a body wave.
The effect this has on the final model is addressed later. Only about
10% of the picks are in this near-offset region ͑Ͻ12 m; Figure 5a͒
The target of the survey, the paleochannel, is up to 15 m below the
surface ͑Figure 2͒. For refracted waves to sample to this depth, a
minimum offset of 25 m is required, based on the results of the 2D
pilot survey ͑Dana et al., 1999͒.About 67% of the picks have an off-
set greater than 25 m, providing confidence that the paleochannel is
sampled adequately by the data.
The dominant frequency of the filtered data is roughly 75 Hz, cor-
responding to a quarter-period of 3.3 ms.Arule of thumb for picking
accuracy is that an arrival can be identified at best to within one-
quarter of the dominant period because if two waves arrive within
this interval, they will add constructively and cannot be distin-
guished from one another. Picking accuracy is further degraded by
the presence of noise. To estimate the total pick uncertainty, the time
difference of the picks from reciprocal source-receiver pairs was ex-
amined ͑Figure 5b͒. About 56% of the reciprocal pairs are within
5 ms, and 86% are within 10 ms. Considering the frequency content
of the data and the reciprocal differences, picks were assigned an un-
certainty of 5 ms for traveltime inversion.
Figure 3. Frequency spectrum for a typical raw ͑dashed͒ and filtered
͑solid͒ shot gather using a filter with notches at 60 and 120 Hz and a
40-80-240-400-Hz band-pass. The spectra have been normalized to
the same peak value.
Figure 4. Data examples.The traces for three shot gathers are plotted
versus source-receiver offset within a 12° azimuth bin. Plot of the
survey geometry to the right of each gather shows the shot location
͑large dot͒ and the trace aperture window. The data are shown trace
normalized and filtered as described in Figure 3. First-arrival picks
are indicated by horizontal marks on each trace.
Figure 5. ͑a͒ Histogram of number of traveltime picks versus source-
receiver offset in 2.1-m bins. ͑b͒ Histogram of number of shot-re-
ceiver pairs versus reciprocal time difference in 1-ms bins.
H70 Zelt et al.
5. 3D REFRACTION TOMOGRAPHY
We use the 3D first-arrival regularized tomographic method of
Zelt and Barton ͑1998͒ in which the simplest model is sought that
predicts the picked traveltimes to within an accuracy consistent with
their assigned uncertainties. This algorithm is designed to yield a
model with the minimum amount of structure required by the data.
Traveltime inversion is a nonlinear problem because the raypaths are
dependent on the velocity model. Therefore, a linearized iterative
approach is applied using a Taylor series expansion in which a start-
ing model is required and the model and raypaths are updated over a
series of iterations until the normalized misfit 2
between the ob-
served and predicted data ideally reaches one ͑Bevington, 1969͒:
2
=
1
N
͚i=1
N
ͫti
o
− ti
p
i
ͬ2
, ͑1͒
where N is the number of data points, ti
o
and ti
p
are the ith observed
and predicted traveltime, and i is the assigned picking uncertainty.
At each iteration, an objective function ⌽, which measures a com-
bination of the data misfit and the structure of the model, is mini-
mized in the least-squares sense ͑Menke 1989͒:
⌽͑s͒ = ␦ tT
Cd
−1
␦ t + ͓␣͑sT
Wh
T
Whs + sz sT
Wv
T
Wv s͒
+ ͑1 − ␣͒␦ sT
Wp
T
Wp␦ s͔, ͑2͒
where ␦ t is the traveltime misfit vector, s is the model slowness vec-
tor, ␦ s is the perturbed model vector equal to s − so, so is the starting
model vector, Cd is the data covariance matrix that contains the esti-
mated pick uncertainties, Wp is the perturbation weighting matrix,
and Wh and Wv are the horizontal and vertical roughness matrices,
respectively. The perturbation weighting matrix is a diagonal matrix
containing the reciprocal of the starting slowness values; it measures
the relative perturbation of the current model from the starting mod-
el. The roughness matrices are second-order spatial finite-difference
operators that measure the roughness of the model in the horizontal
and vertical directions. These operators are normalized also by the
starting slowness value at the center of the operator ͑Zelt and Barton,
1998͒.
The parameters , ␣, and sz control the weight of the terms in the
objective function. The parameter determines the overall amount
of regularization and is not strictly free, in that it is reduced systemat-
ically by the algorithm from a free-parameter starting value o. The
systematic reduction of with each iteration by a factor r stabilizes
the inversion by constraining the long-wavelength model structure
in the initial iterations and by allowing finer model structure in later
iterations.The parameter ␣ determines the relative weight of the sec-
ond derivative and perturbation regularization; perturbation regular-
ization is not part of the original Zelt and Barton ͑1998͒ algorithm,
equivalent to using an ␣ value of one. The value sz governs the rela-
tive weight of the vertical and horizontal smoothing regularization.
The final free parameter is the number of iterations of the conjugate
gradient algorithm Nlsq, used to solve the large sparse system of lin-
ear equations at each iteration ͑Zelt and Barton, 1998͒. The free-pa-
rameter values were varied to facilitate a systematic exploration of
the model space to determine the simplest and most geologically rea-
sonable model that fits the data.
The model parameterization for the forward calculation of travel-
times and raypaths is a uniform 1-m node spacing.The 3D finite-dif-
ference eikonal solver of Vidale ͑1990͒, with modifications for large
velocity gradients by Hole and Zelt ͑1995͒, is used. For the inverse
step, the model is divided into cells of constant slowness. The cell
size is chosen to balance the trade-off between increased resolution
using smaller cells and increased constraint on the slowness values
using larger cells. In practice, the largest cell size is used that allows
the data to be fit within their uncertainties according to equation 1.A
cell size of 2ϫ2ϫ1 m in the x-, y-, and z-directions, respectively, is
used. The model dimensions are 60 ϫ 110 ϫ 28 m, resulting in
46,200 cells.
Starting model
The study area consists of two sedimentary formations. The sur-
face layer, the Provo Formation, is comprised primarily of sand and
gravel, while the buried Alpine Formation is primarily clay. From
the well data, we know the clay top is at 2–15 m depth and is incised
by a paleochannel ͑Figure 2͒; the water table is at 9–10 m depth.
Two wells separated by 1.8 m show a difference in clay depth of
11.7 m. The true velocity field is therefore expected to be laterally
and vertically complex. The only prior information concerning 3D
structure is the depth to clay from the well data, but this is what we
want to determine using the seismic data.Therefore, we use 1D start-
ing models as a test of 3D refraction tomography in a complex near-
surface environment.
Three different starting models were tested ͑Figure 6͒. Because
the airwave obscures the refracted wave in the near-offset region, we
know the seismic velocity at the surface is less than the velocity of air
— nearly 330 m/s. Based on the results of the 2D pilot survey ͑Dana
et al. 1999͒, a surface velocity of about 200 m/s is used for each
model ͑Figure 6͒. The velocity increases rapidly with depth in each
model and approaches the seismic velocity of water to account for
the water table at 9–10 m. Each starting model increases with differ-
Figure 6. Three 1D starting models. ModelAis preferred. Model B is
slower than the model A from 0–9 m. Model C is faster than the
modelAfrom 0–13 m.
3D seismic refraction tomography H71
6. ent gradients in depth until about 12 m depth, where they converge
at roughly 1400 m/s and then slowly increase to slightly more than
1600 m/s at 25 m depth. Starting modelAis constructed by laterally
averaging the 3D final models from some preliminary inversions of
the data. Starting models B and C are designed to test the sensitivity
of the results using slower and faster models, respectively.
RESULTS
The preferred final model was determined after numerous inver-
sions using the three starting models and a range of free-parameter
values. In this way, model nonuniqueness was explored, in that dif-
ferent models were obtained that fit the data similarly according to
equation 1. The preferred final model was selected in accordance
with Occam’s principle of minimum structure ͑e.g., Constable et al.,
1987͒ to avoid overinterpreting the data. Starting modelA͑Figure 6͒
was used to produce the final preferred model. The starting rms trav-
eltime misfit is 9.25 ms ͑2
= 3.42͒, and the misfit provided by the
preferred final model after eight iterations is 5.39 ms ͑2
= 1.16͒
͑Figure 7͒. We could not achieve 2
= 1, probably because of the
number of reciprocal time differences greater than 5 ms ͑Figure 5b͒.
The preferred free-parameter values are o = 5000, r = 1.317, ␣
= 1.0, sz = 0.4, and Nlsq = 250.
Figure 8a shows horizontal slices of the difference between the
preferred final model and the starting model.Acoherent low-veloci-
ty anomaly that trends roughly north-south is evident in each slice.
The anomaly curves slightly eastward in the north, where it reaches
its largest value of around 250 m/s perturbation from the starting
model and widens to cover almost the full width of the model. It dis-
appears south of about y = 80 m. The anomaly increases in coher-
ence and magnitude until 12 m depth; it loses coherence below
this. It shows considerable lateral variation, notably in the x-
direction, where it can change by more than 300 m/s in roughly
15 m. The shape of the low-velocity anomaly is generally consistent
with the paleochannel from the well data.
Figure 9 shows east-west cross sections through the preferred fi-
nal model. There is considerable heterogeneity in the upper 4 m of
the model. Below 4 m, the model is generally smoother without any
sharp features, and the isovelocity contours take the form of a broad
depression, with the center roughly in agreement with the center of
the paleochannel from the well data; this is the prominent north-
south low-velocity anomaly seen in the horizontal slices.
Model assessment
To assess the robustness of the preferred final model, we have ap-
plied a number of tests and examined the ray coverage.
Ray coverage
Ray coverage is a rough indicator of how well the model is con-
strained at a particular point ͑Figures 8b and 10͒. Ray coverage is a
maximum between 8 and 12 m depth, with the deepest rays reaching
nearly 21 m. Ray coverage is concentrated toward the eastern side of
the model between x values of 0–15 m and y values of 20–90 m.
Rays are concentrated on the east because of the velocity structure,
i.e., avoiding the low-velocity paleochannel, and also because the
survey geometry shifts to the east at the southern end of the study
area ͑Figure 1͒.
Alternative starting models
Figure 11 shows a slice at z = 10 m from the preferred final model
in comparison with eight alternative final models. The normalized
misfits for the final models obtained from starting models B and C
were both 1.17, essentially the same fit as the preferred final model
͑2
= 1.16͒. Both alternative final models show a north-south-trend-
ing low-velocity anomaly similar to the preferred final model. Shal-
lower depth slices through the models obtained using starting mod-
els B and C show consistently faster and slower perturbations, re-
spectively, compared to the preferred final model at the same depth.
This indicates starting model B is biased slow and starting model C
is biased fast. However, the absolute velocities in these alternative
models are very similar to the preferred final model, illustrating the
robustness of the tomographic technique to biased starting models.
Free parameters
The alternative final models shown in Figure 11 are obtained by
varying the free-parameter values to o = 10,000, r = 1.414, ␣
= 0.95, sz = 0.3, and Nlsq = 325. For these runs, the preferred start-
ing modelAwas used and all free parameter values were the same as
for the preferred final model, except for the one being varied. The
five final models provide normalized misfits of 1.06–1.19. These
models contain the north-south-trending low-velocity anomaly, al-
though they are generally rougher than the preferred model. The ex-
ception to this is the model obtained using sz = 0.3, which is smooth-
er than the preferred final model in this horizontal slice but is rougher
in the vertical direction, as expected using a smaller value of sz than
that used for the preferred final model. Increasing sz from 0.3 to 0.4
added little horizontal roughness but significantly decreased vertical
roughness. Increasing sz from 0.4 to 0.5 did not substantially smooth
the model vertically but increased horizontal roughness, leading to
the preferred sz value of 0.4. All of the models obtained by varying
the free parameters are viable because they similarly fit the data ac-
cording to equation 1, but the preferred final model was the smooth-
est.
Figure 7. Traveltime residuals for the preferred starting model and
preferred final model as a function of source-receiver offset.The rms
traveltime misfit for the starting and final models is 9.25 ms ͑2
= 3.42͒ and 5.39 ms ͑2
= 1.16͒, respectively.
H72 Zelt et al.
7. Near-offset picks
Because refracted body waves were not distinguished confidently
from the airwave in the near-offset region and because the near-off-
set picks predominantly influence the shallow part of the model,
there is some question as to how the near-offset picks might affect
the deeper structure of the model.An inversion was run in which ve-
locities above 3 m were laterally homogeneous
and fixed at the preferred starting model values;
these values are based on the results of a 2D pilot
survey in which refracted arrivals were identified
in the near-offset region behind the airwave. The
north-south-trending low-velocity anomaly is
present in the final model ͑Figure 11i͒, although
the magnitude of the variations are about 100 m/s
greater than the preferred model at this depth and
the model is rougher than the preferred final mod-
el at all depths below 3 m. The normalized misfit
of 1.21 for this model is the poorest of any of the
alternative final models, although this is, in part,
from the inability to fit the near-offset picks close-
ly because the shallow portion of the model is
fixed.
Lateral resolution
We have estimated the lateral resolution of the
preferred final model using Zelt’s method ͑1998͒,
which has been used in a number of 3D refraction
studies ͑e.g., Day et al., 2001; Zelt et al., 2001;
Morgan et al., 2002͒. The method consists of a se-
ries of checkerboard tests using the source-re-
ceiver geometry of the picked data. The preferred
starting model and preferred free-parameter val-
ues are used, and Gaussian noise is added to the
synthetic data using a standard deviation equal to
the assigned picking uncertainty, 5 ms. Five
anomaly sizes were tested: 5, 7.5, 10, 15, and
20 m ͑Figure 12͒. Velocity anomalies of 35% en-
sured the initial misfits were similar to the initial
misfit of the real data for the preferred starting
model. The semblance between the recovered
anomaly pattern and the true anomaly pattern was
calculated at each model node. A semblance val-
ue of 0.7 is the threshold for good resolution at the
length scale of the anomaly size ͑Zelt, 1998͒.
At z = 10 m, much of the central part of the
model has a lateral resolution of at least 7.5 m,
and most of the model at this depth has a resolu-
tion of at least 10 m ͑Figure 12͒. Zelt’s method
͑1998͒ determines the lateral resolution of the
model by estimating the anomaly size that would
yield a semblance of 0.7 at each model node ͑Fig-
ure 8c͒. Resolution exceeds 7.5 m throughout
most of the model down to 10 m depth. Resolu-
tion at the 10-m length scale includes most of the
model to 12 m depth and the central part of the
model down to 14 m.
DISCUSSION
The geology at OU2 consists of heterogeneous unconsolidated
sediments above a predominantly clay formation with an incised pa-
leochannel. Large changes in velocity occur over short distances
both laterally and vertically, based on extensive well data and a 2D
pilot study ͑Dana et al., 1999͒. The final velocity model increases
rapidly with depth, from approximately 200 m/s at the surface to
1500 m/s at 12–15 m depth ͑Figure 9͒.The model is more heteroge-
Figure 8. ͑a͒ Preferred final model displayed as perturbations with respect to the preferred
starting model for depths from 6–14 m as labeled. Depth to clay contours ͑in green͒ from
the well data for 7–11 m overlay the 8- and 10-m slices. Black contour interval is
100 m/s. Unsampled regions at the edges are white. ͑b͒ The number of rays that pass
through each model cell corresponding to the depth slices in ͑a͒. Black contour interval is
200 rays. Unsampled regions are white. ͑c͒ Lateral velocity resolution corresponding to
the depth slices in ͑a͒. The 7.5-m contour is white; the 10-m contour is black. Black re-
gions have better than 5 m resolution; white regions have worse than 20 m resolution or
are unsampled.
3D seismic refraction tomography H73
8. neous in the upper 4 m, likely a reflection of the complexity of the
unconsolidated near-surface sediments and consistent with higher-
resolution waveform inversion results ͑Gao et al., 2006; Gao et al.,
2004͒. The model becomes significantly smoother below 4 m, with
the isovelocity contours taking a generally concave-up shape and
with the deepest point being 2–3 m lower than at the edges of the
model. The deepest points generally coincide with the incised pale-
ochannel as defined by the well data, although the channel in the re-
fraction model, is smoother than the well data indicate ͑Figure 9͒.
The vertical cross sections suggest the velocity, in a very smooth
way, is consistent with the known geology and site conditions. The
low velocities of the sand-gravel Provo Formation overlie the high-
er-velocity clay Alpine Formation, which has a nearly 10-m-deep
north-south-trending trough in its top, forming the paleochannel,
and a water table at 9–10 m depth.
The water table may reduce the velocity anomaly that would oth-
erwise be associated with the paleochannel below 9–10 m and could
therefore, at least in part, explain the very smooth nature of the deep
portion of our model. It is typical for the saturated zone to be shal-
lower in clay than in sand because of capillary forces, and the transi-
tion in clay occurs over a broader interval. Therefore, we would ex-
pect the water table to follow the shape of the channel, although it
will be smoothed laterally and to a lesser extent vertically. Also,
since saturated clay is typically a bit slower than saturated sand, the
base of the channel may correspond to a velocity decrease. In any
event, the deep velocity structure is likely the result of a combination
of lithology and water saturation, which is greatly smoothed out in
the model from the resolution of the data.
The horizontal slices of the velocity perturbations are dominated
by a north-south-trending low-velocity anomaly that curves slightly
to the northeast in the north ͑Figure 8a͒. The anomaly increases in
area and velocity fluctuation with depth, peaking between 10 and
12 m depth and then diminishing and losing continuity below this.
The anomaly at 10–12-m depth ranges from the edge of the model in
the north to about y = 80 m in the south and roughly narrows in
width from about 30 m to 10 m over this distance.As discussed, the
anomaly is well resolved, with a lateral resolution at 10–12 m depth
better than 10 m throughout most of the model and better than 7.5 m
through much of it ͑Figure 8c͒. The outline of the low-velocity
Figure 9. East-west cross sections through the preferred final model
at y-positions as labeled. The clay layer from the well data overlays
the model in white. Arrow indicates known water table at 9–10 m.
Contour interval is 100 m/s; thick contour is 1000 m/s. Unsampled
regions are white.
Figure 10. Raypaths through the preferred final model projected into
the x-y and y-z planes. For clarity, every 200th raypath is shown.
H74 Zelt et al.
9. anomaly is consistent with the general shape of the paleochannel
from the well data ͑Figure 8a͒, suggesting the paleochannel incised
into the clay layer influences the long-wavelength velocity structure.
At a given depth, the velocities are generally higher at the south end
of the model than at the north ͑Figure 8a͒, perhaps because the sur-
face elevation is roughly 1 m higher in the south, resulting in greater
consolidation and higher velocities.
Fresnel zones
The size of the first Fresnel zone and the picking uncertainty pro-
vide insight into the smoothness of the final model because they are
related to the spatial resolution. For first-arrival traveltime tomogra-
phy, the Fresnel zone is the volume within which any scattered wave
will arrive within one-quarter period of the dominant frequency of
the first arrival — roughly 3.3 ms for these data.As a result, any het-
erogeneity within the Fresnel zone is averaged, although overlap-
ping Fresnel zones from different source-receiver pairs makes it pos-
sible for traveltimes to resolve details that are nearly 60% of the
Fresnel zone’s dimensions ͑Pratt et al., 2002͒. Ray-theoretical
Fresnel zones are calculated by summing the first-arrival-time fields
from the source and receiver points and by contouring the traveltime
corresponding to the first-arrival time between the two points, plus
one-quarter of the dominant period. The volume within the contour
corresponds to the first Fresnel zone because it represents all subsur-
face points from which scattered energy between the source and re-
ceiver will arrive within one-quarter period of the first arrival.
Consider four representative Fresnel zones for refracted raypaths
through the final model with offsets of 15, 30, 60, and 90 m that bot-
tom above, within, and beneath the paleochannel ͑Figure 13͒. The
greater heterogeneity in the upper 4 m of the model ͑Figure 9͒ could
be a good representation of the true structure, given the more local-
ized shape of the Fresnel zones in the upper 4 m, although contami-
nation of the short-offset first arrivals by the airwave for this experi-
ment must be factored in. The results of the checkerboard tests indi-
cate lateral resolution exceeds 5 m in the upper 5 m throughout most
of the model.
Figure 11. The preferred final model and eight alternative final mod-
elsat10 m depth,displayedasperturbationswithrespecttothestart-
ing model. The reference velocity at this depth in the preferred start-
ing model is 1150 m/s.The preferred final model is in the center; the
other models are obtained using ͑a͒ starting model B, ͑b͒ starting
model C, ͑c, e͒ o = 10 000, ͑d͒ r = 1.4142, ͑f͒ ␣ = 0.95, ͑g͒ sz
= 0.3, ͑h͒ Nlsq = 325, and ͑i͒ model above 3 m fixed at starting-mod-
el values ͑see text for details͒. The preferred starting model ͑e͒ is
produced using starting modelAin Figure 6 and free-parameter val-
ues o = 5000, r = 1.3173, ␣ = 1.00, sz = 0.4, and Nlsq = 250.
Black contour interval is 100 m/s. Depth-to-clay contours ͑green͒
from the well data for 7–11 m overlay the models. White edges are
unsampled regions.
Figure 12. Recovered checkerboard anomaly patterns ͑top row͒ and
corresponding semblance values ͑bottom row͒ at z = 10 m for the
five anomaly sizes: 5, 7.5, 10, 15, and 20 m. The boundaries of the
true checkerboard pattern overlay the recovered perturbations. In the
semblance plots, the contour interval is 0.1; the 0.7 contour is white.
3D seismic refraction tomography H75
10. The Fresnel zones are thickest and broadest approximately half-
way between the source and receiver, where they are as much as
15–20 m vertically and 15–30 m horizontally for raypaths that sam-
ple the paleochannel.Although large, the overlapping Fresnel zones
at the target depth of about 10 m, arising from many different
source-receiver pairs, make it possible to resolve lateral variations in
the paleochannel on a length scale consistent with the resolution de-
rived from the checkerboard tests ͑Figure 8c͒. However, for vertical
resolution at the target depth ͑approximately 10 m͒, every Fresnel
zone with an offset of 25–40 m that bottoms near the target depth
will average the structure over the entire depth range of interest.As a
result, the traveltime data will only sense a very smooth vertical gra-
dient. It is not possible to determine from the traveltime data whether
the final model accurately describes a smooth velocity increase at the
clay contact or the water table or whether a sharp velocity contrast
exists but is smoothed out because of the size of the Fresnel zones.
Thus, it is prudent to refrain from viewing the velocity values in the
final model as localized point measurements. Regardless of the in-
ability to determine the precise nature of the velocity increase result-
ing from a change in lithology or the water table, the lateral geometry
of the paleochannel is resolved within the final model at a length
scale of 7.5–10 m. We estimate that a dominant frequency of ap-
proximately 200 Hz and a picking error of about 2 ms would be re-
quired to infer anything about the nature of the clay contact or the
water table.
Comparison with reflection data and
waveform inversion
Figure 14 compares a slice at z = 10 m from the preferred final
model with results from waveform inversion of the 2D reflection
data along each east-west line and a migrated stack of the 3D reflec-
tion data. The waveform result is presented in the form of depth to
the 800-m/s velocity contour, interpreted by ͑Gao et al., 2004͒ to be
the clay top. The 3D reflection data are presented as a depth slice at
10 m from a poststack 3D depth-migrated volume ͑Fradelizio et al.,
2004͒. Although the waveform isovelocity surface shows artifacts
related to contouring the results from independent 2D inversions of
the 45 east-west lines, the paleochannel is clearly defined from
7–11 m depth, in good agreement with the well data. The 3D reflec-
tion data show generally enhanced reflectivity within the channel as
defined by the well data, although this reflectivity fades out between
about y = 30 and y = 40 m. In the north, all three images show the
channel curving to the east. This is where the strongest anomaly is in
the traveltime model, the deepest point is in the waveform surface,
and the largest patch of enhanced reflectivity is in the reflection im-
age. South of about y = 80 m, the results are inconsistent. The low-
velocity anomaly disappears in the preferred traveltime model; the
channel defined by waveform inversion is generally consistent with
the well data, and the high reflectivity is shifted east of the channel as
defined by the well data. South of y = 80 m is an area where the al-
ternative models show considerable variation ͑see models 4 and 8,
Figure 11, d, i͒. This is not surprising, given the relatively poor reso-
lution at the south end of the model ͑Figure 8c͒.
The generally favorable comparison of the 3D velocity model
with the waveform and reflection results lends credibility to the in-
terpretation of the north-south low-velocity anomaly being an ex-
pression of the topography on the clay surface and the low-velocity
sediments within the paleochannel. The waveform and reflection re-
sults have higher resolution than the traveltime result, as expected,
but all three methods image the channel structure in close agreement
with the well data. We estimate that the amount of experiment, com-
puter, and human time necessary to produce the refraction model is a
factor of 5–10 less than the time to produce the other two results.
Figure 13. Comparison of first Fresnel zones in the final model for a
center frequency of 75 Hz and source-receiver offsets of 15, 30, 60,
and 90 m. ͑top͒ Vertical cross section through the Fresnel zones at x
= 0 m. ͑bottom͒ Horizontal cross sections at 4, 10, and 16 m depth.
The 10-m depth-to-clay contour from the well data overlays the 10
-m cross section in gray.
Figure 14. ͑a͒ Horizontal slice of the preferred velocity model per-
turbations at 10 m depth. ͑b͒ Depth to the 800-m/s isovelocity sur-
face from 2D full waveform inversion of the 45 east-west 2D reflec-
tions lines ͑Gao et al., 2004͒. ͑c͒ Horizontal slice of the poststack 3D
depth-migrated reflectivity from the reflection data at 10 m depth
͑Fradelizio et al., 2004͒. The 7- and 10-m depth-to-clay contours
from the well data are labeled.White edges are unsampled regions.
H76 Zelt et al.
11. CONCLUSIONS
The 3D seismic refraction experiment at HAFB and the applica-
tion of 3D first-arrival-time tomography were a feasibility study for
shallow seismic investigations at environmental remediation sites.
Imaging the velocity structure of the near-surface environment pro-
vides encouraging results, despite less-than-ideal seismic data re-
sulting from airwave contamination, onsite noise from ongoing re-
mediation activities, and a relatively low dominant frequency for
such a shallow target.
Regularized first-arrival-time tomography obtained a minimum-
structure velocity model that outlines the shape of the low-velocity
fill in the paleochannel at the top of the clay formation. The north-
south low-velocity structure appears to mimic the paleochannel as
determined from over 100 wells, generally consistent with the re-
sults of waveform inversion and 3D poststack depth migration of the
reflection data. The low-velocity anomaly may represent the shape
of the paleochannel accurately at length scales of about 10 m, ac-
cording to checkerboard tests and considering the Fresnel zones.
The results suggest that first-arrival traveltime tomography can
constrain the long-wavelength features of a rapidly changing, near-
surface heterogeneous environment. A higher center frequency in
the data would have meant smaller Fresnel zones and, along with a
better S/N ratio, a smaller picking error, which in turn would have
justified a closer fit to the data, increasing model resolution. In any
shallow seismic study, the center frequency is dictated by site condi-
tions and the need to propagate energy to and from the target. In com-
parison to the 3D seismic reflection method, the seismic refraction
method was relatively simple, quick, and inexpensive. In addition,
the analysis and interpretation of refraction data is potentially less
subjective than conventional reflection processing.There is minimal
data processing and objective arrival picking, assuming low noise,
and solving for a minimum-structure model minimizes the subjec-
tivity of the interpretation. Compared to waveform inversion, travel-
time inversion is robust, even in the presence of considerable noise
or spatial aliasing. Finally, the velocity model obtained by first-ar-
rival-time tomography can be used as a starting model for waveform
inversion and as an independent check on the images obtained from
processing reflection data.
ACKNOWLEDGMENTS
Hans Meinardus of Duke Power acted as our liaison with HAFB,
and Jon Ginn at HAFB made possible our access to OU2. We thank
the volunteer field crew members from nine countries for their great
teamwork. D. Dana and I. Morozov helped to prepare the data for
analysis. G. Fradelizio and F. Gao provided figures from their work.
Comments by the associate editor ͑J. Bradford͒ and five anonymous
reviewers were very helpful. GMT ͑Wessel and Smith, 1998͒ was
used to produce some of the figures. IRIS/PASSCAL provided the
seismic recording instruments and field support. This research was
funded by DOE grant DE-FG07-97ER14827.
REFERENCES
Bevington, P. R., 1969, Data reduction and error analysis for the physical sci-
ences: McGraw-Hill Book Company.
Constable, S. C., R. L. Parker, and C. G. Constable, 1987, Occam’s inversion,
Apractical algorithm for generating smooth models from electromagnetic
sounding data: Geophysics, 52, 289–300.
Curry, D. R., 1980, Coastal geomorphology of Great Salt Lake and vicinity,
in J. W. Gwynn, ed., Great Salt Lake:Ascientific, historical, and economic
overview: Utah Geological and Mineral Survey, 75.
Dana, D., A. Azaria, A. Levander, I. Morozov, C. Zelt, and B. Magnani,
2001, High-resolution 3-D seismic investigations at a groundwater con-
tamination site: Initial results: 71st Annual International Meeting, SEG,
ExpandedAbstracts, 1337–1340.
Dana, D., C. Zelt, and A. Levander, 1999, High-resolution seismic survey
over a near-surface contamination site: 69th Annual International Meet-
ing, SEG, ExpandedAbstracts, 579–581.
Day, A. J., C. Peirce, and M. C. Sinha, 2001, Three-dimensional crustal
structure and magma chamber geometry at the intermediate-spreading,
back-arc Valu Fa ridge, Lau basin — Results of a wide-angle seismic to-
mographic inversion: Geophysical Journal International, 146, 31–52.
Deen, T., and K. Gohl, 2002, 3-D tomographic seismic inversion of a pale-
ochannel system in central New South Wales, Australia: Geophysics, 67,
1364–1371.
Dunne, T., and L. B. Leopold, 1978, Water in environmental planning: W. H.
Freeman & Company.
Environmental Protection Agency ͑EPA͒, 2002, Region 8 — Hill Air Force
Base, accessed 26 June 2006 ͗http://www.epa.gov/unix0008/superfund/
sites/ut/hillafb. html͘.
Feth, J. H., 1955, Sedimentary features in the Lake Bonneville group in the
east shore area, near Ogden, Utah: Guidebook to the geology of Utah —
Tertiary and Quaternary geology of the eastern Bonneville basin, vol. 10:
Utah Geological Society, 45–69.
Fradelizio, G. L., A. Levander, C. A. Zelt, and F. Gao, 2004, Depth migration
comparison to waveform tomography from a high resolution 3D seismic
dataset: EOS, Transactions of the Americal Geophysical Union, 85, no.
47, S33A–1083.
Gao, F., G. L. Fradelizio, A. Levander, G. Pratt, C. Zelt, and W. Symes, 2004,
Waveform tomography at a ground water contamination site: comparison
with depth migration: EOS, Transactions of the American Geophysical
Union 85, S33A-1081.
Gao, F., A. Levander, R. G. Pratt, C. A. Zelt, and G. -L. Fradelizio, 2006,
Waveform tomography at a ground water contamination site:VSP-surface
dataset: Geophysics, 71, H1-H11.
Hirasaki, G. J., C. A. Miller, R. Szafranski, D. Tanzil, J. B. Lawson, H. W.
Meinardus, M. Jin, J. T. Londergan, R. E. Jackson, G. A. Pope, et al., 1997,
Field demonstration of the surfactant/foam process for aquifer remedia-
tion: Annual Technical Conference and Exhibition, Society of Petroleum
Engineers, paper SPE 39292.
Hole, J. A., and B. C. Zelt, 1995, Three-dimensional finite-difference reflec-
tion times: Geophysical Journal International, 121, 427–434.
Lanz, E., H. Maurer, and A. G. Green, 1998, Refraction tomography over a
buried waste disposal site: Geophysics, 63, 1414–1433.
Meinardus, H. W., V. Dwarakanath, J. Ewing, G. J. Hirasaki, R. E. Jackson,
M. Jin, J. S. Ginn, J. T. Londergan, C. A. Miller, and G. A. Pope, 2002, Per-
formance assessment of NAPL remediation in heterogeneous alluvium:
Journal of Contaminant Hydrology, 54, 173–193.
Menke, W., 1989, Geophysical data analysis: Discrete inverse theory ͑rev.
ed.͒:Academic Press, Inc.
Moore, J. E., and J. R. Jones, 1987, Federal laws help protect groundwater:
Geotimes, 32, 9–11.
Moore, J. E., A. Zaporozec, and J. W. Mercer, 1995, Groundwater, a primer:
American Geological Institute.
Morey, D., and G. T. Schuster, 1999, Paleoseismicity of the Oquirrh fault,
Utah from shallow seismic tomography: Geophysical Journal Internation-
al, 138, 25–35.
Morgan, J. V., G. L. Christeson, and C. A. Zelt, 2002, Testing the resolution
of a 3D velocity tomogram across the Chicxulub crater: Tectonophysics,
355, 215–226.
Oolman,T.,S.T.Godard,G.A.Pope,M.Jin,andK.Kirchner,1995,DNAPL
flow behavior in a contaminated aquifer: Evaluation of field data: Ground-
water Monitoring and Remediation, 15, 125–137.
Pratt, R. G., F. Gao, C. Zelt, and A. Levander, 2002, The limits and comple-
mentary nature of traveltime and waveform tomography: International
Conference on Sub-basalt Imaging, Journal of Conference Abstracts, 7,
181.
Ramachandran, K., S. E. Dosso, C. A. Zelt, G. D. Spence, R. D. Hyndman,
and T. M. Brocher, 2004, Upper crustal structure of southwestern British
Columbia from the 1998 Seismic Hazards investigation in Puget Sound:
Journal of Geophysical Research, 109, B09303.
Schlindwein, V., C. Bonnemann, C. Reichert, I. Grevemeyer, and E. Flueh,
2003, Three-dimensional seismic refraction tomography of the crustal
structure at the ION site on the Ninetyeast Ridge, Indian Ocean: Geophysi-
cal Journal International, 152, 171–184.
Vidale, J. E., 1990, Finite-difference calculation of traveltimes in three di-
mensions: Geophysics, 55, 521–526.
Wessel, P., and W. H. F. Smith, 1998, New, improved version of the generic
mapping tools released: EOS, Transactions of the American Geophysical
Union, 79, 579.
Young, R. A., and J. Sun, 1996, 3-D ground penetrating radar imaging of a
3D seismic refraction tomography H77
12. shallow aquifer at HillAir Force Base, Utah: Jounal of Environmental and
Engineering Geophysics, 1, 97–108.
——–, 1998, Extracting a radar reflection from a cluttered environment using
3-D interpretation: Jounal of Environmental and Engineering Geophysics,
3, 121–131.
Zelt, B. C., R. M. Ellis, C. A. Zelt, R. D. Hyndman, C. Lowe, G. D. Spence,
and M. A. Fisher, 2001, Three-dimensional crustal velocity structure be-
neath the Strait of Georgia, British Columbia: Geophysical Journal Inter-
national, 144, 695–712.
Zelt, C. A., 1998, Lateral velocity resolution from three-dimensional seismic
refraction data: Geophysical Journal International, 135, 1101–1112.
Zelt, C. A., and P. J. Barton, 1998, Three dimensional seismic refraction to-
mography, A comparison of two methods applied to data from the Faeroe
basin: Journal of Geophysical Research, 103, 7187–7210.
H78 Zelt et al.