SlideShare ist ein Scribd-Unternehmen logo
1 von 24
Downloaden Sie, um offline zu lesen
KENYA AGRICULTURAL MARKETING
                    AND POLICY ANALYSIS PROJECT

      TEGEMEO INSTITUTE OF AGRICULTURAL POLICY AND
           DEVELOPMENT/ EGERTON UNIVERSITY

            KENYA AGRICULTURAL RESEARCH INSTITUTE

                       MICHIGAN STATE UNIVERSITY


    TRENDS IN REGIONAL AGRICULTURAL PRODUCTIVITY IN
                         KENYA


                                            by


                              James K. Nyoro and T.S. Jayne


Support for this study was provided under the Kenya Agricultural Marketing and Policy
Analysis Project (KAMPAP), supported by the United States Agency for International
Development/Kenya.

James Nyoro is Research Scholar, Tegemeo Institute, Egerton University. T.S. Jayne is
Visiting Associate Professor at Michigan State University.
1. INTRODUCTION


Agriculture in Kenya remains a dominant sector in the economy (PAM 1995). Agricultures
contribution to rural employment, foreign exchange earning and rural incomes are so
important that any broad-based improvement in rural living standards will almost certainly
require substantial productivity growth in agriculture.

Agriculture in Kenya has undergone major changes over the past decade since the
implementation of structural adjustment and sectoral reform. The effects of these policies
and programs on agricultural productivity continue to be debated. Much donor-supported
analysis presents evidence of a broad economic turnaround in Africa, and finds support for
increased agricultural productivity growth, in contrast to the gloomier picture commonly
painted about stagnating African agriculture (e.g., Block 1994; Sahn and Sarris 1991;
USAID 1993; World Bank 1994). Macro-economic and agricultural sectoral reforms are
identified as major factors explaining the rise in productivity growth. By contrast, analyses
supported by UNICEF, FAO, and other donor agencies have strongly questioned the effects
of structural adjustment and/or food sector reform on agricultural productivity growth and
household food security (see, for example, Cornia, Jolly, and Stewart 1987; Mosley 1994;
Cheru 1999). Understanding the national and regionally-disaggregated movements in crop
production and input use over time is a critical component step in clarifying the discussion,
identifying which policies have worked and which havent, and formulating a empirically-
based agricultural development strategy for the future.

The objectives of this paper are threefold: (1) to assess the direction and magnitude of
changes in agricultural productivity in Kenya in the last 25 years for five of the most
important agricultural provinces in Kenya, with particular focus on the period since the
initiation of agricultural policy adjustment in the 1990s; (2) to identify the major factors
affecting changes in crop productivity; and (3) to identify cost-effective strategies likely to
promote future agricultural intensification and productivity growth in Kenyas crop sector in
the post-reform period. A regionally disaggregated approach is taken in order to identify
variations in the patterns of growth across high-potential and low-potential areas and develop
possible implications for policy about where the focus of future efforts should be. Section 2
discusses the data and methods used in the analysis. Section 3 assesses the broad trends in
the value of agricultural output per hectare and per agricultural laborer. Section 4
disaggregates these trends by province to compare the trends not only by the geographical
location of the regions but also by crop mix. We also examine how policy changes in the
agricultural sector may have affected patterns in input use on various crops. Lastly, Section
5 discusses the conclusions, policy implications, and outstanding knowledge gaps for future
research to support policy makers efforts to raise agricultural productivity in Kenya.


                      2. METHODOLOGY AND DATA SOURCES

2.1. Methodology

A conventional agricultural productivity index is a measure of output divided by a measure
of inputs. Total factor productivity (TFP) is defined as the ratio of value of output over the
value of all inputs used. However, TFP measures are difficult to construct in the absence of


                                               2
data on prices and costs of key inputs. An alternative approach is partial factor productivity
(PFP). The main indicators in this analysis are partial land and labor productivity. The PFP
indicators are calculated as Q/ X i , where Q is the value of output and X i is physical factor
input.

The main weakness of partial factor productivity indices is that they do not account for all
the inputs used in production/marketing system. Discussions about single factor productivity
can be misleading if interpreted as total factor productivity. On the input side, improvements
in labor and land productivity are usually due to changes in other inputs. New technology,
infrastructure, extension, supplies of other inputs (water, for example) are not costless and
need to be taken into account in assessing total factor productivity.1 On the output side, the
mix of farm and non-farm activities undertaken by the rural population may have shifted
over time. For example, if a larger percentage of rural households time has gone into non-
farm activities over time, the analysis presented in the figures will understate increases (or
overstate decreases) in agricultural labor productivity.2 Nonetheless, the measures of labor
and land productivity can indicate important changes in agricultural systems performance,
especially if kept in context of the changes in the use of other factors.

Only five out of the eight provinces were analyzed in the analysis, leaving out Nairobi, North
Eastern and Coast provinces due to data limitations. The provinces included in the analysis
thus are Central, Eastern, Rift Valley, Western and Nyanza. In each province, the key
commodities were modeled (including maize, wheat, sorghum, sugarcane, coffee, tea,
pyrethrum, tomatoes and French beans). Lack of reliable data required other crops to be
excluded from the analysis, and for this reason, there is variation across provinces in the
extent to which all relevant crops are included.


2.2. Data Sources

The main data source for this study was the Ministry of Agriculture Livestock Development
and Marketing (MOALDM), the Planning Division and the Central Bureau of Statistic of
the Ministry of Planning and National Development and several publications. Initial data was
collected from the provincial and district agricultural offices by Tegemeo Institute and its
predecessor the Policy Analysis Matrix Project on all agricultural commodities in each
district. Districts level Farm Management Reports, Development Plans and district annual
reports also were referred to. Data on specific crops like coffee, tea, pyrethrum sugar and
rice was collected directly from their respective regulatory and marketing bodies including
the Coffee Board of Kenya, Tea Board of Kenya, Pyrethrum Board, Kenya Sugar Authority
and the National Irrigation Board. The district data was compiled to the provincial level and
was compared to the provincial data already compiled at the MOALDM headquarters.


1
  Unfortunately, data is seldom available to measure total factor productivity in Africa (see Thirtle et al. 1993 for
an exception), and there is also considerable disagreement about how TFP should be measured.
2
  A more accurate indicator of labor productivity would have been value of crop output per unit of agricultural
laborer, but time series data on agricultural labor force was unavailable. Use of rural population data will
give similar trend results to those using agricultural labor data as long as the proportion of rural population
engaged in agriculture was relatively constant over the sample period. Productivity trends will be biased
upward (downward) if the share of the rural population in agriculture increased (decreased) over the sample
period.

                                                         3
The production data for the entire period (1970-95) was converted to the value of production
by multiplying the production by average of the last 5 years national and regional producer
prices (1991-1995). These average prices were used to overcome the problem of introducing
price based fluctuations into the data that have little to do with changes in physical input-
output relationships. Three year centered moving averages were constructed from both the
labor and land productivity indicators to smooth out the effects of random variation such as
that caused by abrupt weather changes. The result were then averaged in five year segments
from 1970-74 to 1990-95. This approach roughly follows the methods in Block (1994).

The land and labor units are physical units based on the MOALD M data. Land is the area
cultivated and thus includes sections planted though not yet in production. The labor variable
is the population in rural areas as reported in the 1969, 1979 and 1989 national population
census.

The quality of official data from the MOALDM is widely criticized as inaccurate and
unreliable. There is however no alternative national and regional time series production and
area data available for the period and commodities covered. For the purpose of this analysis,
therefore, the MOALDM data was used, realizing that the results are to be considered
rough indicators of trends. What is important in this analysis is the direction of change in the
partial productivity measures over time rather than the levels of the variables themselves.
The challenge in Kenya today is how to invest in good quality data collection to ensure that
the future analysis of the agricultural sector is based on more reliable and accurate data.


                                        3. RESULTS

3.1. Productivity and Area Trends

Relative growth rates in area for some of the key agricultural commodities for the period
1970 to 1995 are shown in Table 1. Most crops have expanded in area in the last 25 years.
But the rate of area expansion for most of the crops was higher between 1970 and 1985 than
it was between 1985 and 1995. Coffee and sugar area expanded most between 1980 and
1985 because of better producer prices and in response to the coffee boom of 1977-79.
Wheat area declined in the 1970-80 period following the change the sub-division of large-
scale farms to small-scale farmers who substituted from wheat into maize and dairy (Hassan,
Mwangi, and Karanja 1993). The substantial growth in wheat area in the period 1980-85
reflects substantial expansion of wheat into the low potential areas of Narok, Trans Mara and
Samburu. Pyrethrum area fell drastically in the period 1980-90 period following the long
delays in payments to farmers in 1981 and subsequent substitution to other crops. Growth
rates in cropped area since 1990 reflect a shift out of maize and coffee area and an expansion
in horticultural area such as the tomatoes and French beans.

Area expansion of most crops was driven by explicit government support in the 1970s and
1980s to encourage small-scale producers to adopt and expand the production of selected
export and food crops. The government thus expanded crop buying and processing capacity
to service new areas in production, provided credit and extension support to producers, and
maintained a relatively extensive network of collection points and depots for encouraging
smallholder marketing of cereals.


                                               4
Area expansion has slowed considerably since 1990. No crop has registered a higher rate of
growth in the 1990s than in the 1980s except french beans (and marginally pyrethrum). The
limited expansion that has occurred since 1990 has been generally toward the low potential
arid and semi arid areas because of population pressure in the high potential and the resulting
shortage of additional fertile land. This implies that future production growth in Kenya will
rely on increasing crop intensification, i.e., raising the value of agricultural production
through more intensive use of productivity enhancing inputs and/or shifting to higher-valued
crops.


Table 1.   Relative Rates of Area Expansion Average (% Growth per Year)
                  1970-80     1980-85     1985-90     1990-95
 Coffee                4.3          8.2         4.1        0.6
 Tea                   6.5          3.4         1.5        1.2
 Sugar                 3.7         10.9         2.3        1.6
 Pyrethrum             2.0          0.4        -1.1        0.4
 Maize                 2.3          0.2         2.1        0.4
 Wheat                -3.1          0.9         5.0        1.7
 Sorghum               0.5          5.8         3.2        3.0
 Tomatoes              1.4          1.7         3.3        2.5
 French Beans          0.7          3.3         3.1        4.2


3.2. Trends in Rates of Yields

The relative growth rates in the physical yields of the major crops over various periods are
summarized in Table 2. The most alarming trend is that yields are actually declining for
most of the crops considered during the 1990-95 period. This is especially true of the grain
crops and sugarcane. The negative growth in yields does not appear to be driven by weather
conditions, since the 1990-95 period has not been subjected to more frequent drought than
other periods. The decline in yields for the major cereal crops has been associated with a
stagnation in fertilizer use (both DAP and CAN), a major contraction in agricultural credit
disbursed to smallholder farmers, and a decline in both the quantity and quality of hybrid
maize seed used in production. The reasons behind these trends in input use are interrelated.
First, AFC credit for grain crops has been substantially reduced in real terms, and this
contraction has not been offset by any notable increase in private lending to smallholders. It
appears to be the case that procurement of inputs for use on grain crops (such as fertilizer and
hybrid seed) is increasingly self-financed by smallholders, and that liquidity constraints may
constrain demand for key productivity-enhancing inputs. Simultaneously, fertilizer prices
have risen in recent years, and DAP prices in Kenyas western regions are among the highest
in the world (1,400 to 1,500 Ksh per bag in 1997, which translates to roughly $450-$500 per
ton). Problems with quality control in improved seed generation and marketing have
discouraged farmers in some areas from purchasing hybrid maize seed, and higher fertilizer
prices impede the profitability of its use, which in turn reduces the profitability of using even
high-quality fertilizer-responsive seed.

In addition to the cereals, coffee and sugar have also recorded negative growth rates in yields
since 1990. Ironically, these are the same crops that recorded high growth in yields during
the 1970-80 period. French beans and tomatoes have however maintained their growth in
yields.

                                               5
Table 2. Relative Rates of Physical Yields Growth (% Growth per Year)
                 1970-80      1980-85       1985-90    1990-95
Coffee
Tea                 1.7           2.1           7.8        2.0
Sugar               0.6           1.2          (1.4)      (3.6)
Pyrethrum            1.6           0.9         (0.3)       1.4
Maize                5.7           3.5          3.0       (2.2)
Wheat                0.4           4.2          1.0       (3.3)
Sorghum             2.8           2.4           4.8       (1.1)
Tomatoes             2.5           3.1          5.3        6.9
French Beans         4.2           2.7          4.3        3.7


The rapid growth in maize yields during the 1970-80 period was as a result of the
introduction and subsequent adoption of the high yielding hybrid maize varieties and the
general government policy then to support extension service. The decline in coffee yields
was caused by drought, poor producer incentives due to delays in coffee payments and high
processing costs. The decline accelerated after 1990 despite the various policy reform in the
production, processing and marketing of coffee.


3.3. Trends in Crop Production

Rates of growth of crop production for some of the major selected crops is shown in Table 3.
 Production, just like area and yield, grew at a faster rate during the 1970-80 period than
during the 1980-90 period. The growth rate in production has actually been negative in the
period 1990-95 except for tea, pyrethrum, tomatoes, French Beans and sorghum. Coffee,
maize, wheat and sugar have had the largest decline. The decline in wheat production, as
stated earlier, is partly attributed to the change in the crop production structure from large-
scale to small-scale production systems. Lack of huge declines in the value of production
during the 1980-85 period indicates that despite the decline in yields as a result of the
drought during this period, prices to producers continued to be favorable.


                                               6
Table 3. Relative Rates of Growth in Crop Production (% Growth per Annum)
                  1970-80      1980-85        1985-90     1990-95
Coffee                   6.3         4.8             3.1    -4.4
Tea                      8.2         5.5             9.3     3.2
Sugar                    4.3        12.1             0.9    -2
Pyrethrum                3.6         1.3            -1.4     1.8
Maize                    8           3.7             5.1    -1.8
Wheat                   -2.7         5.1             6      -1.6
Sorghum                  3.3         8.2             8       1.9
Tomatoes                 3.9         4.8             8.6     9.4
French Beans             4.9         6               7.4     7.9


The decline in the value of coffee, maize, and wheat output in 1990-95 could be attributed to
the poor producer incentives due prevailing low prices despite the market reforms
implemented on these commodities. Maize and wheat experienced profit squeeze when the
fertilizer prices were liberalized in 1991 but maize and wheat marketing continued to be
government controlled. Maize and wheat production costs grew when revenues were
declining. This was also exacerbated by the reversals in the maize market liberalization
process, which made it difficult for the private sector to invest in maize marketing activities.

In coffee, production continued to decline despite the continued high coffee prices at the
world market and the partial liberalization of coffee marketing. The liberalization of coffee
marketing has been incomplete and is concentrated at the apex marketing and milling level.
Little attention has been given to the restructuring of the coffee cooperatives and factories.
These institutions are inefficient in coffee processing and are characterized by poor financial
management so, coffee farmers continue to receive low payments. They also lack sufficient
credit. Only tea and tomatoes have continued to maintain high rates of growth in the value
of production.


3.4. Trends in Rural Population

Trends in the rural population have followed closely the growth rates of the total population.
The rural population grew at average rates of about 4% per annum between 1970-80 that
have declined slightly to about 3% per annum in the 1990s. Except in Rift valley province,
the rural population grew at a lower rate after the 1970-79 period. Rift valley, Eastern and
Western provinces have the highest growth rate in rural population as shown in Table 4.


Table 4. Trends in Rural Labor (% Growth per Annum)
               1970-79    1980-85   1985-90   1990-95
Central             4.6       4.1       3.4       3.3
Eastern             4.5       4.7       4.1       3.8
Rift valley         5.0       6.2       5.6       4.9
Western             4.0       5.3       4.6       3.7
Nyanza              3.1       3.6       3.9       3.2


                                               7
3.5. National Land and Labor Productivity

The graphical representation of land and labor productivity through time follow Hayami and
Ruttan (1985) and more recently Block (1994). The value of total agricultural production is
developed as a product of production and the average producer price for each year. The total
value of each crop was summed across all crops to get the total value of production for the
whole sector and for each region. Land productivity, measured in Figure 1 on the y axis, is
defined as the inflation-adjusted value of crop output per hectare. Labor productivity,
measured in Figure 1 on the x axis, is defined as the inflation-adjusted value of crop output per
rural person. Three-year centered moving averages were constructed from both series to
smooth out the effects of random variations such as weather, and then averaged in five-year
time periods, as shown in Figure 1.

Interpretation is as follows: A movement in the coordinates over time from the lower-left to
the upper-right portion of the figures represents increases in both land and labor productivity.
Movement from the upper-right to lower-left parts of the figure represents a decline in both
productivity measures. Shifts from the lower right to upper left would indicate a decline in
labor productivity but an increase in land productivity. Such a case could arise if, for
example, the value of crop output per hectare were rising over time due to either yield gains
or shifts to higher-valued crops, but under conditions of a rapidly growing agricultural labor
force. Note that in these figures, increases in these measures of partial productivity can
occur from either shifts in crop mix (e.g., from millet to higher-valued cotton) or from
increases in crop output per unit of input, or both. Figure 1 shows the path taken by the
Kenyan agriculture from the period 1970 to 1995.

Land productivity has stagnated at around Ksh 3,000 1991-95 constant prices. It increased
slightly between 1970-74 and 1974-79, then declined in the following period, improved
slightly but has since 1990-95 declined by about 23 percent of the 1985-90 level. Land
Productivity increased initially by about 12 percent between 1970-74 and 1974-79 period. It
then declined slightly and recovered after the 1980-85. Land productivity then declined by
about 12 percent between 1985-90. The decline in land and labor productivity in 1980-85
period could be attributed to the two droughts that occurred during that period. Labor
productivity has generally stagnated because the rural labor force has grown faster than the
value of agricultural production per hectare.

The increase in land productivity between 1970 and 1980 was in response to the adoption of
high yielding varieties of maize and increased use of fertilizers and other yields enhancing
inputs as shown in Table 5. A large proportion of smallholders benefitted from the
expansion of state marketing infrastructure and transport subsidies inherent in the state
marketing boards pan-territorial pricing structure. These pricing and market support policies
clearly encouraged the adoption of newly available hybrid maize seeds and stimulated the
growth in smallholder grain area and yields during the 1970s. However, this state-led
model of service provision to smallholder farmers has proven politically and economically
unsustainable. Evidence in some areas indicates that the production growth was achieved at
a cost greater than the value of the output. While there is some opinion that the cutbacks in
state transfers to smallholder grain producers have gone too far, there are rarely concrete


                                               8
proposals for who should be taxed to pay for the recurrent costs of these transfers (Jayne and
Jones 1997).3


Figure 1. Land and Labor Productivity Ratios for the Period 1970-1995

                                                        Trends in Land and Labor Productivity
                                                                                                       1985-90
                                         52,000


                                         51,000


                                         50,000
        Land Productivity (Ksh/Ha) Y/A


                                                                                                        1975-80
                                         49,000


                                         48,000
                                                                                            1980-85

                                         47,000


                                         46,000


                                         45,000               1990-95


                                         44,000                                                       1970-1974


                                         43,000
                                               2,200     2,400       2,600      2,800          3,000        3,200
                                                       Labor Productivity (Ksh/Rural Population) Y/L


Table 5. Quantities of Seed and Fertilizer Used in Maize
              Maize Hybrid Purchased Fertilizer Total Credit AFC                                                    Credit on Maize
                    Kgs            ‘000 Tons          Million Ksh                                                     Million Ksh
1970-74                 7,494              141              2,087                                                             877
1975-79               11,054               124              1,778                                                             747
1980-84               14,788               139              2,183                                                             917
1985-89               20,486               223              1,057                                                             444
1990-95               19,272               245                371                                                             157


3
  While data on the sources of treasury revenue are unavailable for these specific countries, an interesting
study by Gersovitz and Paxson (1996) shows that the revenue base of most African governments is narrow,
depending primarily on taxation of imports and exports. The production and income foregone resulting from
taxation of other sectors to transfer resources to grain producers is seldom accounted for in assessments of the
benefits of state-led growth strategies.

                                                                                        9
During this period use of hybrid maize seed increased by about 160 percent. Fertilizer use
increased by about 50 percent. The government also supported producers through the
provision of extension service and credit to farmers supported the increases in yields.
Seasonal credit including that in the Guaranteed Minimum Returns Scheme from
Agricultural Finance Corporation increased by more than 5 times between 1970 and 1980.

After 1980 due to high population densities in the high-potential areas, crops expanded to
low and marginal areas. However, to a large extent, the production technologies adopted
were borrowed from the medium and high potential areas and are tend to be less suitable.
Though the rate of adoption of hybrid maize seeds remained high, there is a widespread
belief that the quality of maize and wheat seed has declined. Use of maize hybrid seeds
dropped by 6 percent between 1990 and 1995. Quantities of DAP and CAN fertilizers used
in maize production have also declined. Yields thus have declined. The seasonal credit from
AFC for maize and wheat production also have declined and became unreliable. The drop in
land productivity could also be attributed to the poor performance of government support
services in extension.

These results are consistent with the earlier findings (Block 1992) that the living standards of
agricultural workers have not only stagnated in the past 20 years but that it has declined over
the last 5 years. Unless off-farm income per person has risen to compensate for this decline,
the welfare of the rural population is likely to be lower today than in the previous several
decades. The decline in the value of agricultural production per hectare also implies the
slackening in the rate of the economic growth due the importance attached to agriculture in
the economy.


                 4. REGIONAL LAND AND LABOR PRODUCTIVITY


Level and growth in land and labor productivity is influenced by the crop mixes in each
region. Table 6 shows the relative importance of crops in each region. In Central Provinces,
coffee, tea and horticulture dominate the value of agricultural production. Maize and other
minor crops thus are less important. In Eastern, maize production is as important as coffee
production is. Horticulture is also a major enterprise. The crops in the rift valley province
are dominated production of maize and wheat. Coffee and tea are less important crops. Maize
and sugar are the most important crops in Western and Nyanza provinces. Horticulture,
coffee and tea are of secondary importance.


                                              10
Table 6. Crops Contribution to the Regional Total Value of Production (%)
               Central     Eastern Rift Valley Western           Nyanza
Coffee          52           36         2         3                6
Tea             11            6         8         1                1
Maize            9           36        62        53               49
Wheat            1            1        14
Horticulture    24           16        10         2                 4
Pyrethrum                               2                           3
Sugar             -                              36                28
Others            3           5         2         3                 9
                            100       100       100               100


The relative growth in the total value of agricultural production by regions is shown in
Figure 2. The value of agricultural production grew in all regions until 1990-95 after which it
then declined. Central Kenya has the highest total value of production because of the
dominance of the production of high-valued crops. The rapid increase in the value of
agricultural production in central was as a result of the shift towards high value crops such as
tomatoes, French beans and other horticultural crops (floriculture was not included in this
analysis). Rift valley and Eastern Province have also high value of agricultural production
because despite the dominance of maize and wheat which are lower value crops, the province
agriculture is boosted by the production of some coffee, tea and horticulture. The value of
agricultural production has however stagnated in Western and Nyanza mainly because of the
poor performance of maize and sugar.


4.1. Regional Partial Productivity Ratios

The partial productivity ratios for each province are shown in Figures 3 to 6. In Central
Province (Figure 3), labor productivity is high at Ksh 6,341 in the 1990-95 constant average
prices. However, labor productivity has declined and only increased substantially by about 13
percent between 1985 and 1990. It declined between 1990 and 1995. There were more rapid
gains in land productivity, which increased by about 27 percent between 1970-75 and 1974-
79. Land productivity has also declined after 1990-1995 period. Labor productivity has
increased less rapidly in Central Province because of the high growth in the rural population.


                                              11
Figure 2. Trends in the Total Value of Production by Provinces


                                                  30,000
   Value of Total Production in Millions of Ksh


                                                  25,000


                                                  20,000


                                                  15,000


                                                  10,000


                                                   5,000
                                                                                                                CENTRAL
                                                                                                                EASTERN
                                                     -
                                                                                                                RIFT VALLEY
                                                         1970-74   1975-79   1980-84        1985-89   1990-95
                                                                                                                WESTERN
                                                                             Period
                                                                                                                NYANZA


The growth in land productivity in Central between 1970 and 1980 could be attributed to the
high adoption of fertilizers and maize varieties. Also, because of the good blend of crop
mixes and the shift to the high value horticultural crops the land and labor productivity
increased. The poor performance in coffee, which contributes about 52% of the value of
production in this area, has caused a decline in the land and labor productivity during 1990-
95.


                                                                                       12
Figure 3. Trends in the Total Value of Production by Provinces

                                                            Land and Labor Productivity For Central Province


                                             60000

                                             58000
   Land Productivity (Ksh per Hectare) Y/A


                                             56000

                                             54000                                               1980-85
                                                                                                           1974-79
                                             52000
                                                                          1985-90
                                             50000

                                             48000       1990-95


                                             46000

                                             44000

                                             42000
                                                            1970-74

                                             40000
                                                 6000        6500           7000          7500              8000
                                                        Labor Productivity (Ksh per Rural Person) Y/A


In Eastern Province (Figure 4), labor productivity is low at Ksh 1,585 per rural person. It
more than doubled between 1970-74 and 1974-75 but has declined after 1990. But land
productivity has decreased after the initial increase between 1974-75 and 1975-79. By 1990-
95, for example land productivity was lower than it was in the 1975-80 period thus again
depicting the deteriorating state of the welfare of the rural population.


                                                                                        13
Figure 4. Land and Labor Productivity Ratios for Eastern Province

                                                            Land and Labor Productivity for Eastern Province


                                             38,000

                                                                         1985-90
   Land Productivity (Ksh per Hectare) Y/A


                                             33,000
                                                                                                      1980-85


                                                       1990-95                                             1974-79

                                             28,000

                                                                                          1970-74


                                             23,000


                                             18,000
                                                      500        1,500       2,500       3,500        4,500
                                                             Labor Production (Ksh per Rural Person) Y/L


In the Rift Valley province (Figure 5), labor productivity has stagnated at Ksh 1000 per rural
person. Between 1970-75 and 1974-79, the productivity increased slightly after which it has
declined to the 1970-74 levels. Labor productivity has declined in the 1990-95 period. Land
productivity in the Rift Valley province increased by 26 percent between 1970-74 and 1974-
79 period. It stagnated and then declined by 11 percent after 1990.


                                                                                                 14
Figure 5. Land and Labor Productivity Ratios For Rift Valley Province

                                                              Land and Labor Productivity for Rift Valley


                                             49000
   Land Productivity (Ksh per Hectare) Y/A


                                                                                       1985-90
                                                                                                               1974-79
                                             47000

                                                                             1980-85
                                             45000

                                             43000             1990-95

                                             41000

                                             39000
                                                                         1970-74
                                             37000

                                             35000
                                                  900   950       1000        1050      1100     1150   1200    1250
                                                                                                                         Series1
                                                          Labor Productvity (Ksh per Rural Person) Y/L


The increase in land and labor productivity in this province is attributed to the adoption of
the high yielding maize and wheat varieties around the 70s and increased use of fertilizers
during that period. The decline during the 1990-95 period is attributed to the reduction in use
of fertilizers and other inputs following the profit squeeze caused by the reduced maize and
wheat production incentives during the liberalization period. Maize prices in selected Rift
Valley markets (as well as most of Kenya) have declined roughly 25 percent in real inflation-
adjusted terms between the 1985-92 period and the 1993-98 period.

Land and productivity for Western Province (Figure 6) increased slightly between 1970-74
period after it declined and has stagnated for the rest of the time until 1990-95 when it
declined by a further 9 percent. Land productivity also increased initially by 34 percent
between 1970-74 and 1974-79 period. It then declined following the droughts of the 1980s.
Land productivity in Western Province has after recovering slightly in 1985-90 has declined
by about 15 percent after 1990. Land productivity has increased more rapidly than the labor
productivity because rural population in western province grew faster than the land
productivity. Poor maize prices and mismanagement of sugar factories have resulted in the
decline in production and the subsequent fall in the labor and land productivity.


                                                                                            15
Figure 6. Land and Labor Productivity Ratios for Western Province

                                                      Land and Labor Productivity for Western Province


                                          45000

                                          43000
                                                                                                1985-90
  Land Productvity (Ksh per Hectare Y/A


                                          41000

                                          39000                                                         1974-79

                                          37000
                                                                                                            1980-85
                                          35000                     1990-95

                                          33000

                                          31000

                                          29000                                     1970-74

                                          27000

                                          25000
                                              2700   2800      2900     3000    3100    3200     3300       3400      3500
                                                                                                                             Series1
                                                            Labor Productivity (Ksh per Rural Person) Y.L


In Nyanza Province (Figure 7) was initially higher than that in western province about Ksh
2,000 per rural population. After increasingly slightly between 1970-74 and 1974-79 period,
labor productivity in Nyanza decreased by 15 percent between 1974-79 and 1979-80 and by
15 percent between 1985-90 and 1990-95 period. Labor productivity in 1990-95, was only
65 percent what it was in 1970-74 period. Land productivity in Nyanza increased initially by
about 13 percent between 1970-74 and 1974-79. It declined during the drought years,
improved slightly after 1985 and has decreased further by 12 percent between 1985-90 and
1990-95 period. Like Western province, Nyanza lacks the production of high value crops.
Both sugar and maize whose performance has been poor dominate the production in this
province.


                                                                                         16
Figure 7. Land and Labor Productivity Ratios for Nyanza Province

                                                        Land and Labor Production for Nyanza Province


                                             25000


                                             24000
   Land Productivity (Ksh per Hectare) Y/A


                                             23000
                                                                         1985-90


                                             22000                                            1979-80


                                                                                   1980-85
                                             21000


                                             20000
                                                        1990-95
                                                                                        1970-74

                                             19000


                                             18000
                                                 1000             1500                2000              2500
                                                        Labor Productivity (Ksh per Rural Person) Y/L


4.2. Factors Influencing Land and Labor Productivity

It is difficult to discern clear and consistent trends in productivity changes within regions
because Kenya does not have specific regionally-based agricultural policies. Weather
patterns and crop cultivation patterns can differ widely across regions. The crop mixes in
each zone thus influence regional agricultural productivity. In Central Province for example
labor productivity increased during the period 1970-1980 when it mainly stagnated in the
other provinces during the same time. The land productivity also increased more rapidly in
Central Province than in other provinces. This is due to shifts in crop mixes from crops like
maize towards high value horticultural crops. In Nyanza and Western provinces particularly,
the land and labor productivity has not only been low but has also declined faster than in
other areas. The results thus implies that except in central, the welfare for the rural
population in all the other provinces stagnated until 1990 when it has started to decline. The
contribution of the provinces to the general economic growth in the country has also decline
following the decline in the value of agricultural production. A higher proportion of rural
families thus are likely to be more food insecure than they were in 1990, have less job
opportunities and have less family incomes.

Land productivity and labor productivity growth have corresponded to the periods when area
expansion of high-value crops was taking place. Area expansion, particularly of maize,


                                                                                        17
coffee, and wheat, has extended to marginal areas due to increasing population pressure in
the high potential areas. A higher proportion of the population has moved to the lesser
potential and more marginal areas. But crop varieties and other production technologies used
in these areas remain those designed for the high and medium potential areas. It is
increasingly clear that viable technology packages for marginal areas will be needed to
appreciably raise aggregate agricultural productivity in Kenya and alleviate rural poverty.

Limited technical progress in Africa has fostered an active debate over the performance of
technology generation and dissemination systems. For example, questions are frequently
posed whether viable food crop technology packages exist for medium and low potential
areas that are relevant for smallholders (but aren’t being fully utilized for other reasons) or
whether the available on-shelf food crop technologies simply aren’t viable enough to
appreciably stimulate agricultural growth. Another question that may be posed is why,
despite an empirical record indicating very high rates of return to agricultural research in
Africa, has food crop production growth remained mostly stagnant in these same countries in
which the empirical investigations were carried out.

The partial productivity analysis depicts a very volatile and fragile agricultural system where
productivity gains in a few years can be eroded almost immediately. This underscores the
need for high quality agricultural research systems to generate continuous improvements in
farm technology over time. The decline in land and labor productivity corresponds to the
time when market reform policies were implemented. The partial, stop-go nature of market
liberalization and poor sequencing of the liberalization policies during the 1990s has
mitigated some of the important potential benefits of reform to producers. The policies were
also poorly timed (Nyangito 1998). For example, fertilizer prices were liberalized in 1990
when the maize, wheat and sugar prices and marketing continued to be regulated by
government until 1994. This squeezed profits and thus reduced producer incentives to use
productivity-enhancing inputs. The inflationary conditions of the 1990s, fueled by the
depreciation of the shilling, increased the prices of imported fertilizer and pesticides at a
higher rate than the rise in commodity prices, which thus squeezed the profits and reduced
the producer incentives. On top of this, problems in developing viable systems of private
farm finance have left a vacuum in the agricultural credit system after the contraction of the
AFC system. As a result, maize and wheat area and production have declined, use of
fertilizer has stagnated, and use of hybrid maize seed has actually declined.

The extension delivery to farmers is poor and farmers may not be aware of the improved
technologies. Farmers have increasingly been unable to access credit through the formal
credit market. For many smallholders, the purchase of yield enhancing inputs such as
fertilizers, pesticides, seed and payment of labor (PAM 1995). Seed quality particularly that
of maize and wheat is poor because of the poor distribution system, which restricted the
availability of preferred seed. Lack of a reliable seed quality control service also contribute
to the poor quality seed (Nyoro 1995).


                                               18
5. CONCLUSIONS AND IMPLICATIONS FOR POLICY TO STRENGTHEN
                    AGRICULTURAL PRODUCTIVITY


This section summarizes the findings above, and draws from a wider range of experience in
Sub-Saharan Africa on identifying cost-effective strategies for increasing agricultural
productivity.


5.1. Summary of Main Results

The partial productivity measure for labor (in constant 1991-95 terms) has declined from
roughly 3,000 Ksh per rural person in 1970-74 to 2,400 Ksh per person in 1990-94 -- about a
20 percent decline. Land productivity had increased greatly up to about 1990 and has fallen
since. The decline has occurred because fertilizer use has stagnated, use of hybrid maize
seed has declined because seed quality has declined. Contraction of credit schemes by the
AFC has also left a vacuum in the agricultural credit system. On the policy side, the stop-go
policy environment, poor sequencing of the liberalization policies has mitigated some of the
important potential benefits of reform to producers. The poor management of coffee
cooperatives and sugar factories have reduced payments to farmers. Due to increasing
population pressure in the high potential areas, a high proportion of population has moved to
lesser potential and more marginal area without appropriate technologies suitable for these
fragile areas. This has caused decline in crop production in these areas.

Large increases in the land and labor productivity such as that achieved in Central Province
are due to the changes in crop mixes. In crops like coffee, tea maize and wheat, the growth in
productivity was as a result of area expansion rather than intensification of the existing
farming systems. Growth in land productivity has also resulted from the development and
adoption of new varieties of maize and wheat crops. But crop yields have also declined
because crop varieties and other production technologies adopted in the low potential and
marginal areas are inappropriate for them.

A major challenge in Kenya now is to adopt policy reforms that could induce technical
change in agriculture.4 Polices adopted should solve the broader problems relating to the
generation, dissemination and adoption of new technologies and thus stimulate changes in
crop mixes towards the production of high value crops.

Market policy reforms and technology development therefore need to be viewed as different
facets of the same problem. Marketing strategies will need to refocus their emphasis from
the liberalization of markets to the sustainable promotion of productivity growth for the
millions of low-input semi-subsistence rural households in Kenya. This implies a major role
for future marketing research in identifying public and private investments and activities that
will intensify input use on smallholder farms. Can such research activities be financed within
the constraints of available budgets, and involve greater coordination between the public and
private sectors in providing smallholders with access to integrated input, credit, and output
markets. The most promising scenarios are likely to involve farmer organizations


4
  Important steps that the government could take to in this direction to raise productivity have been
recommended by Tegemeo in the proceedings of the conference on improving agricultural performance
towards 2000 (PAM 1995). These includes the following:

                                                    19
(accountable to farmers), multinational input and commodity trading firms, improved
technology development, a supportive public sector. An expanded role for commodity
exchanges, forward contracting, and other mechanisms could also be used to reduce the costs
and risks of investing in the entire food system (Jayne and Jones 1997).

Given the fiscal restrictions imposed by the need for structural adjustment, there will be
increased emphasis in the foreseeable future on developing financially sustainable market-
oriented mechanisms and exploiting the potential gains from regional trade. Important steps
that governments could take to raise the productivity and stability of the food systems
include the following:

1. Improve Road, Rail, Port, and Communication Infrastructure: Donor support in this area
would make the market liberalization measures they advocated more successful. High
transportation costs in Kenya contribute to higher fertilizer prices, lower output prices for
farmers and hence lower incentives to invest in productivity-enhancing technologies.
Improved market infrastructure also requires further policy change to remove remaining
import tariffs on grain, vehicles and spare parts.

One important role for research is to identify where such infrastructure investments would
have the highest payoffs. For example, by analyzing food production, consumption, and
price dispersion patterns in a country, researchers can provide insights into where investment
in a road would do the most to improve food security or increase production potential
through raising farm output prices and lowering farm input prices. Given the high cost of
such infrastructure investments, such targeting is extremely important.

2. Invest More in Market-oriented Agricultural Research: In market-oriented growth
strategies, well tested and improved cultivars and management practices for commodities for
which there are viable markets, work synergistically with improved input and output markets
to create sustainable conditions for intensification and productivity growth. Yet national
research budgets and donor funding of technology development are in many cases declining.
KARI faces numerous problems including low salaries, dismal conditions of service for their
researchers, and continued reliance on donor finance for funds whose sustainability cannot be
assured. The history of agricultural research in Uganda shows the impossibility of turning
research off and on. It takes only a short lapse in research support to result in massive losses
in human and physical capital that requires painful and expensive new investments to rebuild.
And despite claims that fertilizer/seed technologies are on the shelf that can double or triple
farm yields in Africa, there remains a dearth of research on the profitability and riskiness of
those technologies under farmers’ actual control, and under current input and output market
conditions or those foreseeable under alternative sustainable input and output marketing
arrangements. KARI could also expansion the generation of technologies that are more
suitable to the medium and lower potential areas as is happening in wheat and maize. Priority
setting process should also included in these crops.

The boundaries between production and marketing activities are becoming increasingly
blurred, as the agricultural product specification becomes more complex. For example, the
rising importance of biotechnology will create a variety of new opportunities for applying
new scientific discoveries toward practical use in the food and fiber system and working out
intellectual property rights for the product (Zilberman, Yarkin, and Heiman 1997). An
increasingly important role of the interrelated research, marketing, and legal systems is to
work out the details of use and exchange of information and knowledge.


                                              20
3. Invest More to Nurture the Political, Legal and Economic Foundations of Private
Marketing Systems: A well-functioning legal and political framework for market activity
reduces the risks and transactions costs of private trade. Strengthened mechanisms for
specifying and enforcing contracts, raising the costs of contract non-compliance, and more
pluralistic procedures for developing the rules governing market activity are important
adjuncts to developing reliable markets, and inherently involve strengthening the regulatory
abilities of the state rather than getting the state out of market regulation. In general, this
means a reorientation of the state from control activities to facilitation activities designed
to reduce farmers’ and traders’ costs of transacting across inputs, credit, and commodities.
This would include, for example, the removal of existing legal and institutional constraints
that have impeded the establishment of efficient management of the smallholder tea factories
and coffee cooperative societies.

The timely dissemination of market information can also help policy makers monitor the
evolving effects of market liberalization better, identify problems that require mid-course
correction, and respond to impending supply fluctuations in a more timely way. Such an
approach also includes more public support for the development of fledgling commodity
exchanges, which have the longer-run potential to improve the dissemination of market
information, reduce search costs to link buyers and sellers substantially, and lower supply
and price risks through forward contracting and hedging.

4. Coordinate Policies and Investments to Gain Complementary Benefits from Higher-
Valued Cash and Food Crop Production: With most of Kenya’s poor residing in regions of
significant agricultural potential, and in light of severe land constraints in many of these
regions, developing strategies to increase the value of agricultural production per unit of land
and labor is a top priority. Smallholder commercialization, particularly into higher-value
export crops, generally has produced significant and positive effect on food crop fertilizer
use and productivity, however, this varies by crop and region. A major avenue for future
research is to understand better how successful commercialization arrangements linking
smallholders and marketing/processing firms have been structured so that their successful
ingredients can be replicated and incorporated more broadly into commercialization
strategies in other regions. This is likely to yield high payoffs in terms of increasing
agricultural productivity and food security.

5. Increase Business Skills Training and Related Support for Grass-roots Farmer
Organizations: While the benefits of existing farmer organizations have derived mainly
from reducing the transaction costs of acquiring and repaying credit through group schemes,
these benefits can be potentially extended into a broader range of input and output marketing
activities. For example, in Mali, such organizations handle most of the bulking and initial
grading of cotton and the management of local savings and loan associations. Future roles
for farmer organizations include greater involvement in the gathering and dissemination of
market information, the diffusion of technical advice, and the bulking of farmer surpluses to
facilitate smallholder participation in local and regional markets, thereby opening up a
number of market-oriented mechanisms (e.g., commodity exchanges, forward contracting)
for reducing the risks of price and supply instability.

Moreover, there are very different economies of scale at various stages of the food system.
Multinational firms may have certain advantages in international trade (acquiring fertilizer
and other inputs, hedging on futures markets, having a wider trade portfolio to reduce risks)
and accessing technologies from around the world. But given the small size of most African


                                               21
markets, such large firms are likely to have substantial market power and may not have
incentives to pass on all these benefits to smallholders. The development of strong farmer
groups may mitigate the potential for actors at highly concentrated stages to exert market
power to the detriment of smallholder production growth. Such organizations may even act
as subcontractors or partners to multinationals, thereby creating a system that captures the
benefits of scale economies in international trade while tailoring specific services to local
farmers' conditions.5

6. Invest in Local Analytical Capacity: The payoffs to market reforms have been most
effective when as part of the reform process, there has been a concerted effort to strengthen
domestic capacity for ongoing research and analysis to inform the reform process. Because
of the paucity of data on food systems in most African countries, most reforms are
necessarily designed initially on the basis of scanty empirical information. The strengthening
of domestic analysis capacity allows a mechanism for on-going monitoring of food system
performance in response to the reforms and provides a mechanism for mid-course corrections
as researchers uncover new empirical information. Given the ongoing nature of the reforms,
it is unlikely that outside consultants alone can assure the continuity of monitoring, analysis
and evaluation needed to help guide the reforms.

Lasting market and related policy change depends critically on governments’ actual belief in
the analysis supporting the reforms. There is ample evidence that governments that have
reluctantly undertaken market reform programs have reversed them and reimposed the old
system of price and trade controls with the advent of drought or other shocks (Jayne and
Jones 1997). Local analytical units are often seen as bringing more local knowledge to the
analysis, being less ideologically driven, and having greater sensitivity to domestic policy
concerns than analysis conceived and driven by donor interests using expatriate analysts. At
the same time, cooperative analyses involving both local units and external researchers is
often valued, as the involvement of an internationally known research organization often
gives local decision makers greater confidence in the scientific soundness of the analysis.
The demand for, and credibility of, food policy analysis to guide market development is
enhanced by a collaborative research process driven by local researchers and government
analysts who take ownership of the research agenda and findings.


5
 For example, in Mali the union of cotton farmers, the multinational cotton company, and the state are all
signatories to the contract-plan governing the management of the cotton subsector in the country and all
receive a share of the cotton company’s profits.

                                                     22
REFERENCES


Block, Steven. 1992. Agricultural Productivity and Its Contribution to Agricultural Growth
     in Kenya. Consultant report submitted to USAID/Kenya, Nairobi.

Block, Steven. 1994. A New View of Agricultural Productivity in Sub-Saharan Africa.
     American Journal of Agricultural Economics 76 (August): 619-624.

Cheru, Fantu. 1999. The Impact of Structural Adjustment Programmes on the Realization of
     Economic, Social and Cultural Rights. Report for the United National High
     Commission on Human Rights, Geneva.

Cornia, G.A., R. Jolly, and F. Stewart. 1987. Adjustment with a Human Face. Oxford:
     Oxford University Press.

Gersovitz, M., and C. Paxson. 1996. The Revenues and Expenditures of African
     Governments: Modalities and Consequences. Journal of African Economies 5.2: 199-
     227.

Hassan, M. Rashid, Winfred Mwangi, and Daniel Karanja. 1993. Wheat Supply in Kenya:
     Production Technologies, Sources of Inefficiency and Potential for Productivity
     Growth. Nairobi: Kenya Agricultural Research Institute.

Hayami, Yujiro, and Vernon Ruttan. 1985. Agricultural Productivity An International
    Perspective. Baltimore: John Hopkins.

Jayne, T.S., and Stephen Jones. 1997. Food Marketing and Pricing Policy in Eastern and
     Southern Africa: A Survey. World Development 25.9: 1505-1527.

Mosley, Paul. 1994. Policy and Capital Markets Constraints to the African Green
     Revolution: A Study of Maize and Sorghum Yields in Kenya, Malawi, and Zimbabwe,
     1960-91. In From Adjustment to Development in Africa: Conflict, Controversy,
     Convergence, and Consensus?, eds. G. Andrea Cornia and G. Helleiner. New York:
     Macmillan.

Nyangito, Hezron. 1998. Agricultural Sector Performance in a Changing Policy
    Environment. Nairobi: Institute of Policy Analysis and Research.

Nyoro, J.K. 1995. Impact of Market Reform on Seed Development, Multiplication, and
     Distribution. Paper presented on the Conference on Fine Tuning Market Reforms for
     Improved Agricultural Performance, September, Nairobi.

PAM. 1995. Proceeding on the Conference on Towards 2000: Improving Agricultural
    Performance. Nairobi.

Sahn, David, and Alexander Sarris. 1991. Structural Adjustment and the Welfare of Rural
      Smallholders: A Comparative Analysis FROM Sub- Saharan Africa. The World Bank
      Economic Review 5.2: 259-289.


                                            23
Thirtle, C., Jon Atkins, Paul Botomley, Nancy Gonese, Jones Govereh, and Yougesh Khatri.
      1993. Agricultural Productivity in Zimbabwe 1970-1990. Economic Journal 103
      (March): 474-480.

United States Agency for International Development (USAID). 1993. Africa: Growth
     Renewed Hope Rekindled: A Report on the Performance of the Development Fund for
     Africa, 1988-1992. Washington, D.C.: USAID, Office of Development Planning,
     Bureau for Africa.

World Bank. 1994. Adjustment in Africa: Reforms, Results and the Road Ahead. New York:
     Oxford University Press.

Zilberman, D., C. Yarkin, and A. Heiman. 1997. Agricultural Biotechnology: Economic and
      International Implications. Invited paper presented at the International Agricultural
      Economics Association meeting, August, Sacramento, California.


                                            24

Weitere ähnliche Inhalte

Was ist angesagt?

A model application to assess resource use efficiency for maize production in...
A model application to assess resource use efficiency for maize production in...A model application to assess resource use efficiency for maize production in...
A model application to assess resource use efficiency for maize production in...Alexander Decker
 
Analysis of food crop output volatility in agricultural policy programme regi...
Analysis of food crop output volatility in agricultural policy programme regi...Analysis of food crop output volatility in agricultural policy programme regi...
Analysis of food crop output volatility in agricultural policy programme regi...Alexander Decker
 
Agricultural statistics with special reference to Jammu & Kashmir state
Agricultural statistics with special reference to Jammu & Kashmir stateAgricultural statistics with special reference to Jammu & Kashmir state
Agricultural statistics with special reference to Jammu & Kashmir statePawan Sharma
 
Productivity and Income SDGs 2.3.1 & 2.3.2_ENGLISH
Productivity and Income SDGs 2.3.1 & 2.3.2_ENGLISHProductivity and Income SDGs 2.3.1 & 2.3.2_ENGLISH
Productivity and Income SDGs 2.3.1 & 2.3.2_ENGLISHFAO
 
Effects of Rice Liberalization Law on Rice Production, Farmers’ Wages and Gov...
Effects of Rice Liberalization Law on Rice Production, Farmers’ Wages and Gov...Effects of Rice Liberalization Law on Rice Production, Farmers’ Wages and Gov...
Effects of Rice Liberalization Law on Rice Production, Farmers’ Wages and Gov...IJAEMSJORNAL
 
Integrated agricultural system, migration, and social protection strategies t...
Integrated agricultural system, migration, and social protection strategies t...Integrated agricultural system, migration, and social protection strategies t...
Integrated agricultural system, migration, and social protection strategies t...ILRI
 
DESIGN AND IMPLEMENTATION OF ONTOLOGY BASED ON SEMANTIC ANALYSIS FOR GIS APPL...
DESIGN AND IMPLEMENTATION OF ONTOLOGY BASED ON SEMANTIC ANALYSIS FOR GIS APPL...DESIGN AND IMPLEMENTATION OF ONTOLOGY BASED ON SEMANTIC ANALYSIS FOR GIS APPL...
DESIGN AND IMPLEMENTATION OF ONTOLOGY BASED ON SEMANTIC ANALYSIS FOR GIS APPL...cscpconf
 
Trends, Growth and Instability of Teff Production in Ethiopia
Trends, Growth and Instability of Teff Production in EthiopiaTrends, Growth and Instability of Teff Production in Ethiopia
Trends, Growth and Instability of Teff Production in Ethiopiapaperpublications3
 
Gov Inv and Food Price SDGs 2.a.1 & 2.c.1_ENGLISH
Gov Inv and Food Price SDGs 2.a.1 & 2.c.1_ENGLISHGov Inv and Food Price SDGs 2.a.1 & 2.c.1_ENGLISH
Gov Inv and Food Price SDGs 2.a.1 & 2.c.1_ENGLISHFAO
 
Womens Access Land SDGs 5.a.1 & 5.a.2_ENGLISH
Womens Access Land SDGs 5.a.1 & 5.a.2_ENGLISHWomens Access Land SDGs 5.a.1 & 5.a.2_ENGLISH
Womens Access Land SDGs 5.a.1 & 5.a.2_ENGLISHFAO
 
Roundtable on countries census plans, approaches and methodologies
Roundtable on countries census plans, approaches and methodologiesRoundtable on countries census plans, approaches and methodologies
Roundtable on countries census plans, approaches and methodologiesFAO
 
AGRIS Methodology
AGRIS MethodologyAGRIS Methodology
AGRIS MethodologyFAO
 
Technical Efficiency of Sorghum Production: The Case of Smallholder Farmers i...
Technical Efficiency of Sorghum Production: The Case of Smallholder Farmers i...Technical Efficiency of Sorghum Production: The Case of Smallholder Farmers i...
Technical Efficiency of Sorghum Production: The Case of Smallholder Farmers i...Journal of Agriculture and Crops
 
The International Journal of Engineering and Science (The IJES)
The International Journal of Engineering and Science (The IJES)The International Journal of Engineering and Science (The IJES)
The International Journal of Engineering and Science (The IJES)theijes
 

Was ist angesagt? (19)

king
kingking
king
 
A model application to assess resource use efficiency for maize production in...
A model application to assess resource use efficiency for maize production in...A model application to assess resource use efficiency for maize production in...
A model application to assess resource use efficiency for maize production in...
 
Analysis of food crop output volatility in agricultural policy programme regi...
Analysis of food crop output volatility in agricultural policy programme regi...Analysis of food crop output volatility in agricultural policy programme regi...
Analysis of food crop output volatility in agricultural policy programme regi...
 
Agricultural statistics with special reference to Jammu & Kashmir state
Agricultural statistics with special reference to Jammu & Kashmir stateAgricultural statistics with special reference to Jammu & Kashmir state
Agricultural statistics with special reference to Jammu & Kashmir state
 
Productivity and Income SDGs 2.3.1 & 2.3.2_ENGLISH
Productivity and Income SDGs 2.3.1 & 2.3.2_ENGLISHProductivity and Income SDGs 2.3.1 & 2.3.2_ENGLISH
Productivity and Income SDGs 2.3.1 & 2.3.2_ENGLISH
 
Access to improved seeds and fertilizers and agricultural productivity in Kyr...
Access to improved seeds and fertilizers and agricultural productivity in Kyr...Access to improved seeds and fertilizers and agricultural productivity in Kyr...
Access to improved seeds and fertilizers and agricultural productivity in Kyr...
 
Effects of Rice Liberalization Law on Rice Production, Farmers’ Wages and Gov...
Effects of Rice Liberalization Law on Rice Production, Farmers’ Wages and Gov...Effects of Rice Liberalization Law on Rice Production, Farmers’ Wages and Gov...
Effects of Rice Liberalization Law on Rice Production, Farmers’ Wages and Gov...
 
Integrated agricultural system, migration, and social protection strategies t...
Integrated agricultural system, migration, and social protection strategies t...Integrated agricultural system, migration, and social protection strategies t...
Integrated agricultural system, migration, and social protection strategies t...
 
DESIGN AND IMPLEMENTATION OF ONTOLOGY BASED ON SEMANTIC ANALYSIS FOR GIS APPL...
DESIGN AND IMPLEMENTATION OF ONTOLOGY BASED ON SEMANTIC ANALYSIS FOR GIS APPL...DESIGN AND IMPLEMENTATION OF ONTOLOGY BASED ON SEMANTIC ANALYSIS FOR GIS APPL...
DESIGN AND IMPLEMENTATION OF ONTOLOGY BASED ON SEMANTIC ANALYSIS FOR GIS APPL...
 
Trends, Growth and Instability of Teff Production in Ethiopia
Trends, Growth and Instability of Teff Production in EthiopiaTrends, Growth and Instability of Teff Production in Ethiopia
Trends, Growth and Instability of Teff Production in Ethiopia
 
Gov Inv and Food Price SDGs 2.a.1 & 2.c.1_ENGLISH
Gov Inv and Food Price SDGs 2.a.1 & 2.c.1_ENGLISHGov Inv and Food Price SDGs 2.a.1 & 2.c.1_ENGLISH
Gov Inv and Food Price SDGs 2.a.1 & 2.c.1_ENGLISH
 
Womens Access Land SDGs 5.a.1 & 5.a.2_ENGLISH
Womens Access Land SDGs 5.a.1 & 5.a.2_ENGLISHWomens Access Land SDGs 5.a.1 & 5.a.2_ENGLISH
Womens Access Land SDGs 5.a.1 & 5.a.2_ENGLISH
 
Estimating Impact of Weather Variables on Rice Production in Tanzania: What i...
Estimating Impact of Weather Variables on Rice Production in Tanzania: What i...Estimating Impact of Weather Variables on Rice Production in Tanzania: What i...
Estimating Impact of Weather Variables on Rice Production in Tanzania: What i...
 
Roundtable on countries census plans, approaches and methodologies
Roundtable on countries census plans, approaches and methodologiesRoundtable on countries census plans, approaches and methodologies
Roundtable on countries census plans, approaches and methodologies
 
2015 ReSAKSS Conference – Day 1 - Sam Benin
2015 ReSAKSS Conference – Day 1 - Sam Benin2015 ReSAKSS Conference – Day 1 - Sam Benin
2015 ReSAKSS Conference – Day 1 - Sam Benin
 
Tomato 2279
Tomato 2279Tomato 2279
Tomato 2279
 
AGRIS Methodology
AGRIS MethodologyAGRIS Methodology
AGRIS Methodology
 
Technical Efficiency of Sorghum Production: The Case of Smallholder Farmers i...
Technical Efficiency of Sorghum Production: The Case of Smallholder Farmers i...Technical Efficiency of Sorghum Production: The Case of Smallholder Farmers i...
Technical Efficiency of Sorghum Production: The Case of Smallholder Farmers i...
 
The International Journal of Engineering and Science (The IJES)
The International Journal of Engineering and Science (The IJES)The International Journal of Engineering and Science (The IJES)
The International Journal of Engineering and Science (The IJES)
 

Ähnlich wie Farmer's Agribusiness Training Course: Module 1 Lesson 3 Supplementary Reading. Trends in Regional Agricultural Productivity in Kenya

A meta-regression analysis of frontier efficiency estimates from Africa
A meta-regression analysis of frontier efficiency estimates from AfricaA meta-regression analysis of frontier efficiency estimates from Africa
A meta-regression analysis of frontier efficiency estimates from AfricaKeuler Hissa
 
Effect of nigerian macro economic and macro-environment related factors on a...
 Effect of nigerian macro economic and macro-environment related factors on a... Effect of nigerian macro economic and macro-environment related factors on a...
Effect of nigerian macro economic and macro-environment related factors on a...Alexander Decker
 
Analyzing the economic benefit of fresh tomato production at the tono irrigat...
Analyzing the economic benefit of fresh tomato production at the tono irrigat...Analyzing the economic benefit of fresh tomato production at the tono irrigat...
Analyzing the economic benefit of fresh tomato production at the tono irrigat...Alexander Decker
 
The efficiency of maize farming in malawi (tchale, 2007)
The efficiency of maize farming in malawi (tchale, 2007)The efficiency of maize farming in malawi (tchale, 2007)
The efficiency of maize farming in malawi (tchale, 2007)mirarif
 
C:\fakepath\the removal of agricultural subsidies and their effects on tomato...
C:\fakepath\the removal of agricultural subsidies and their effects on tomato...C:\fakepath\the removal of agricultural subsidies and their effects on tomato...
C:\fakepath\the removal of agricultural subsidies and their effects on tomato...george atauhene boateng
 
1 ijhaf aug-2017-3-long run analysis of the carrying
1 ijhaf aug-2017-3-long run analysis of the carrying1 ijhaf aug-2017-3-long run analysis of the carrying
1 ijhaf aug-2017-3-long run analysis of the carryingAI Publications
 
11.[1 10]technical efficiency in agriculture in ghana analyses of determining...
11.[1 10]technical efficiency in agriculture in ghana analyses of determining...11.[1 10]technical efficiency in agriculture in ghana analyses of determining...
11.[1 10]technical efficiency in agriculture in ghana analyses of determining...Alexander Decker
 
Demand-led market opportunities for farmers in the high value product sector ...
Demand-led market opportunities for farmers in the high value product sector ...Demand-led market opportunities for farmers in the high value product sector ...
Demand-led market opportunities for farmers in the high value product sector ...Premier Publishers
 
Supply Response of Haricot Bean: The Case of Boricha District, Southern Ethiopia
Supply Response of Haricot Bean: The Case of Boricha District, Southern EthiopiaSupply Response of Haricot Bean: The Case of Boricha District, Southern Ethiopia
Supply Response of Haricot Bean: The Case of Boricha District, Southern EthiopiaJournal of Agriculture and Crops
 
Economic Environment and Performance of Food and Beverage Sub-Sector of a Dev...
Economic Environment and Performance of Food and Beverage Sub-Sector of a Dev...Economic Environment and Performance of Food and Beverage Sub-Sector of a Dev...
Economic Environment and Performance of Food and Beverage Sub-Sector of a Dev...paperpublications3
 
Cost-benefit-analysis of Africa RISING technologies in Tanzania
Cost-benefit-analysis of Africa RISING technologies in Tanzania Cost-benefit-analysis of Africa RISING technologies in Tanzania
Cost-benefit-analysis of Africa RISING technologies in Tanzania africa-rising
 
Migration, labor supply, wages and agriculture
Migration, labor supply, wages and agricultureMigration, labor supply, wages and agriculture
Migration, labor supply, wages and agricultureAlexander Decker
 
Bali-Singla2021_Article_EmergingTrendsInMachineLearnin.pdf
Bali-Singla2021_Article_EmergingTrendsInMachineLearnin.pdfBali-Singla2021_Article_EmergingTrendsInMachineLearnin.pdf
Bali-Singla2021_Article_EmergingTrendsInMachineLearnin.pdfmawande sikibi
 
Analysis of price volatility and implications for price
Analysis of price volatility and implications for priceAnalysis of price volatility and implications for price
Analysis of price volatility and implications for priceAlexander Decker
 
Sources of Inefficiency and Growth in Agricultual Output in Subsistence Agric...
Sources of Inefficiency and Growth in Agricultual Output in Subsistence Agric...Sources of Inefficiency and Growth in Agricultual Output in Subsistence Agric...
Sources of Inefficiency and Growth in Agricultual Output in Subsistence Agric...essp2
 

Ähnlich wie Farmer's Agribusiness Training Course: Module 1 Lesson 3 Supplementary Reading. Trends in Regional Agricultural Productivity in Kenya (20)

Agriculture Public Expenditure Workshop Module 3
Agriculture Public Expenditure Workshop Module 3Agriculture Public Expenditure Workshop Module 3
Agriculture Public Expenditure Workshop Module 3
 
A meta-regression analysis of frontier efficiency estimates from Africa
A meta-regression analysis of frontier efficiency estimates from AfricaA meta-regression analysis of frontier efficiency estimates from Africa
A meta-regression analysis of frontier efficiency estimates from Africa
 
Effect of nigerian macro economic and macro-environment related factors on a...
 Effect of nigerian macro economic and macro-environment related factors on a... Effect of nigerian macro economic and macro-environment related factors on a...
Effect of nigerian macro economic and macro-environment related factors on a...
 
8 kelechi igwe_86--90
8 kelechi igwe_86--908 kelechi igwe_86--90
8 kelechi igwe_86--90
 
Analyzing the economic benefit of fresh tomato production at the tono irrigat...
Analyzing the economic benefit of fresh tomato production at the tono irrigat...Analyzing the economic benefit of fresh tomato production at the tono irrigat...
Analyzing the economic benefit of fresh tomato production at the tono irrigat...
 
The efficiency of maize farming in malawi (tchale, 2007)
The efficiency of maize farming in malawi (tchale, 2007)The efficiency of maize farming in malawi (tchale, 2007)
The efficiency of maize farming in malawi (tchale, 2007)
 
C:\fakepath\the removal of agricultural subsidies and their effects on tomato...
C:\fakepath\the removal of agricultural subsidies and their effects on tomato...C:\fakepath\the removal of agricultural subsidies and their effects on tomato...
C:\fakepath\the removal of agricultural subsidies and their effects on tomato...
 
1 ijhaf aug-2017-3-long run analysis of the carrying
1 ijhaf aug-2017-3-long run analysis of the carrying1 ijhaf aug-2017-3-long run analysis of the carrying
1 ijhaf aug-2017-3-long run analysis of the carrying
 
1. 1 14
1. 1 141. 1 14
1. 1 14
 
3645754 content
3645754  content3645754  content
3645754 content
 
11.[1 10]technical efficiency in agriculture in ghana analyses of determining...
11.[1 10]technical efficiency in agriculture in ghana analyses of determining...11.[1 10]technical efficiency in agriculture in ghana analyses of determining...
11.[1 10]technical efficiency in agriculture in ghana analyses of determining...
 
Demand-led market opportunities for farmers in the high value product sector ...
Demand-led market opportunities for farmers in the high value product sector ...Demand-led market opportunities for farmers in the high value product sector ...
Demand-led market opportunities for farmers in the high value product sector ...
 
Supply Response of Haricot Bean: The Case of Boricha District, Southern Ethiopia
Supply Response of Haricot Bean: The Case of Boricha District, Southern EthiopiaSupply Response of Haricot Bean: The Case of Boricha District, Southern Ethiopia
Supply Response of Haricot Bean: The Case of Boricha District, Southern Ethiopia
 
Economic Environment and Performance of Food and Beverage Sub-Sector of a Dev...
Economic Environment and Performance of Food and Beverage Sub-Sector of a Dev...Economic Environment and Performance of Food and Beverage Sub-Sector of a Dev...
Economic Environment and Performance of Food and Beverage Sub-Sector of a Dev...
 
Cost-benefit-analysis of Africa RISING technologies in Tanzania
Cost-benefit-analysis of Africa RISING technologies in Tanzania Cost-benefit-analysis of Africa RISING technologies in Tanzania
Cost-benefit-analysis of Africa RISING technologies in Tanzania
 
Migration, labor supply, wages and agriculture
Migration, labor supply, wages and agricultureMigration, labor supply, wages and agriculture
Migration, labor supply, wages and agriculture
 
Bali-Singla2021_Article_EmergingTrendsInMachineLearnin.pdf
Bali-Singla2021_Article_EmergingTrendsInMachineLearnin.pdfBali-Singla2021_Article_EmergingTrendsInMachineLearnin.pdf
Bali-Singla2021_Article_EmergingTrendsInMachineLearnin.pdf
 
C0341923
C0341923C0341923
C0341923
 
Analysis of price volatility and implications for price
Analysis of price volatility and implications for priceAnalysis of price volatility and implications for price
Analysis of price volatility and implications for price
 
Sources of Inefficiency and Growth in Agricultual Output in Subsistence Agric...
Sources of Inefficiency and Growth in Agricultual Output in Subsistence Agric...Sources of Inefficiency and Growth in Agricultual Output in Subsistence Agric...
Sources of Inefficiency and Growth in Agricultual Output in Subsistence Agric...
 

Mehr von Saide OER Africa

Asp openly licensed stories for early reading in africa mar 2015 slideshare
Asp openly licensed stories for early reading in africa mar 2015 slideshareAsp openly licensed stories for early reading in africa mar 2015 slideshare
Asp openly licensed stories for early reading in africa mar 2015 slideshareSaide OER Africa
 
Quality Considerations in eLearning
Quality Considerations in eLearningQuality Considerations in eLearning
Quality Considerations in eLearningSaide OER Africa
 
African Storybook: The First 18 Months of the Project
African Storybook: The First 18 Months of the ProjectAfrican Storybook: The First 18 Months of the Project
African Storybook: The First 18 Months of the ProjectSaide OER Africa
 
Digital Storytelling for Multilingual Literacy Development: Implications for ...
Digital Storytelling for Multilingual Literacy Development: Implications for ...Digital Storytelling for Multilingual Literacy Development: Implications for ...
Digital Storytelling for Multilingual Literacy Development: Implications for ...Saide OER Africa
 
Integrating ICT in TVET for Effective Technology Enabled Learning
Integrating ICT in TVET for Effective Technology Enabled LearningIntegrating ICT in TVET for Effective Technology Enabled Learning
Integrating ICT in TVET for Effective Technology Enabled LearningSaide OER Africa
 
Higher Education Technology Outlook in Africa
Higher Education Technology Outlook in AfricaHigher Education Technology Outlook in Africa
Higher Education Technology Outlook in AfricaSaide OER Africa
 
eLearning or eKnowledge - What are we offering students?
eLearning or eKnowledge - What are we offering students?eLearning or eKnowledge - What are we offering students?
eLearning or eKnowledge - What are we offering students?Saide OER Africa
 
Understand school leadership and governance in the South African context (PDF)
Understand school leadership and governance in the South African context (PDF)Understand school leadership and governance in the South African context (PDF)
Understand school leadership and governance in the South African context (PDF)Saide OER Africa
 
Toolkit: Unit 8 - Developing a school-based care and support plan.
Toolkit: Unit 8 - Developing a school-based care and support plan.Toolkit: Unit 8 - Developing a school-based care and support plan.
Toolkit: Unit 8 - Developing a school-based care and support plan.Saide OER Africa
 
Toolkit: Unit 7 - Counselling support for vulnerable learners.
Toolkit: Unit 7 - Counselling support for vulnerable learners.Toolkit: Unit 7 - Counselling support for vulnerable learners.
Toolkit: Unit 7 - Counselling support for vulnerable learners.Saide OER Africa
 
Toolkit: Unit 6 - School-based aftercare.
Toolkit: Unit 6 - School-based aftercare.Toolkit: Unit 6 - School-based aftercare.
Toolkit: Unit 6 - School-based aftercare.Saide OER Africa
 
Toolkit: Unit 5 - Good nutrition for learning.
Toolkit: Unit 5 - Good nutrition for learning.Toolkit: Unit 5 - Good nutrition for learning.
Toolkit: Unit 5 - Good nutrition for learning.Saide OER Africa
 
Toolkit: Unit 3 - Care for vulnerable learners
Toolkit: Unit 3 - Care for vulnerable learnersToolkit: Unit 3 - Care for vulnerable learners
Toolkit: Unit 3 - Care for vulnerable learnersSaide OER Africa
 
Toolkit: Unit 2 - Schools as centres of care.
Toolkit: Unit 2 - Schools as centres of care.Toolkit: Unit 2 - Schools as centres of care.
Toolkit: Unit 2 - Schools as centres of care.Saide OER Africa
 
Toolkit: Unit 1 - How responsive are schools to the socio-economic challenges...
Toolkit: Unit 1 - How responsive are schools to the socio-economic challenges...Toolkit: Unit 1 - How responsive are schools to the socio-economic challenges...
Toolkit: Unit 1 - How responsive are schools to the socio-economic challenges...Saide OER Africa
 
Reading: Understanding Intrapersonal Characteristics (Word)
Reading: Understanding Intrapersonal Characteristics (Word)Reading: Understanding Intrapersonal Characteristics (Word)
Reading: Understanding Intrapersonal Characteristics (Word)Saide OER Africa
 
Reading: Understanding Intrapersonal Characteristics (pdf)
Reading: Understanding Intrapersonal Characteristics (pdf)Reading: Understanding Intrapersonal Characteristics (pdf)
Reading: Understanding Intrapersonal Characteristics (pdf)Saide OER Africa
 
Reading: Guidelines for Inclusive Learning Programmes (word)
Reading: Guidelines for Inclusive Learning Programmes (word)Reading: Guidelines for Inclusive Learning Programmes (word)
Reading: Guidelines for Inclusive Learning Programmes (word)Saide OER Africa
 
Reading: Guidelines for Inclusive Learning Programmes (pdf)
Reading: Guidelines for Inclusive Learning Programmes (pdf)Reading: Guidelines for Inclusive Learning Programmes (pdf)
Reading: Guidelines for Inclusive Learning Programmes (pdf)Saide OER Africa
 

Mehr von Saide OER Africa (20)

Asp openly licensed stories for early reading in africa mar 2015 slideshare
Asp openly licensed stories for early reading in africa mar 2015 slideshareAsp openly licensed stories for early reading in africa mar 2015 slideshare
Asp openly licensed stories for early reading in africa mar 2015 slideshare
 
Quality Considerations in eLearning
Quality Considerations in eLearningQuality Considerations in eLearning
Quality Considerations in eLearning
 
African Storybook: The First 18 Months of the Project
African Storybook: The First 18 Months of the ProjectAfrican Storybook: The First 18 Months of the Project
African Storybook: The First 18 Months of the Project
 
Digital Storytelling for Multilingual Literacy Development: Implications for ...
Digital Storytelling for Multilingual Literacy Development: Implications for ...Digital Storytelling for Multilingual Literacy Development: Implications for ...
Digital Storytelling for Multilingual Literacy Development: Implications for ...
 
Integrating ICT in TVET for Effective Technology Enabled Learning
Integrating ICT in TVET for Effective Technology Enabled LearningIntegrating ICT in TVET for Effective Technology Enabled Learning
Integrating ICT in TVET for Effective Technology Enabled Learning
 
Higher Education Technology Outlook in Africa
Higher Education Technology Outlook in AfricaHigher Education Technology Outlook in Africa
Higher Education Technology Outlook in Africa
 
eLearning or eKnowledge - What are we offering students?
eLearning or eKnowledge - What are we offering students?eLearning or eKnowledge - What are we offering students?
eLearning or eKnowledge - What are we offering students?
 
The Rise of MOOCs
The Rise of MOOCsThe Rise of MOOCs
The Rise of MOOCs
 
Understand school leadership and governance in the South African context (PDF)
Understand school leadership and governance in the South African context (PDF)Understand school leadership and governance in the South African context (PDF)
Understand school leadership and governance in the South African context (PDF)
 
Toolkit: Unit 8 - Developing a school-based care and support plan.
Toolkit: Unit 8 - Developing a school-based care and support plan.Toolkit: Unit 8 - Developing a school-based care and support plan.
Toolkit: Unit 8 - Developing a school-based care and support plan.
 
Toolkit: Unit 7 - Counselling support for vulnerable learners.
Toolkit: Unit 7 - Counselling support for vulnerable learners.Toolkit: Unit 7 - Counselling support for vulnerable learners.
Toolkit: Unit 7 - Counselling support for vulnerable learners.
 
Toolkit: Unit 6 - School-based aftercare.
Toolkit: Unit 6 - School-based aftercare.Toolkit: Unit 6 - School-based aftercare.
Toolkit: Unit 6 - School-based aftercare.
 
Toolkit: Unit 5 - Good nutrition for learning.
Toolkit: Unit 5 - Good nutrition for learning.Toolkit: Unit 5 - Good nutrition for learning.
Toolkit: Unit 5 - Good nutrition for learning.
 
Toolkit: Unit 3 - Care for vulnerable learners
Toolkit: Unit 3 - Care for vulnerable learnersToolkit: Unit 3 - Care for vulnerable learners
Toolkit: Unit 3 - Care for vulnerable learners
 
Toolkit: Unit 2 - Schools as centres of care.
Toolkit: Unit 2 - Schools as centres of care.Toolkit: Unit 2 - Schools as centres of care.
Toolkit: Unit 2 - Schools as centres of care.
 
Toolkit: Unit 1 - How responsive are schools to the socio-economic challenges...
Toolkit: Unit 1 - How responsive are schools to the socio-economic challenges...Toolkit: Unit 1 - How responsive are schools to the socio-economic challenges...
Toolkit: Unit 1 - How responsive are schools to the socio-economic challenges...
 
Reading: Understanding Intrapersonal Characteristics (Word)
Reading: Understanding Intrapersonal Characteristics (Word)Reading: Understanding Intrapersonal Characteristics (Word)
Reading: Understanding Intrapersonal Characteristics (Word)
 
Reading: Understanding Intrapersonal Characteristics (pdf)
Reading: Understanding Intrapersonal Characteristics (pdf)Reading: Understanding Intrapersonal Characteristics (pdf)
Reading: Understanding Intrapersonal Characteristics (pdf)
 
Reading: Guidelines for Inclusive Learning Programmes (word)
Reading: Guidelines for Inclusive Learning Programmes (word)Reading: Guidelines for Inclusive Learning Programmes (word)
Reading: Guidelines for Inclusive Learning Programmes (word)
 
Reading: Guidelines for Inclusive Learning Programmes (pdf)
Reading: Guidelines for Inclusive Learning Programmes (pdf)Reading: Guidelines for Inclusive Learning Programmes (pdf)
Reading: Guidelines for Inclusive Learning Programmes (pdf)
 

Kürzlich hochgeladen

Karra SKD Conference Presentation Revised.pptx
Karra SKD Conference Presentation Revised.pptxKarra SKD Conference Presentation Revised.pptx
Karra SKD Conference Presentation Revised.pptxAshokKarra1
 
What is Model Inheritance in Odoo 17 ERP
What is Model Inheritance in Odoo 17 ERPWhat is Model Inheritance in Odoo 17 ERP
What is Model Inheritance in Odoo 17 ERPCeline George
 
Grade 9 Quarter 4 Dll Grade 9 Quarter 4 DLL.pdf
Grade 9 Quarter 4 Dll Grade 9 Quarter 4 DLL.pdfGrade 9 Quarter 4 Dll Grade 9 Quarter 4 DLL.pdf
Grade 9 Quarter 4 Dll Grade 9 Quarter 4 DLL.pdfJemuel Francisco
 
Earth Day Presentation wow hello nice great
Earth Day Presentation wow hello nice greatEarth Day Presentation wow hello nice great
Earth Day Presentation wow hello nice greatYousafMalik24
 
Incoming and Outgoing Shipments in 3 STEPS Using Odoo 17
Incoming and Outgoing Shipments in 3 STEPS Using Odoo 17Incoming and Outgoing Shipments in 3 STEPS Using Odoo 17
Incoming and Outgoing Shipments in 3 STEPS Using Odoo 17Celine George
 
HỌC TỐT TIẾNG ANH 11 THEO CHƯƠNG TRÌNH GLOBAL SUCCESS ĐÁP ÁN CHI TIẾT - CẢ NĂ...
HỌC TỐT TIẾNG ANH 11 THEO CHƯƠNG TRÌNH GLOBAL SUCCESS ĐÁP ÁN CHI TIẾT - CẢ NĂ...HỌC TỐT TIẾNG ANH 11 THEO CHƯƠNG TRÌNH GLOBAL SUCCESS ĐÁP ÁN CHI TIẾT - CẢ NĂ...
HỌC TỐT TIẾNG ANH 11 THEO CHƯƠNG TRÌNH GLOBAL SUCCESS ĐÁP ÁN CHI TIẾT - CẢ NĂ...Nguyen Thanh Tu Collection
 
Judging the Relevance and worth of ideas part 2.pptx
Judging the Relevance  and worth of ideas part 2.pptxJudging the Relevance  and worth of ideas part 2.pptx
Judging the Relevance and worth of ideas part 2.pptxSherlyMaeNeri
 
Field Attribute Index Feature in Odoo 17
Field Attribute Index Feature in Odoo 17Field Attribute Index Feature in Odoo 17
Field Attribute Index Feature in Odoo 17Celine George
 
ECONOMIC CONTEXT - PAPER 1 Q3: NEWSPAPERS.pptx
ECONOMIC CONTEXT - PAPER 1 Q3: NEWSPAPERS.pptxECONOMIC CONTEXT - PAPER 1 Q3: NEWSPAPERS.pptx
ECONOMIC CONTEXT - PAPER 1 Q3: NEWSPAPERS.pptxiammrhaywood
 
USPS® Forced Meter Migration - How to Know if Your Postage Meter Will Soon be...
USPS® Forced Meter Migration - How to Know if Your Postage Meter Will Soon be...USPS® Forced Meter Migration - How to Know if Your Postage Meter Will Soon be...
USPS® Forced Meter Migration - How to Know if Your Postage Meter Will Soon be...Postal Advocate Inc.
 
MULTIDISCIPLINRY NATURE OF THE ENVIRONMENTAL STUDIES.pptx
MULTIDISCIPLINRY NATURE OF THE ENVIRONMENTAL STUDIES.pptxMULTIDISCIPLINRY NATURE OF THE ENVIRONMENTAL STUDIES.pptx
MULTIDISCIPLINRY NATURE OF THE ENVIRONMENTAL STUDIES.pptxAnupkumar Sharma
 
Procuring digital preservation CAN be quick and painless with our new dynamic...
Procuring digital preservation CAN be quick and painless with our new dynamic...Procuring digital preservation CAN be quick and painless with our new dynamic...
Procuring digital preservation CAN be quick and painless with our new dynamic...Jisc
 
Science 7 Quarter 4 Module 2: Natural Resources.pptx
Science 7 Quarter 4 Module 2: Natural Resources.pptxScience 7 Quarter 4 Module 2: Natural Resources.pptx
Science 7 Quarter 4 Module 2: Natural Resources.pptxMaryGraceBautista27
 
FILIPINO PSYCHology sikolohiyang pilipino
FILIPINO PSYCHology sikolohiyang pilipinoFILIPINO PSYCHology sikolohiyang pilipino
FILIPINO PSYCHology sikolohiyang pilipinojohnmickonozaleda
 
Global Lehigh Strategic Initiatives (without descriptions)
Global Lehigh Strategic Initiatives (without descriptions)Global Lehigh Strategic Initiatives (without descriptions)
Global Lehigh Strategic Initiatives (without descriptions)cama23
 
AMERICAN LANGUAGE HUB_Level2_Student'sBook_Answerkey.pdf
AMERICAN LANGUAGE HUB_Level2_Student'sBook_Answerkey.pdfAMERICAN LANGUAGE HUB_Level2_Student'sBook_Answerkey.pdf
AMERICAN LANGUAGE HUB_Level2_Student'sBook_Answerkey.pdfphamnguyenenglishnb
 
How to do quick user assign in kanban in Odoo 17 ERP
How to do quick user assign in kanban in Odoo 17 ERPHow to do quick user assign in kanban in Odoo 17 ERP
How to do quick user assign in kanban in Odoo 17 ERPCeline George
 
call girls in Kamla Market (DELHI) 🔝 >༒9953330565🔝 genuine Escort Service 🔝✔️✔️
call girls in Kamla Market (DELHI) 🔝 >༒9953330565🔝 genuine Escort Service 🔝✔️✔️call girls in Kamla Market (DELHI) 🔝 >༒9953330565🔝 genuine Escort Service 🔝✔️✔️
call girls in Kamla Market (DELHI) 🔝 >༒9953330565🔝 genuine Escort Service 🔝✔️✔️9953056974 Low Rate Call Girls In Saket, Delhi NCR
 

Kürzlich hochgeladen (20)

Karra SKD Conference Presentation Revised.pptx
Karra SKD Conference Presentation Revised.pptxKarra SKD Conference Presentation Revised.pptx
Karra SKD Conference Presentation Revised.pptx
 
What is Model Inheritance in Odoo 17 ERP
What is Model Inheritance in Odoo 17 ERPWhat is Model Inheritance in Odoo 17 ERP
What is Model Inheritance in Odoo 17 ERP
 
Grade 9 Quarter 4 Dll Grade 9 Quarter 4 DLL.pdf
Grade 9 Quarter 4 Dll Grade 9 Quarter 4 DLL.pdfGrade 9 Quarter 4 Dll Grade 9 Quarter 4 DLL.pdf
Grade 9 Quarter 4 Dll Grade 9 Quarter 4 DLL.pdf
 
Earth Day Presentation wow hello nice great
Earth Day Presentation wow hello nice greatEarth Day Presentation wow hello nice great
Earth Day Presentation wow hello nice great
 
Incoming and Outgoing Shipments in 3 STEPS Using Odoo 17
Incoming and Outgoing Shipments in 3 STEPS Using Odoo 17Incoming and Outgoing Shipments in 3 STEPS Using Odoo 17
Incoming and Outgoing Shipments in 3 STEPS Using Odoo 17
 
HỌC TỐT TIẾNG ANH 11 THEO CHƯƠNG TRÌNH GLOBAL SUCCESS ĐÁP ÁN CHI TIẾT - CẢ NĂ...
HỌC TỐT TIẾNG ANH 11 THEO CHƯƠNG TRÌNH GLOBAL SUCCESS ĐÁP ÁN CHI TIẾT - CẢ NĂ...HỌC TỐT TIẾNG ANH 11 THEO CHƯƠNG TRÌNH GLOBAL SUCCESS ĐÁP ÁN CHI TIẾT - CẢ NĂ...
HỌC TỐT TIẾNG ANH 11 THEO CHƯƠNG TRÌNH GLOBAL SUCCESS ĐÁP ÁN CHI TIẾT - CẢ NĂ...
 
Model Call Girl in Tilak Nagar Delhi reach out to us at 🔝9953056974🔝
Model Call Girl in Tilak Nagar Delhi reach out to us at 🔝9953056974🔝Model Call Girl in Tilak Nagar Delhi reach out to us at 🔝9953056974🔝
Model Call Girl in Tilak Nagar Delhi reach out to us at 🔝9953056974🔝
 
Judging the Relevance and worth of ideas part 2.pptx
Judging the Relevance  and worth of ideas part 2.pptxJudging the Relevance  and worth of ideas part 2.pptx
Judging the Relevance and worth of ideas part 2.pptx
 
Field Attribute Index Feature in Odoo 17
Field Attribute Index Feature in Odoo 17Field Attribute Index Feature in Odoo 17
Field Attribute Index Feature in Odoo 17
 
Raw materials used in Herbal Cosmetics.pptx
Raw materials used in Herbal Cosmetics.pptxRaw materials used in Herbal Cosmetics.pptx
Raw materials used in Herbal Cosmetics.pptx
 
ECONOMIC CONTEXT - PAPER 1 Q3: NEWSPAPERS.pptx
ECONOMIC CONTEXT - PAPER 1 Q3: NEWSPAPERS.pptxECONOMIC CONTEXT - PAPER 1 Q3: NEWSPAPERS.pptx
ECONOMIC CONTEXT - PAPER 1 Q3: NEWSPAPERS.pptx
 
USPS® Forced Meter Migration - How to Know if Your Postage Meter Will Soon be...
USPS® Forced Meter Migration - How to Know if Your Postage Meter Will Soon be...USPS® Forced Meter Migration - How to Know if Your Postage Meter Will Soon be...
USPS® Forced Meter Migration - How to Know if Your Postage Meter Will Soon be...
 
MULTIDISCIPLINRY NATURE OF THE ENVIRONMENTAL STUDIES.pptx
MULTIDISCIPLINRY NATURE OF THE ENVIRONMENTAL STUDIES.pptxMULTIDISCIPLINRY NATURE OF THE ENVIRONMENTAL STUDIES.pptx
MULTIDISCIPLINRY NATURE OF THE ENVIRONMENTAL STUDIES.pptx
 
Procuring digital preservation CAN be quick and painless with our new dynamic...
Procuring digital preservation CAN be quick and painless with our new dynamic...Procuring digital preservation CAN be quick and painless with our new dynamic...
Procuring digital preservation CAN be quick and painless with our new dynamic...
 
Science 7 Quarter 4 Module 2: Natural Resources.pptx
Science 7 Quarter 4 Module 2: Natural Resources.pptxScience 7 Quarter 4 Module 2: Natural Resources.pptx
Science 7 Quarter 4 Module 2: Natural Resources.pptx
 
FILIPINO PSYCHology sikolohiyang pilipino
FILIPINO PSYCHology sikolohiyang pilipinoFILIPINO PSYCHology sikolohiyang pilipino
FILIPINO PSYCHology sikolohiyang pilipino
 
Global Lehigh Strategic Initiatives (without descriptions)
Global Lehigh Strategic Initiatives (without descriptions)Global Lehigh Strategic Initiatives (without descriptions)
Global Lehigh Strategic Initiatives (without descriptions)
 
AMERICAN LANGUAGE HUB_Level2_Student'sBook_Answerkey.pdf
AMERICAN LANGUAGE HUB_Level2_Student'sBook_Answerkey.pdfAMERICAN LANGUAGE HUB_Level2_Student'sBook_Answerkey.pdf
AMERICAN LANGUAGE HUB_Level2_Student'sBook_Answerkey.pdf
 
How to do quick user assign in kanban in Odoo 17 ERP
How to do quick user assign in kanban in Odoo 17 ERPHow to do quick user assign in kanban in Odoo 17 ERP
How to do quick user assign in kanban in Odoo 17 ERP
 
call girls in Kamla Market (DELHI) 🔝 >༒9953330565🔝 genuine Escort Service 🔝✔️✔️
call girls in Kamla Market (DELHI) 🔝 >༒9953330565🔝 genuine Escort Service 🔝✔️✔️call girls in Kamla Market (DELHI) 🔝 >༒9953330565🔝 genuine Escort Service 🔝✔️✔️
call girls in Kamla Market (DELHI) 🔝 >༒9953330565🔝 genuine Escort Service 🔝✔️✔️
 

Farmer's Agribusiness Training Course: Module 1 Lesson 3 Supplementary Reading. Trends in Regional Agricultural Productivity in Kenya

  • 1. KENYA AGRICULTURAL MARKETING AND POLICY ANALYSIS PROJECT TEGEMEO INSTITUTE OF AGRICULTURAL POLICY AND DEVELOPMENT/ EGERTON UNIVERSITY KENYA AGRICULTURAL RESEARCH INSTITUTE MICHIGAN STATE UNIVERSITY TRENDS IN REGIONAL AGRICULTURAL PRODUCTIVITY IN KENYA by James K. Nyoro and T.S. Jayne Support for this study was provided under the Kenya Agricultural Marketing and Policy Analysis Project (KAMPAP), supported by the United States Agency for International Development/Kenya. James Nyoro is Research Scholar, Tegemeo Institute, Egerton University. T.S. Jayne is Visiting Associate Professor at Michigan State University.
  • 2. 1. INTRODUCTION Agriculture in Kenya remains a dominant sector in the economy (PAM 1995). Agricultures contribution to rural employment, foreign exchange earning and rural incomes are so important that any broad-based improvement in rural living standards will almost certainly require substantial productivity growth in agriculture. Agriculture in Kenya has undergone major changes over the past decade since the implementation of structural adjustment and sectoral reform. The effects of these policies and programs on agricultural productivity continue to be debated. Much donor-supported analysis presents evidence of a broad economic turnaround in Africa, and finds support for increased agricultural productivity growth, in contrast to the gloomier picture commonly painted about stagnating African agriculture (e.g., Block 1994; Sahn and Sarris 1991; USAID 1993; World Bank 1994). Macro-economic and agricultural sectoral reforms are identified as major factors explaining the rise in productivity growth. By contrast, analyses supported by UNICEF, FAO, and other donor agencies have strongly questioned the effects of structural adjustment and/or food sector reform on agricultural productivity growth and household food security (see, for example, Cornia, Jolly, and Stewart 1987; Mosley 1994; Cheru 1999). Understanding the national and regionally-disaggregated movements in crop production and input use over time is a critical component step in clarifying the discussion, identifying which policies have worked and which havent, and formulating a empirically- based agricultural development strategy for the future. The objectives of this paper are threefold: (1) to assess the direction and magnitude of changes in agricultural productivity in Kenya in the last 25 years for five of the most important agricultural provinces in Kenya, with particular focus on the period since the initiation of agricultural policy adjustment in the 1990s; (2) to identify the major factors affecting changes in crop productivity; and (3) to identify cost-effective strategies likely to promote future agricultural intensification and productivity growth in Kenyas crop sector in the post-reform period. A regionally disaggregated approach is taken in order to identify variations in the patterns of growth across high-potential and low-potential areas and develop possible implications for policy about where the focus of future efforts should be. Section 2 discusses the data and methods used in the analysis. Section 3 assesses the broad trends in the value of agricultural output per hectare and per agricultural laborer. Section 4 disaggregates these trends by province to compare the trends not only by the geographical location of the regions but also by crop mix. We also examine how policy changes in the agricultural sector may have affected patterns in input use on various crops. Lastly, Section 5 discusses the conclusions, policy implications, and outstanding knowledge gaps for future research to support policy makers efforts to raise agricultural productivity in Kenya. 2. METHODOLOGY AND DATA SOURCES 2.1. Methodology A conventional agricultural productivity index is a measure of output divided by a measure of inputs. Total factor productivity (TFP) is defined as the ratio of value of output over the value of all inputs used. However, TFP measures are difficult to construct in the absence of 2
  • 3. data on prices and costs of key inputs. An alternative approach is partial factor productivity (PFP). The main indicators in this analysis are partial land and labor productivity. The PFP indicators are calculated as Q/ X i , where Q is the value of output and X i is physical factor input. The main weakness of partial factor productivity indices is that they do not account for all the inputs used in production/marketing system. Discussions about single factor productivity can be misleading if interpreted as total factor productivity. On the input side, improvements in labor and land productivity are usually due to changes in other inputs. New technology, infrastructure, extension, supplies of other inputs (water, for example) are not costless and need to be taken into account in assessing total factor productivity.1 On the output side, the mix of farm and non-farm activities undertaken by the rural population may have shifted over time. For example, if a larger percentage of rural households time has gone into non- farm activities over time, the analysis presented in the figures will understate increases (or overstate decreases) in agricultural labor productivity.2 Nonetheless, the measures of labor and land productivity can indicate important changes in agricultural systems performance, especially if kept in context of the changes in the use of other factors. Only five out of the eight provinces were analyzed in the analysis, leaving out Nairobi, North Eastern and Coast provinces due to data limitations. The provinces included in the analysis thus are Central, Eastern, Rift Valley, Western and Nyanza. In each province, the key commodities were modeled (including maize, wheat, sorghum, sugarcane, coffee, tea, pyrethrum, tomatoes and French beans). Lack of reliable data required other crops to be excluded from the analysis, and for this reason, there is variation across provinces in the extent to which all relevant crops are included. 2.2. Data Sources The main data source for this study was the Ministry of Agriculture Livestock Development and Marketing (MOALDM), the Planning Division and the Central Bureau of Statistic of the Ministry of Planning and National Development and several publications. Initial data was collected from the provincial and district agricultural offices by Tegemeo Institute and its predecessor the Policy Analysis Matrix Project on all agricultural commodities in each district. Districts level Farm Management Reports, Development Plans and district annual reports also were referred to. Data on specific crops like coffee, tea, pyrethrum sugar and rice was collected directly from their respective regulatory and marketing bodies including the Coffee Board of Kenya, Tea Board of Kenya, Pyrethrum Board, Kenya Sugar Authority and the National Irrigation Board. The district data was compiled to the provincial level and was compared to the provincial data already compiled at the MOALDM headquarters. 1 Unfortunately, data is seldom available to measure total factor productivity in Africa (see Thirtle et al. 1993 for an exception), and there is also considerable disagreement about how TFP should be measured. 2 A more accurate indicator of labor productivity would have been value of crop output per unit of agricultural laborer, but time series data on agricultural labor force was unavailable. Use of rural population data will give similar trend results to those using agricultural labor data as long as the proportion of rural population engaged in agriculture was relatively constant over the sample period. Productivity trends will be biased upward (downward) if the share of the rural population in agriculture increased (decreased) over the sample period. 3
  • 4. The production data for the entire period (1970-95) was converted to the value of production by multiplying the production by average of the last 5 years national and regional producer prices (1991-1995). These average prices were used to overcome the problem of introducing price based fluctuations into the data that have little to do with changes in physical input- output relationships. Three year centered moving averages were constructed from both the labor and land productivity indicators to smooth out the effects of random variation such as that caused by abrupt weather changes. The result were then averaged in five year segments from 1970-74 to 1990-95. This approach roughly follows the methods in Block (1994). The land and labor units are physical units based on the MOALD M data. Land is the area cultivated and thus includes sections planted though not yet in production. The labor variable is the population in rural areas as reported in the 1969, 1979 and 1989 national population census. The quality of official data from the MOALDM is widely criticized as inaccurate and unreliable. There is however no alternative national and regional time series production and area data available for the period and commodities covered. For the purpose of this analysis, therefore, the MOALDM data was used, realizing that the results are to be considered rough indicators of trends. What is important in this analysis is the direction of change in the partial productivity measures over time rather than the levels of the variables themselves. The challenge in Kenya today is how to invest in good quality data collection to ensure that the future analysis of the agricultural sector is based on more reliable and accurate data. 3. RESULTS 3.1. Productivity and Area Trends Relative growth rates in area for some of the key agricultural commodities for the period 1970 to 1995 are shown in Table 1. Most crops have expanded in area in the last 25 years. But the rate of area expansion for most of the crops was higher between 1970 and 1985 than it was between 1985 and 1995. Coffee and sugar area expanded most between 1980 and 1985 because of better producer prices and in response to the coffee boom of 1977-79. Wheat area declined in the 1970-80 period following the change the sub-division of large- scale farms to small-scale farmers who substituted from wheat into maize and dairy (Hassan, Mwangi, and Karanja 1993). The substantial growth in wheat area in the period 1980-85 reflects substantial expansion of wheat into the low potential areas of Narok, Trans Mara and Samburu. Pyrethrum area fell drastically in the period 1980-90 period following the long delays in payments to farmers in 1981 and subsequent substitution to other crops. Growth rates in cropped area since 1990 reflect a shift out of maize and coffee area and an expansion in horticultural area such as the tomatoes and French beans. Area expansion of most crops was driven by explicit government support in the 1970s and 1980s to encourage small-scale producers to adopt and expand the production of selected export and food crops. The government thus expanded crop buying and processing capacity to service new areas in production, provided credit and extension support to producers, and maintained a relatively extensive network of collection points and depots for encouraging smallholder marketing of cereals. 4
  • 5. Area expansion has slowed considerably since 1990. No crop has registered a higher rate of growth in the 1990s than in the 1980s except french beans (and marginally pyrethrum). The limited expansion that has occurred since 1990 has been generally toward the low potential arid and semi arid areas because of population pressure in the high potential and the resulting shortage of additional fertile land. This implies that future production growth in Kenya will rely on increasing crop intensification, i.e., raising the value of agricultural production through more intensive use of productivity enhancing inputs and/or shifting to higher-valued crops. Table 1. Relative Rates of Area Expansion Average (% Growth per Year) 1970-80 1980-85 1985-90 1990-95 Coffee 4.3 8.2 4.1 0.6 Tea 6.5 3.4 1.5 1.2 Sugar 3.7 10.9 2.3 1.6 Pyrethrum 2.0 0.4 -1.1 0.4 Maize 2.3 0.2 2.1 0.4 Wheat -3.1 0.9 5.0 1.7 Sorghum 0.5 5.8 3.2 3.0 Tomatoes 1.4 1.7 3.3 2.5 French Beans 0.7 3.3 3.1 4.2 3.2. Trends in Rates of Yields The relative growth rates in the physical yields of the major crops over various periods are summarized in Table 2. The most alarming trend is that yields are actually declining for most of the crops considered during the 1990-95 period. This is especially true of the grain crops and sugarcane. The negative growth in yields does not appear to be driven by weather conditions, since the 1990-95 period has not been subjected to more frequent drought than other periods. The decline in yields for the major cereal crops has been associated with a stagnation in fertilizer use (both DAP and CAN), a major contraction in agricultural credit disbursed to smallholder farmers, and a decline in both the quantity and quality of hybrid maize seed used in production. The reasons behind these trends in input use are interrelated. First, AFC credit for grain crops has been substantially reduced in real terms, and this contraction has not been offset by any notable increase in private lending to smallholders. It appears to be the case that procurement of inputs for use on grain crops (such as fertilizer and hybrid seed) is increasingly self-financed by smallholders, and that liquidity constraints may constrain demand for key productivity-enhancing inputs. Simultaneously, fertilizer prices have risen in recent years, and DAP prices in Kenyas western regions are among the highest in the world (1,400 to 1,500 Ksh per bag in 1997, which translates to roughly $450-$500 per ton). Problems with quality control in improved seed generation and marketing have discouraged farmers in some areas from purchasing hybrid maize seed, and higher fertilizer prices impede the profitability of its use, which in turn reduces the profitability of using even high-quality fertilizer-responsive seed. In addition to the cereals, coffee and sugar have also recorded negative growth rates in yields since 1990. Ironically, these are the same crops that recorded high growth in yields during the 1970-80 period. French beans and tomatoes have however maintained their growth in yields. 5
  • 6. Table 2. Relative Rates of Physical Yields Growth (% Growth per Year) 1970-80 1980-85 1985-90 1990-95 Coffee Tea 1.7 2.1 7.8 2.0 Sugar 0.6 1.2 (1.4) (3.6) Pyrethrum 1.6 0.9 (0.3) 1.4 Maize 5.7 3.5 3.0 (2.2) Wheat 0.4 4.2 1.0 (3.3) Sorghum 2.8 2.4 4.8 (1.1) Tomatoes 2.5 3.1 5.3 6.9 French Beans 4.2 2.7 4.3 3.7 The rapid growth in maize yields during the 1970-80 period was as a result of the introduction and subsequent adoption of the high yielding hybrid maize varieties and the general government policy then to support extension service. The decline in coffee yields was caused by drought, poor producer incentives due to delays in coffee payments and high processing costs. The decline accelerated after 1990 despite the various policy reform in the production, processing and marketing of coffee. 3.3. Trends in Crop Production Rates of growth of crop production for some of the major selected crops is shown in Table 3. Production, just like area and yield, grew at a faster rate during the 1970-80 period than during the 1980-90 period. The growth rate in production has actually been negative in the period 1990-95 except for tea, pyrethrum, tomatoes, French Beans and sorghum. Coffee, maize, wheat and sugar have had the largest decline. The decline in wheat production, as stated earlier, is partly attributed to the change in the crop production structure from large- scale to small-scale production systems. Lack of huge declines in the value of production during the 1980-85 period indicates that despite the decline in yields as a result of the drought during this period, prices to producers continued to be favorable. 6
  • 7. Table 3. Relative Rates of Growth in Crop Production (% Growth per Annum) 1970-80 1980-85 1985-90 1990-95 Coffee 6.3 4.8 3.1 -4.4 Tea 8.2 5.5 9.3 3.2 Sugar 4.3 12.1 0.9 -2 Pyrethrum 3.6 1.3 -1.4 1.8 Maize 8 3.7 5.1 -1.8 Wheat -2.7 5.1 6 -1.6 Sorghum 3.3 8.2 8 1.9 Tomatoes 3.9 4.8 8.6 9.4 French Beans 4.9 6 7.4 7.9 The decline in the value of coffee, maize, and wheat output in 1990-95 could be attributed to the poor producer incentives due prevailing low prices despite the market reforms implemented on these commodities. Maize and wheat experienced profit squeeze when the fertilizer prices were liberalized in 1991 but maize and wheat marketing continued to be government controlled. Maize and wheat production costs grew when revenues were declining. This was also exacerbated by the reversals in the maize market liberalization process, which made it difficult for the private sector to invest in maize marketing activities. In coffee, production continued to decline despite the continued high coffee prices at the world market and the partial liberalization of coffee marketing. The liberalization of coffee marketing has been incomplete and is concentrated at the apex marketing and milling level. Little attention has been given to the restructuring of the coffee cooperatives and factories. These institutions are inefficient in coffee processing and are characterized by poor financial management so, coffee farmers continue to receive low payments. They also lack sufficient credit. Only tea and tomatoes have continued to maintain high rates of growth in the value of production. 3.4. Trends in Rural Population Trends in the rural population have followed closely the growth rates of the total population. The rural population grew at average rates of about 4% per annum between 1970-80 that have declined slightly to about 3% per annum in the 1990s. Except in Rift valley province, the rural population grew at a lower rate after the 1970-79 period. Rift valley, Eastern and Western provinces have the highest growth rate in rural population as shown in Table 4. Table 4. Trends in Rural Labor (% Growth per Annum) 1970-79 1980-85 1985-90 1990-95 Central 4.6 4.1 3.4 3.3 Eastern 4.5 4.7 4.1 3.8 Rift valley 5.0 6.2 5.6 4.9 Western 4.0 5.3 4.6 3.7 Nyanza 3.1 3.6 3.9 3.2 7
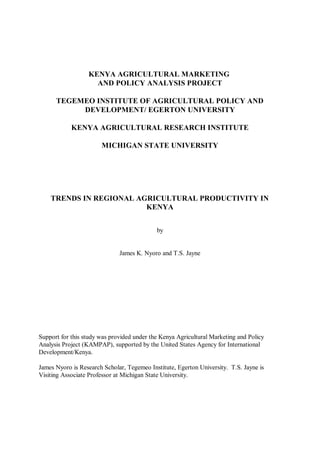
  • 8. 3.5. National Land and Labor Productivity The graphical representation of land and labor productivity through time follow Hayami and Ruttan (1985) and more recently Block (1994). The value of total agricultural production is developed as a product of production and the average producer price for each year. The total value of each crop was summed across all crops to get the total value of production for the whole sector and for each region. Land productivity, measured in Figure 1 on the y axis, is defined as the inflation-adjusted value of crop output per hectare. Labor productivity, measured in Figure 1 on the x axis, is defined as the inflation-adjusted value of crop output per rural person. Three-year centered moving averages were constructed from both series to smooth out the effects of random variations such as weather, and then averaged in five-year time periods, as shown in Figure 1. Interpretation is as follows: A movement in the coordinates over time from the lower-left to the upper-right portion of the figures represents increases in both land and labor productivity. Movement from the upper-right to lower-left parts of the figure represents a decline in both productivity measures. Shifts from the lower right to upper left would indicate a decline in labor productivity but an increase in land productivity. Such a case could arise if, for example, the value of crop output per hectare were rising over time due to either yield gains or shifts to higher-valued crops, but under conditions of a rapidly growing agricultural labor force. Note that in these figures, increases in these measures of partial productivity can occur from either shifts in crop mix (e.g., from millet to higher-valued cotton) or from increases in crop output per unit of input, or both. Figure 1 shows the path taken by the Kenyan agriculture from the period 1970 to 1995. Land productivity has stagnated at around Ksh 3,000 1991-95 constant prices. It increased slightly between 1970-74 and 1974-79, then declined in the following period, improved slightly but has since 1990-95 declined by about 23 percent of the 1985-90 level. Land Productivity increased initially by about 12 percent between 1970-74 and 1974-79 period. It then declined slightly and recovered after the 1980-85. Land productivity then declined by about 12 percent between 1985-90. The decline in land and labor productivity in 1980-85 period could be attributed to the two droughts that occurred during that period. Labor productivity has generally stagnated because the rural labor force has grown faster than the value of agricultural production per hectare. The increase in land productivity between 1970 and 1980 was in response to the adoption of high yielding varieties of maize and increased use of fertilizers and other yields enhancing inputs as shown in Table 5. A large proportion of smallholders benefitted from the expansion of state marketing infrastructure and transport subsidies inherent in the state marketing boards pan-territorial pricing structure. These pricing and market support policies clearly encouraged the adoption of newly available hybrid maize seeds and stimulated the growth in smallholder grain area and yields during the 1970s. However, this state-led model of service provision to smallholder farmers has proven politically and economically unsustainable. Evidence in some areas indicates that the production growth was achieved at a cost greater than the value of the output. While there is some opinion that the cutbacks in state transfers to smallholder grain producers have gone too far, there are rarely concrete 8
  • 9. proposals for who should be taxed to pay for the recurrent costs of these transfers (Jayne and Jones 1997).3 Figure 1. Land and Labor Productivity Ratios for the Period 1970-1995 Trends in Land and Labor Productivity 1985-90 52,000 51,000 50,000 Land Productivity (Ksh/Ha) Y/A 1975-80 49,000 48,000 1980-85 47,000 46,000 45,000 1990-95 44,000 1970-1974 43,000 2,200 2,400 2,600 2,800 3,000 3,200 Labor Productivity (Ksh/Rural Population) Y/L Table 5. Quantities of Seed and Fertilizer Used in Maize Maize Hybrid Purchased Fertilizer Total Credit AFC Credit on Maize Kgs ‘000 Tons Million Ksh Million Ksh 1970-74 7,494 141 2,087 877 1975-79 11,054 124 1,778 747 1980-84 14,788 139 2,183 917 1985-89 20,486 223 1,057 444 1990-95 19,272 245 371 157 3 While data on the sources of treasury revenue are unavailable for these specific countries, an interesting study by Gersovitz and Paxson (1996) shows that the revenue base of most African governments is narrow, depending primarily on taxation of imports and exports. The production and income foregone resulting from taxation of other sectors to transfer resources to grain producers is seldom accounted for in assessments of the benefits of state-led growth strategies. 9
  • 10. During this period use of hybrid maize seed increased by about 160 percent. Fertilizer use increased by about 50 percent. The government also supported producers through the provision of extension service and credit to farmers supported the increases in yields. Seasonal credit including that in the Guaranteed Minimum Returns Scheme from Agricultural Finance Corporation increased by more than 5 times between 1970 and 1980. After 1980 due to high population densities in the high-potential areas, crops expanded to low and marginal areas. However, to a large extent, the production technologies adopted were borrowed from the medium and high potential areas and are tend to be less suitable. Though the rate of adoption of hybrid maize seeds remained high, there is a widespread belief that the quality of maize and wheat seed has declined. Use of maize hybrid seeds dropped by 6 percent between 1990 and 1995. Quantities of DAP and CAN fertilizers used in maize production have also declined. Yields thus have declined. The seasonal credit from AFC for maize and wheat production also have declined and became unreliable. The drop in land productivity could also be attributed to the poor performance of government support services in extension. These results are consistent with the earlier findings (Block 1992) that the living standards of agricultural workers have not only stagnated in the past 20 years but that it has declined over the last 5 years. Unless off-farm income per person has risen to compensate for this decline, the welfare of the rural population is likely to be lower today than in the previous several decades. The decline in the value of agricultural production per hectare also implies the slackening in the rate of the economic growth due the importance attached to agriculture in the economy. 4. REGIONAL LAND AND LABOR PRODUCTIVITY Level and growth in land and labor productivity is influenced by the crop mixes in each region. Table 6 shows the relative importance of crops in each region. In Central Provinces, coffee, tea and horticulture dominate the value of agricultural production. Maize and other minor crops thus are less important. In Eastern, maize production is as important as coffee production is. Horticulture is also a major enterprise. The crops in the rift valley province are dominated production of maize and wheat. Coffee and tea are less important crops. Maize and sugar are the most important crops in Western and Nyanza provinces. Horticulture, coffee and tea are of secondary importance. 10
  • 11. Table 6. Crops Contribution to the Regional Total Value of Production (%) Central Eastern Rift Valley Western Nyanza Coffee 52 36 2 3 6 Tea 11 6 8 1 1 Maize 9 36 62 53 49 Wheat 1 1 14 Horticulture 24 16 10 2 4 Pyrethrum 2 3 Sugar - 36 28 Others 3 5 2 3 9 100 100 100 100 The relative growth in the total value of agricultural production by regions is shown in Figure 2. The value of agricultural production grew in all regions until 1990-95 after which it then declined. Central Kenya has the highest total value of production because of the dominance of the production of high-valued crops. The rapid increase in the value of agricultural production in central was as a result of the shift towards high value crops such as tomatoes, French beans and other horticultural crops (floriculture was not included in this analysis). Rift valley and Eastern Province have also high value of agricultural production because despite the dominance of maize and wheat which are lower value crops, the province agriculture is boosted by the production of some coffee, tea and horticulture. The value of agricultural production has however stagnated in Western and Nyanza mainly because of the poor performance of maize and sugar. 4.1. Regional Partial Productivity Ratios The partial productivity ratios for each province are shown in Figures 3 to 6. In Central Province (Figure 3), labor productivity is high at Ksh 6,341 in the 1990-95 constant average prices. However, labor productivity has declined and only increased substantially by about 13 percent between 1985 and 1990. It declined between 1990 and 1995. There were more rapid gains in land productivity, which increased by about 27 percent between 1970-75 and 1974- 79. Land productivity has also declined after 1990-1995 period. Labor productivity has increased less rapidly in Central Province because of the high growth in the rural population. 11
  • 12. Figure 2. Trends in the Total Value of Production by Provinces 30,000 Value of Total Production in Millions of Ksh 25,000 20,000 15,000 10,000 5,000 CENTRAL EASTERN - RIFT VALLEY 1970-74 1975-79 1980-84 1985-89 1990-95 WESTERN Period NYANZA The growth in land productivity in Central between 1970 and 1980 could be attributed to the high adoption of fertilizers and maize varieties. Also, because of the good blend of crop mixes and the shift to the high value horticultural crops the land and labor productivity increased. The poor performance in coffee, which contributes about 52% of the value of production in this area, has caused a decline in the land and labor productivity during 1990- 95. 12
  • 13. Figure 3. Trends in the Total Value of Production by Provinces Land and Labor Productivity For Central Province 60000 58000 Land Productivity (Ksh per Hectare) Y/A 56000 54000 1980-85 1974-79 52000 1985-90 50000 48000 1990-95 46000 44000 42000 1970-74 40000 6000 6500 7000 7500 8000 Labor Productivity (Ksh per Rural Person) Y/A In Eastern Province (Figure 4), labor productivity is low at Ksh 1,585 per rural person. It more than doubled between 1970-74 and 1974-75 but has declined after 1990. But land productivity has decreased after the initial increase between 1974-75 and 1975-79. By 1990- 95, for example land productivity was lower than it was in the 1975-80 period thus again depicting the deteriorating state of the welfare of the rural population. 13
  • 14. Figure 4. Land and Labor Productivity Ratios for Eastern Province Land and Labor Productivity for Eastern Province 38,000 1985-90 Land Productivity (Ksh per Hectare) Y/A 33,000 1980-85 1990-95 1974-79 28,000 1970-74 23,000 18,000 500 1,500 2,500 3,500 4,500 Labor Production (Ksh per Rural Person) Y/L In the Rift Valley province (Figure 5), labor productivity has stagnated at Ksh 1000 per rural person. Between 1970-75 and 1974-79, the productivity increased slightly after which it has declined to the 1970-74 levels. Labor productivity has declined in the 1990-95 period. Land productivity in the Rift Valley province increased by 26 percent between 1970-74 and 1974- 79 period. It stagnated and then declined by 11 percent after 1990. 14
  • 15. Figure 5. Land and Labor Productivity Ratios For Rift Valley Province Land and Labor Productivity for Rift Valley 49000 Land Productivity (Ksh per Hectare) Y/A 1985-90 1974-79 47000 1980-85 45000 43000 1990-95 41000 39000 1970-74 37000 35000 900 950 1000 1050 1100 1150 1200 1250 Series1 Labor Productvity (Ksh per Rural Person) Y/L The increase in land and labor productivity in this province is attributed to the adoption of the high yielding maize and wheat varieties around the 70s and increased use of fertilizers during that period. The decline during the 1990-95 period is attributed to the reduction in use of fertilizers and other inputs following the profit squeeze caused by the reduced maize and wheat production incentives during the liberalization period. Maize prices in selected Rift Valley markets (as well as most of Kenya) have declined roughly 25 percent in real inflation- adjusted terms between the 1985-92 period and the 1993-98 period. Land and productivity for Western Province (Figure 6) increased slightly between 1970-74 period after it declined and has stagnated for the rest of the time until 1990-95 when it declined by a further 9 percent. Land productivity also increased initially by 34 percent between 1970-74 and 1974-79 period. It then declined following the droughts of the 1980s. Land productivity in Western Province has after recovering slightly in 1985-90 has declined by about 15 percent after 1990. Land productivity has increased more rapidly than the labor productivity because rural population in western province grew faster than the land productivity. Poor maize prices and mismanagement of sugar factories have resulted in the decline in production and the subsequent fall in the labor and land productivity. 15
  • 16. Figure 6. Land and Labor Productivity Ratios for Western Province Land and Labor Productivity for Western Province 45000 43000 1985-90 Land Productvity (Ksh per Hectare Y/A 41000 39000 1974-79 37000 1980-85 35000 1990-95 33000 31000 29000 1970-74 27000 25000 2700 2800 2900 3000 3100 3200 3300 3400 3500 Series1 Labor Productivity (Ksh per Rural Person) Y.L In Nyanza Province (Figure 7) was initially higher than that in western province about Ksh 2,000 per rural population. After increasingly slightly between 1970-74 and 1974-79 period, labor productivity in Nyanza decreased by 15 percent between 1974-79 and 1979-80 and by 15 percent between 1985-90 and 1990-95 period. Labor productivity in 1990-95, was only 65 percent what it was in 1970-74 period. Land productivity in Nyanza increased initially by about 13 percent between 1970-74 and 1974-79. It declined during the drought years, improved slightly after 1985 and has decreased further by 12 percent between 1985-90 and 1990-95 period. Like Western province, Nyanza lacks the production of high value crops. Both sugar and maize whose performance has been poor dominate the production in this province. 16
  • 17. Figure 7. Land and Labor Productivity Ratios for Nyanza Province Land and Labor Production for Nyanza Province 25000 24000 Land Productivity (Ksh per Hectare) Y/A 23000 1985-90 22000 1979-80 1980-85 21000 20000 1990-95 1970-74 19000 18000 1000 1500 2000 2500 Labor Productivity (Ksh per Rural Person) Y/L 4.2. Factors Influencing Land and Labor Productivity It is difficult to discern clear and consistent trends in productivity changes within regions because Kenya does not have specific regionally-based agricultural policies. Weather patterns and crop cultivation patterns can differ widely across regions. The crop mixes in each zone thus influence regional agricultural productivity. In Central Province for example labor productivity increased during the period 1970-1980 when it mainly stagnated in the other provinces during the same time. The land productivity also increased more rapidly in Central Province than in other provinces. This is due to shifts in crop mixes from crops like maize towards high value horticultural crops. In Nyanza and Western provinces particularly, the land and labor productivity has not only been low but has also declined faster than in other areas. The results thus implies that except in central, the welfare for the rural population in all the other provinces stagnated until 1990 when it has started to decline. The contribution of the provinces to the general economic growth in the country has also decline following the decline in the value of agricultural production. A higher proportion of rural families thus are likely to be more food insecure than they were in 1990, have less job opportunities and have less family incomes. Land productivity and labor productivity growth have corresponded to the periods when area expansion of high-value crops was taking place. Area expansion, particularly of maize, 17
  • 18. coffee, and wheat, has extended to marginal areas due to increasing population pressure in the high potential areas. A higher proportion of the population has moved to the lesser potential and more marginal areas. But crop varieties and other production technologies used in these areas remain those designed for the high and medium potential areas. It is increasingly clear that viable technology packages for marginal areas will be needed to appreciably raise aggregate agricultural productivity in Kenya and alleviate rural poverty. Limited technical progress in Africa has fostered an active debate over the performance of technology generation and dissemination systems. For example, questions are frequently posed whether viable food crop technology packages exist for medium and low potential areas that are relevant for smallholders (but aren’t being fully utilized for other reasons) or whether the available on-shelf food crop technologies simply aren’t viable enough to appreciably stimulate agricultural growth. Another question that may be posed is why, despite an empirical record indicating very high rates of return to agricultural research in Africa, has food crop production growth remained mostly stagnant in these same countries in which the empirical investigations were carried out. The partial productivity analysis depicts a very volatile and fragile agricultural system where productivity gains in a few years can be eroded almost immediately. This underscores the need for high quality agricultural research systems to generate continuous improvements in farm technology over time. The decline in land and labor productivity corresponds to the time when market reform policies were implemented. The partial, stop-go nature of market liberalization and poor sequencing of the liberalization policies during the 1990s has mitigated some of the important potential benefits of reform to producers. The policies were also poorly timed (Nyangito 1998). For example, fertilizer prices were liberalized in 1990 when the maize, wheat and sugar prices and marketing continued to be regulated by government until 1994. This squeezed profits and thus reduced producer incentives to use productivity-enhancing inputs. The inflationary conditions of the 1990s, fueled by the depreciation of the shilling, increased the prices of imported fertilizer and pesticides at a higher rate than the rise in commodity prices, which thus squeezed the profits and reduced the producer incentives. On top of this, problems in developing viable systems of private farm finance have left a vacuum in the agricultural credit system after the contraction of the AFC system. As a result, maize and wheat area and production have declined, use of fertilizer has stagnated, and use of hybrid maize seed has actually declined. The extension delivery to farmers is poor and farmers may not be aware of the improved technologies. Farmers have increasingly been unable to access credit through the formal credit market. For many smallholders, the purchase of yield enhancing inputs such as fertilizers, pesticides, seed and payment of labor (PAM 1995). Seed quality particularly that of maize and wheat is poor because of the poor distribution system, which restricted the availability of preferred seed. Lack of a reliable seed quality control service also contribute to the poor quality seed (Nyoro 1995). 18
  • 19. 5. CONCLUSIONS AND IMPLICATIONS FOR POLICY TO STRENGTHEN AGRICULTURAL PRODUCTIVITY This section summarizes the findings above, and draws from a wider range of experience in Sub-Saharan Africa on identifying cost-effective strategies for increasing agricultural productivity. 5.1. Summary of Main Results The partial productivity measure for labor (in constant 1991-95 terms) has declined from roughly 3,000 Ksh per rural person in 1970-74 to 2,400 Ksh per person in 1990-94 -- about a 20 percent decline. Land productivity had increased greatly up to about 1990 and has fallen since. The decline has occurred because fertilizer use has stagnated, use of hybrid maize seed has declined because seed quality has declined. Contraction of credit schemes by the AFC has also left a vacuum in the agricultural credit system. On the policy side, the stop-go policy environment, poor sequencing of the liberalization policies has mitigated some of the important potential benefits of reform to producers. The poor management of coffee cooperatives and sugar factories have reduced payments to farmers. Due to increasing population pressure in the high potential areas, a high proportion of population has moved to lesser potential and more marginal area without appropriate technologies suitable for these fragile areas. This has caused decline in crop production in these areas. Large increases in the land and labor productivity such as that achieved in Central Province are due to the changes in crop mixes. In crops like coffee, tea maize and wheat, the growth in productivity was as a result of area expansion rather than intensification of the existing farming systems. Growth in land productivity has also resulted from the development and adoption of new varieties of maize and wheat crops. But crop yields have also declined because crop varieties and other production technologies adopted in the low potential and marginal areas are inappropriate for them. A major challenge in Kenya now is to adopt policy reforms that could induce technical change in agriculture.4 Polices adopted should solve the broader problems relating to the generation, dissemination and adoption of new technologies and thus stimulate changes in crop mixes towards the production of high value crops. Market policy reforms and technology development therefore need to be viewed as different facets of the same problem. Marketing strategies will need to refocus their emphasis from the liberalization of markets to the sustainable promotion of productivity growth for the millions of low-input semi-subsistence rural households in Kenya. This implies a major role for future marketing research in identifying public and private investments and activities that will intensify input use on smallholder farms. Can such research activities be financed within the constraints of available budgets, and involve greater coordination between the public and private sectors in providing smallholders with access to integrated input, credit, and output markets. The most promising scenarios are likely to involve farmer organizations 4 Important steps that the government could take to in this direction to raise productivity have been recommended by Tegemeo in the proceedings of the conference on improving agricultural performance towards 2000 (PAM 1995). These includes the following: 19
  • 20. (accountable to farmers), multinational input and commodity trading firms, improved technology development, a supportive public sector. An expanded role for commodity exchanges, forward contracting, and other mechanisms could also be used to reduce the costs and risks of investing in the entire food system (Jayne and Jones 1997). Given the fiscal restrictions imposed by the need for structural adjustment, there will be increased emphasis in the foreseeable future on developing financially sustainable market- oriented mechanisms and exploiting the potential gains from regional trade. Important steps that governments could take to raise the productivity and stability of the food systems include the following: 1. Improve Road, Rail, Port, and Communication Infrastructure: Donor support in this area would make the market liberalization measures they advocated more successful. High transportation costs in Kenya contribute to higher fertilizer prices, lower output prices for farmers and hence lower incentives to invest in productivity-enhancing technologies. Improved market infrastructure also requires further policy change to remove remaining import tariffs on grain, vehicles and spare parts. One important role for research is to identify where such infrastructure investments would have the highest payoffs. For example, by analyzing food production, consumption, and price dispersion patterns in a country, researchers can provide insights into where investment in a road would do the most to improve food security or increase production potential through raising farm output prices and lowering farm input prices. Given the high cost of such infrastructure investments, such targeting is extremely important. 2. Invest More in Market-oriented Agricultural Research: In market-oriented growth strategies, well tested and improved cultivars and management practices for commodities for which there are viable markets, work synergistically with improved input and output markets to create sustainable conditions for intensification and productivity growth. Yet national research budgets and donor funding of technology development are in many cases declining. KARI faces numerous problems including low salaries, dismal conditions of service for their researchers, and continued reliance on donor finance for funds whose sustainability cannot be assured. The history of agricultural research in Uganda shows the impossibility of turning research off and on. It takes only a short lapse in research support to result in massive losses in human and physical capital that requires painful and expensive new investments to rebuild. And despite claims that fertilizer/seed technologies are on the shelf that can double or triple farm yields in Africa, there remains a dearth of research on the profitability and riskiness of those technologies under farmers’ actual control, and under current input and output market conditions or those foreseeable under alternative sustainable input and output marketing arrangements. KARI could also expansion the generation of technologies that are more suitable to the medium and lower potential areas as is happening in wheat and maize. Priority setting process should also included in these crops. The boundaries between production and marketing activities are becoming increasingly blurred, as the agricultural product specification becomes more complex. For example, the rising importance of biotechnology will create a variety of new opportunities for applying new scientific discoveries toward practical use in the food and fiber system and working out intellectual property rights for the product (Zilberman, Yarkin, and Heiman 1997). An increasingly important role of the interrelated research, marketing, and legal systems is to work out the details of use and exchange of information and knowledge. 20
  • 21. 3. Invest More to Nurture the Political, Legal and Economic Foundations of Private Marketing Systems: A well-functioning legal and political framework for market activity reduces the risks and transactions costs of private trade. Strengthened mechanisms for specifying and enforcing contracts, raising the costs of contract non-compliance, and more pluralistic procedures for developing the rules governing market activity are important adjuncts to developing reliable markets, and inherently involve strengthening the regulatory abilities of the state rather than getting the state out of market regulation. In general, this means a reorientation of the state from control activities to facilitation activities designed to reduce farmers’ and traders’ costs of transacting across inputs, credit, and commodities. This would include, for example, the removal of existing legal and institutional constraints that have impeded the establishment of efficient management of the smallholder tea factories and coffee cooperative societies. The timely dissemination of market information can also help policy makers monitor the evolving effects of market liberalization better, identify problems that require mid-course correction, and respond to impending supply fluctuations in a more timely way. Such an approach also includes more public support for the development of fledgling commodity exchanges, which have the longer-run potential to improve the dissemination of market information, reduce search costs to link buyers and sellers substantially, and lower supply and price risks through forward contracting and hedging. 4. Coordinate Policies and Investments to Gain Complementary Benefits from Higher- Valued Cash and Food Crop Production: With most of Kenya’s poor residing in regions of significant agricultural potential, and in light of severe land constraints in many of these regions, developing strategies to increase the value of agricultural production per unit of land and labor is a top priority. Smallholder commercialization, particularly into higher-value export crops, generally has produced significant and positive effect on food crop fertilizer use and productivity, however, this varies by crop and region. A major avenue for future research is to understand better how successful commercialization arrangements linking smallholders and marketing/processing firms have been structured so that their successful ingredients can be replicated and incorporated more broadly into commercialization strategies in other regions. This is likely to yield high payoffs in terms of increasing agricultural productivity and food security. 5. Increase Business Skills Training and Related Support for Grass-roots Farmer Organizations: While the benefits of existing farmer organizations have derived mainly from reducing the transaction costs of acquiring and repaying credit through group schemes, these benefits can be potentially extended into a broader range of input and output marketing activities. For example, in Mali, such organizations handle most of the bulking and initial grading of cotton and the management of local savings and loan associations. Future roles for farmer organizations include greater involvement in the gathering and dissemination of market information, the diffusion of technical advice, and the bulking of farmer surpluses to facilitate smallholder participation in local and regional markets, thereby opening up a number of market-oriented mechanisms (e.g., commodity exchanges, forward contracting) for reducing the risks of price and supply instability. Moreover, there are very different economies of scale at various stages of the food system. Multinational firms may have certain advantages in international trade (acquiring fertilizer and other inputs, hedging on futures markets, having a wider trade portfolio to reduce risks) and accessing technologies from around the world. But given the small size of most African 21
  • 22. markets, such large firms are likely to have substantial market power and may not have incentives to pass on all these benefits to smallholders. The development of strong farmer groups may mitigate the potential for actors at highly concentrated stages to exert market power to the detriment of smallholder production growth. Such organizations may even act as subcontractors or partners to multinationals, thereby creating a system that captures the benefits of scale economies in international trade while tailoring specific services to local farmers' conditions.5 6. Invest in Local Analytical Capacity: The payoffs to market reforms have been most effective when as part of the reform process, there has been a concerted effort to strengthen domestic capacity for ongoing research and analysis to inform the reform process. Because of the paucity of data on food systems in most African countries, most reforms are necessarily designed initially on the basis of scanty empirical information. The strengthening of domestic analysis capacity allows a mechanism for on-going monitoring of food system performance in response to the reforms and provides a mechanism for mid-course corrections as researchers uncover new empirical information. Given the ongoing nature of the reforms, it is unlikely that outside consultants alone can assure the continuity of monitoring, analysis and evaluation needed to help guide the reforms. Lasting market and related policy change depends critically on governments’ actual belief in the analysis supporting the reforms. There is ample evidence that governments that have reluctantly undertaken market reform programs have reversed them and reimposed the old system of price and trade controls with the advent of drought or other shocks (Jayne and Jones 1997). Local analytical units are often seen as bringing more local knowledge to the analysis, being less ideologically driven, and having greater sensitivity to domestic policy concerns than analysis conceived and driven by donor interests using expatriate analysts. At the same time, cooperative analyses involving both local units and external researchers is often valued, as the involvement of an internationally known research organization often gives local decision makers greater confidence in the scientific soundness of the analysis. The demand for, and credibility of, food policy analysis to guide market development is enhanced by a collaborative research process driven by local researchers and government analysts who take ownership of the research agenda and findings. 5 For example, in Mali the union of cotton farmers, the multinational cotton company, and the state are all signatories to the contract-plan governing the management of the cotton subsector in the country and all receive a share of the cotton company’s profits. 22
  • 23. REFERENCES Block, Steven. 1992. Agricultural Productivity and Its Contribution to Agricultural Growth in Kenya. Consultant report submitted to USAID/Kenya, Nairobi. Block, Steven. 1994. A New View of Agricultural Productivity in Sub-Saharan Africa. American Journal of Agricultural Economics 76 (August): 619-624. Cheru, Fantu. 1999. The Impact of Structural Adjustment Programmes on the Realization of Economic, Social and Cultural Rights. Report for the United National High Commission on Human Rights, Geneva. Cornia, G.A., R. Jolly, and F. Stewart. 1987. Adjustment with a Human Face. Oxford: Oxford University Press. Gersovitz, M., and C. Paxson. 1996. The Revenues and Expenditures of African Governments: Modalities and Consequences. Journal of African Economies 5.2: 199- 227. Hassan, M. Rashid, Winfred Mwangi, and Daniel Karanja. 1993. Wheat Supply in Kenya: Production Technologies, Sources of Inefficiency and Potential for Productivity Growth. Nairobi: Kenya Agricultural Research Institute. Hayami, Yujiro, and Vernon Ruttan. 1985. Agricultural Productivity An International Perspective. Baltimore: John Hopkins. Jayne, T.S., and Stephen Jones. 1997. Food Marketing and Pricing Policy in Eastern and Southern Africa: A Survey. World Development 25.9: 1505-1527. Mosley, Paul. 1994. Policy and Capital Markets Constraints to the African Green Revolution: A Study of Maize and Sorghum Yields in Kenya, Malawi, and Zimbabwe, 1960-91. In From Adjustment to Development in Africa: Conflict, Controversy, Convergence, and Consensus?, eds. G. Andrea Cornia and G. Helleiner. New York: Macmillan. Nyangito, Hezron. 1998. Agricultural Sector Performance in a Changing Policy Environment. Nairobi: Institute of Policy Analysis and Research. Nyoro, J.K. 1995. Impact of Market Reform on Seed Development, Multiplication, and Distribution. Paper presented on the Conference on Fine Tuning Market Reforms for Improved Agricultural Performance, September, Nairobi. PAM. 1995. Proceeding on the Conference on Towards 2000: Improving Agricultural Performance. Nairobi. Sahn, David, and Alexander Sarris. 1991. Structural Adjustment and the Welfare of Rural Smallholders: A Comparative Analysis FROM Sub- Saharan Africa. The World Bank Economic Review 5.2: 259-289. 23
  • 24. Thirtle, C., Jon Atkins, Paul Botomley, Nancy Gonese, Jones Govereh, and Yougesh Khatri. 1993. Agricultural Productivity in Zimbabwe 1970-1990. Economic Journal 103 (March): 474-480. United States Agency for International Development (USAID). 1993. Africa: Growth Renewed Hope Rekindled: A Report on the Performance of the Development Fund for Africa, 1988-1992. Washington, D.C.: USAID, Office of Development Planning, Bureau for Africa. World Bank. 1994. Adjustment in Africa: Reforms, Results and the Road Ahead. New York: Oxford University Press. Zilberman, D., C. Yarkin, and A. Heiman. 1997. Agricultural Biotechnology: Economic and International Implications. Invited paper presented at the International Agricultural Economics Association meeting, August, Sacramento, California. 24