SlideShare ist ein Scribd-Unternehmen logo
1 von 11
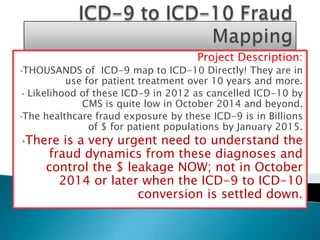
Project Description:
•THOUSANDS     of ICD-9 map to ICD-10 Directly! They are in
           use for patient treatment over 10 years and more.
 • Likelihood of these ICD-9 in 2012 as cancelled ICD-10 by
              CMS is quite low in October 2014 and beyond.
•The healthcare fraud exposure by these ICD-9 is in Billions
                of $ for patient populations by January 2015.
•There  is a very urgent need to understand the
     fraud dynamics from these diagnoses and
     control the $ leakage NOW; not in October
       2014 or later when the ICD-9 to ICD-10
                     conversion is settled down.
•
•Some   specialties such as ENT do not change much in
 the same patient for a given age. The procedures are
not that expensive and hence conducive to fraud such
          as billing without services rendered and even
                overbilling that a payer notices too late!
 • Several stable diagnoses in Cardiology specialty is
easy target for Billions $ upcoding and downcoding.
      • Furthermore, Specialty such as Pediatrics and
           OBGYN presents special challenge to Fraud
             •Detection. Advance analytics IS needed!!
•Mock   up 300 lines of data from specialty such as ENT.
•Apply Fraud Analytics Concept resulting in Fraud Conditions.
    •The Fraud Analytics Methods and Conditions will be used
 prospectively to monitor providers practice variations as well
            as utilize them as variables in Predictive Analytics.
•478.33 paralysis of vocal chords; bilateral partial
     •478.5 other diseases of vocal chord (abces,
    cellulitis, granuloma, leukoplakia, chronditis,
                                     singer's node)
                        •478.74 stenosis of larynx
   •478.8 Upper respiratory tract hypersensitivity
                         reaction, site unspecified
      •212.1 benign Neoplasm of respiratory and
                               Intrthoracic Sinuses
ICD-9 code   The ICD-10 conversion code
478.33         J38.Ø2
478.5          J38.3
478.74         J38.6
478.8          J39.3
212.1          D14.1
400


           350
                                                   10%
           300
                                                   53%
           250                                                                                      Charge_$
Charge_$


                                                                                                    Mean
           200                                                                                      +2 StdDev

                                                                                                    -2 StdDev
           150
                                                                                                    +3 StdDev

                                                                                                    -3 StdDev
           100


            50


             0

                 1   3   5   7   9 11 13 15 17 19 21 23 25 27 29 31 33 35 37 39 41 43 45 47 49 51
                                                         Day Number
350


    300                                   0%
C
h   250
a                                         50%
                                                                                       Charge_$
r   200                                                                                Mean

g                                                                                      +2 StdDev
    150
e                                                                                      -2 StdDev

                                                                                       +3 StdDev
    100                                                                                -3 StdDev


$    50


      0

          1 2 3 4 5 6 7 8 9 10111213141516171819202122232425262728293031323334353637
                                               Day Number
   Name: ENT_High_Low_biller.
   Metrics (or data inside this variable): -
   A. Total charge $ on two FWA Diagnoses/
    total charge $ on all five diagnoses.
   B. Total charge $ on two FWA Diagnoses/
    total charge $ on Three Non FWA diagnoses.
   C. Total number of claim lines on two FWA
    Diagnoses/ total claim lines on all five
    diagnoses.
   Variable Name= ENT_High_Low_biller_A=0.46.
   ENT_High_Low_biller_B=0.85.
   ENT_High_Low_biller_C= 0.44
   Conclusion: assuming that the suspected provider is in
    the network, 44% of the suspected diagnoses lines
    yielded 46% of the revenue from those two Dx for this
    provider. This provider likes to bill towards maximum
    contract charge $ on those two suspected Diagnoses
    regardless of patient gender and age (.46/.44=1.05). A
    Medicaid payer needs to stop this Now! Do not take a
    chance that CMS will delete them in October 2014.
   Even if CMS deletes all those thousands of codes (very
    unlikely to happen), BILLIONS will be lost by 1st
    January, 2015 (remember FWA is 300 Billion $ industry).
   Six Sigma approach can’t stops bleeding in Millions of $
    because one simple method can’t be Silver Bullet!
   However, Advance analytics such as Neural Network and
    Decision Tree needs to be applied to stop Billions $ Fraud
    because billing pattern is getting complicated every day.
   Remember that FWA phrase,” Where there are chronic
    patients present, Huge fraud is NEVER absent!!”
   There is a misconception that FWA and Disease
    Management are two different sides of Cost savings
    efforts; that it is doubling of efforts. It is NOT!
   I’ll show how Six Sigma and Advance Analytics FWA
    variables efficiently help reduce cost in Disease
    Management also.
   Navin Kumar Sinha (2012).
   Double Check Consulting.
   3744 Pennsylvania Ave, Apt 18, Fremont, CA
    94536.
   Phone: 952-905-6636.
   MS: Statistical Genetics: Urbana-Champaign, IL.
   MBA: Utah State University (Decision Sciences).
   Experience of saving $50 million by conservative
    estimates in Healthcare Industry for Branded
    Companies all over USA.

Weitere ähnliche Inhalte

Mehr von Double Check ĆŐNSULTING

Inventory management – sales forecasting analytics
Inventory management – sales forecasting analyticsInventory management – sales forecasting analytics
Inventory management – sales forecasting analyticsDouble Check ĆŐNSULTING
 
Mathematics of outlier_detection_and_pattern_recognition_pharmacy_fraud_2013
Mathematics  of outlier_detection_and_pattern_recognition_pharmacy_fraud_2013Mathematics  of outlier_detection_and_pattern_recognition_pharmacy_fraud_2013
Mathematics of outlier_detection_and_pattern_recognition_pharmacy_fraud_2013Double Check ĆŐNSULTING
 
American Statistical Association October 23 Minneapolis Presentation Part 2
American Statistical Association October 23 Minneapolis Presentation Part 2American Statistical Association October 23 Minneapolis Presentation Part 2
American Statistical Association October 23 Minneapolis Presentation Part 2Double Check ĆŐNSULTING
 
American Statistical Association October 23 2009 Presentation Part 1
American Statistical Association October 23 2009 Presentation Part 1American Statistical Association October 23 2009 Presentation Part 1
American Statistical Association October 23 2009 Presentation Part 1Double Check ĆŐNSULTING
 

Mehr von Double Check ĆŐNSULTING (6)

Inventory management – sales forecasting analytics
Inventory management – sales forecasting analyticsInventory management – sales forecasting analytics
Inventory management – sales forecasting analytics
 
Mathematics of outlier_detection_and_pattern_recognition_pharmacy_fraud_2013
Mathematics  of outlier_detection_and_pattern_recognition_pharmacy_fraud_2013Mathematics  of outlier_detection_and_pattern_recognition_pharmacy_fraud_2013
Mathematics of outlier_detection_and_pattern_recognition_pharmacy_fraud_2013
 
Pharmacy drug adherence march2013
Pharmacy drug adherence march2013Pharmacy drug adherence march2013
Pharmacy drug adherence march2013
 
Data Visions Big Data Visual Analytics Tool
Data Visions Big Data Visual Analytics ToolData Visions Big Data Visual Analytics Tool
Data Visions Big Data Visual Analytics Tool
 
American Statistical Association October 23 Minneapolis Presentation Part 2
American Statistical Association October 23 Minneapolis Presentation Part 2American Statistical Association October 23 Minneapolis Presentation Part 2
American Statistical Association October 23 Minneapolis Presentation Part 2
 
American Statistical Association October 23 2009 Presentation Part 1
American Statistical Association October 23 2009 Presentation Part 1American Statistical Association October 23 2009 Presentation Part 1
American Statistical Association October 23 2009 Presentation Part 1
 

ICD-9 to ICD-10 Fraud Risk Assessment and Analytics Project

  • 1. Project Description: •THOUSANDS of ICD-9 map to ICD-10 Directly! They are in use for patient treatment over 10 years and more. • Likelihood of these ICD-9 in 2012 as cancelled ICD-10 by CMS is quite low in October 2014 and beyond. •The healthcare fraud exposure by these ICD-9 is in Billions of $ for patient populations by January 2015. •There is a very urgent need to understand the fraud dynamics from these diagnoses and control the $ leakage NOW; not in October 2014 or later when the ICD-9 to ICD-10 conversion is settled down.
  • 2. • •Some specialties such as ENT do not change much in the same patient for a given age. The procedures are not that expensive and hence conducive to fraud such as billing without services rendered and even overbilling that a payer notices too late! • Several stable diagnoses in Cardiology specialty is easy target for Billions $ upcoding and downcoding. • Furthermore, Specialty such as Pediatrics and OBGYN presents special challenge to Fraud •Detection. Advance analytics IS needed!!
  • 3. •Mock up 300 lines of data from specialty such as ENT. •Apply Fraud Analytics Concept resulting in Fraud Conditions. •The Fraud Analytics Methods and Conditions will be used prospectively to monitor providers practice variations as well as utilize them as variables in Predictive Analytics.
  • 4. •478.33 paralysis of vocal chords; bilateral partial •478.5 other diseases of vocal chord (abces, cellulitis, granuloma, leukoplakia, chronditis, singer's node) •478.74 stenosis of larynx •478.8 Upper respiratory tract hypersensitivity reaction, site unspecified •212.1 benign Neoplasm of respiratory and Intrthoracic Sinuses
  • 5. ICD-9 code The ICD-10 conversion code 478.33 J38.Ø2 478.5 J38.3 478.74 J38.6 478.8 J39.3 212.1 D14.1
  • 6. 400 350 10% 300 53% 250 Charge_$ Charge_$ Mean 200 +2 StdDev -2 StdDev 150 +3 StdDev -3 StdDev 100 50 0 1 3 5 7 9 11 13 15 17 19 21 23 25 27 29 31 33 35 37 39 41 43 45 47 49 51 Day Number
  • 7. 350 300 0% C h 250 a 50% Charge_$ r 200 Mean g +2 StdDev 150 e -2 StdDev +3 StdDev 100 -3 StdDev $ 50 0 1 2 3 4 5 6 7 8 9 10111213141516171819202122232425262728293031323334353637 Day Number
  • 8. Name: ENT_High_Low_biller.  Metrics (or data inside this variable): -  A. Total charge $ on two FWA Diagnoses/ total charge $ on all five diagnoses.  B. Total charge $ on two FWA Diagnoses/ total charge $ on Three Non FWA diagnoses.  C. Total number of claim lines on two FWA Diagnoses/ total claim lines on all five diagnoses.
  • 9. Variable Name= ENT_High_Low_biller_A=0.46.  ENT_High_Low_biller_B=0.85.  ENT_High_Low_biller_C= 0.44  Conclusion: assuming that the suspected provider is in the network, 44% of the suspected diagnoses lines yielded 46% of the revenue from those two Dx for this provider. This provider likes to bill towards maximum contract charge $ on those two suspected Diagnoses regardless of patient gender and age (.46/.44=1.05). A Medicaid payer needs to stop this Now! Do not take a chance that CMS will delete them in October 2014.  Even if CMS deletes all those thousands of codes (very unlikely to happen), BILLIONS will be lost by 1st January, 2015 (remember FWA is 300 Billion $ industry).
  • 10. Six Sigma approach can’t stops bleeding in Millions of $ because one simple method can’t be Silver Bullet!  However, Advance analytics such as Neural Network and Decision Tree needs to be applied to stop Billions $ Fraud because billing pattern is getting complicated every day.  Remember that FWA phrase,” Where there are chronic patients present, Huge fraud is NEVER absent!!”  There is a misconception that FWA and Disease Management are two different sides of Cost savings efforts; that it is doubling of efforts. It is NOT!  I’ll show how Six Sigma and Advance Analytics FWA variables efficiently help reduce cost in Disease Management also.
  • 11. Navin Kumar Sinha (2012).  Double Check Consulting.  3744 Pennsylvania Ave, Apt 18, Fremont, CA 94536.  Phone: 952-905-6636.  MS: Statistical Genetics: Urbana-Champaign, IL.  MBA: Utah State University (Decision Sciences).  Experience of saving $50 million by conservative estimates in Healthcare Industry for Branded Companies all over USA.