Cotton Market Fundamentals & Price Outlook
•
0 gefällt mir•868 views

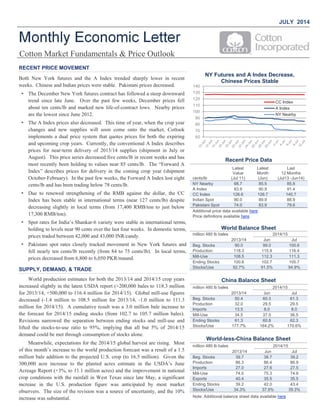
Both New York futures and the A Index trended sharply lower in recent weeks. Chinese and Indian prices were stable. Pakistani prices decreased.

Empfohlen
Empfohlen
Weitere ähnliche Inhalte
Was ist angesagt?
Was ist angesagt? (20)
Andere mochten auch
Andere mochten auch (20)
Ähnlich wie Cotton Market Fundamentals & Price Outlook
Ähnlich wie Cotton Market Fundamentals & Price Outlook (20)
Mehr von Peerasak C.
Mehr von Peerasak C. (20)
Kürzlich hochgeladen
Kürzlich hochgeladen (20)
Cotton Market Fundamentals & Price Outlook
- 1. NY Futures and A Index Decrease, Chinese Prices Stable Recent Price Data cents/lb Latest Value Latest Month Last 12 Months (Jul 11) (Jun) (Jul13 -Jun14) NY Nearby 68.7 85.5 85.8 A Index 83.9 90.9 91.4 CC Index 126.6 126.7 140.7 Indian Spot 90.0 89.9 88.9 Pakistani Spot 74.0 83.9 79.6 Additional price data available here Price definitions available here World Balance Sheet million 480 lb bales 2014/15 2013/14 Jun Jul Beg. Stocks 90.0 99.0 100.6 Production 118.3 115.9 116.4 Mill-Use 108.5 112.3 111.3 Ending Stocks 100.6 102.7 105.7 Stocks/Use 92.7% 91.5% 94.9% China Balance Sheet million 480 lb bales 2014/15 2013/14 Jun Jul Beg. Stocks 50.4 60.3 61.3 Production 32.0 29.5 29.5 Imports 13.5 8.0 8.0 Mill-Use 34.5 37.0 36.5 Ending Stocks 61.3 60.8 62.3 Stocks/Use 177.7% 164.2% 170.6% World-less-China Balance Sheet million 480 lb bales 2014/15 2013/14 Jun Jul Beg. Stocks 39.7 38.7 39.2 Production 86.3 86.4 86.9 Imports 27.0 27.6 27.5 Mill-Use 74.0 75.3 74.8 Exports 40.4 35.5 35.5 Ending Stocks 39.2 42.0 43.4 Stocks/Use 34.3% 37.9% 39.3% Note: Additional balance sheet data available here 60 70 80 90 100 110 120 130 140 CC Index A Index NY Nearby RECENT PRICE MOVEMENT Both New York futures and the A Index trended sharply lower in recent weeks. Chinese and Indian prices were stable. Pakistani prices decreased. The December New York futures contract has followed a steep downward trend since late June. Over the past few weeks, December prices fell about ten cents/lb and marked new life-of-contract lows. Nearby prices are the lowest since June 2012. The A Index prices also decreased. This time of year, when the crop year changes and new supplies will soon come onto the market, Cotlook implements a dual price system that quotes prices for both the expiring and upcoming crop years. Currently, the conventional A Index describes prices for near-term delivery of 2013/14 supplies (shipment in July or August). This price series decreased five cents/lb in recent weeks and has most recently been holding to values near 85 cents/lb. The “Forward A Index” describes prices for delivery in the coming crop year (shipment October-February). In the past few weeks, the Forward A Index lost eight cents/lb and has been trading below 78 cents/lb. Due to renewed strengthening of the RMB against the dollar, the CC Index has been stable in international terms (near 127 cents/lb) despite decreasing slightly in local terms (from 17,400 RMB/ton to just below 17,300 RMB/ton). Spot rates for India’s Shankar-6 variety were stable in international terms, holding to levels near 90 cents over the last four weeks. In domestic terms, prices traded between 42,000 and 43,000 INR/candy. Pakistani spot rates closely tracked movement in New York futures and fell nearly ten cents/lb recently (from 84 to 75 cents/lb). In local terms, prices decreased from 6,800 to 6,050 PKR/maund. SUPPLY, DEMAND, & TRADE World production estimates for both the 2013/14 and 2014/15 crop years increased slightly in the latest USDA report (+200,000 bales to 118.3 million for 2013/14, +500,000 to 116.4 million for 2014/15). Global mill-use figures decreased (-1.4 million to 108.5 million for 2013/14, -1.0 million to 111.3 million for 2014/15). A cumulative result was a 3.0 million bale increase to the forecast for 2014/15 ending stocks (from 102.7 to 105.7 million bales). Revisions narrowed the separation between ending stocks and mill-use and lifted the stocks-to-use ratio to 95%, implying that all but 5% of 2014/15 demand could be met through consumption of stocks alone. Meanwhile, expectations for the 2014/15 global harvest are rising. Most of this month’s increase to the world production forecast was a result of a 1.5 million bale addition to the projected U.S. crop (to 16.5 million). Given the 300,000 acre increase to the planted acres estimate in the USDA’s June Acreage Report (+3%, to 11.1 million acres) and the improvement in national crop conditions with the rainfall in West Texas since late May, a significant increase in the U.S. production figure was anticipated by most market observers. The size of the revision was a source of uncertainty, and the 10% increase was substantial. JULY 2014 Monthly Economic Letter Cotton Market Fundamentals & Price Outlook
- 2. MONTHLY ECONOMIC LETTER | JULY 2014 Please forward comments and questions to marketinformation@cottoninc.com To subscribe to the Monthly Economic Letter click here and follow the instructions in the Email Subscriptions box on the left side of the page. Sources: Price data from Reuters, Cotlook, Cotton Assn. of India, and Karachi Cotton Assn. Supply, demand, and trade data from the USDA. Disclaimer: The information contained herein is derived from public and private subscriber news sources believed to be reliable; however, Cotton Incorporated cannot guarantee its accuracy or completeness. No responsibility is assumed for the use of this information and no express or implied warranties or guarantees are made. The information contained herein should not be relied upon for the purpose of making investment decisions. This communication is not intended to forecast or predict future prices or events. © 2014 Cotton Incorporated. All rights reserved; America's Cotton Producers and Importers World Cotton Production million 480lb bales 2014/15 2013/14 Jun Jul China 32.0 29.5 29.5 India 30.5 28.5 28.0 United States 12.9 15.0 16.5 Pakistan 9.5 9.5 9.5 Brazil 7.8 8.3 8.0 Rest of World 25.6 25.1 24.9 World 118.3 115.9 116.4 World Cotton Mill-Use million 480lb bales 2014/15 2013/14 Jun Jul China 34.5 37.0 36.5 India 23.8 24.3 24.3 Pakistan 10.7 11.3 11.0 Turkey 6.3 6.4 6.4 Brazil 4.2 4.3 4.3 Rest of World 29.1 29.0 28.9 World 108.5 112.4 111.3 World Cotton Exports million 480lb bales 2014/15 2013/14 Jun Jul United States 10.5 9.7 10.2 India 9.0 5.7 5.5 Brazil 2.3 3.3 3.4 Australia 4.5 3.1 3.3 Uzbekistan 2.7 2.5 2.5 Rest of World 11.5 11.3 10.7 World 40.5 35.6 35.6 World Cotton Imports million 480lb bales 2014/15 2013/14 Jun Jul China 13.5 8.0 8.0 Bangladesh 4.1 4.3 4.4 Turkey 4.5 3.8 3.9 Vietnam 3.3 2.9 2.9 Indonesia 2.7 2.8 2.8 Rest of World 12.5 13.8 13.6 World 40.5 35.6 35.5 World Cotton Ending Stocks million 480lb bales 2014/15 2013/14 Jun Jul China 61.3 60.8 62.3 India 11.0 10.5 10.3 Brazil 7.4 8.1 8.3 United States 2.7 4.3 5.2 Pakistan 2.6 3.0 2.8 Rest of World 15.6 16.0 16.8 World 100.6 102.7 105.7 Note: Additional supply and demand data available here Even though the larger crop forecast was accompanied by partially offsetting increases in demand, with both the 2014/15 U.S. export (+500,000 bales, to 10.2 million) and domestic mill-use figures (+100,000 bales, to 3.8 million) being revised higher, a significant increase was made to 2014/15 ending stocks (+900,000 bales). Current projections indicate U.S. ending stocks will nearly double in the coming crop year, rising from 2.7 million in 2013/14 to 5.2 million, and will reach their highest level since 2008/09. Since cotton held in the U.S. is available to the world market, the build-up of U.S. stocks could keep downward pressure on prices around the world. Other important country-level revisions to USDA production figures included those for Brazil (-300,000 bales, to 8.0 million) and Australia (- 400,000 bales, to 2.7 million). Planting for the 2014/15 season has not yet occurred for these southern hemisphere producers, and the recent decrease in world price may provide some incentive to plant other crops. Australia is also among the countries currently suffering from dry conditions. Another is India, where major growing regions are more than 60% behind the long-term average for monsoon-related rainfall. The monsoon, which generally occurs between June and September, typically brings more than 80% of annual rainfall. Time remains for the monsoon to accelerate, but the slow pace thus far was a likely reason why India’s production figure decreased 500,000 bales (to 28.0 million). In terms of consumption, the largest changes were for China, where 2013/14 mill-use was lowered 1.0 million bales (to 34.5 million) and 2014/15 use was lowered 500,000 bales (to 36.5 million). Other notable reductions to 2014/15 forecasts were made for Pakistan (-300,000 bales, to 11.0 million) and Brazil (-200,000 bales, to 4.0 million). PRICE OUTLOOK In recent years, price movement could be explained through several principal factors. The most significant of these would be Chinese cotton policies that concentrated global supplies in China. This concentration was a function not only of China’s accumulation of reserves, but also of stronger Chinese demand for fiber and yarn imports that prevented stocks from accumulating elsewhere. Lower stocks outside China, which are generally considered available to the market, supported prices despite record volumes at the global level. Another factor that supported prices was the weather, with West Texas, the largest growing region in the U.S., suffering three successive years of severe drought. It appears that these factors that supported prices will diminish in the coming crop year. West Texas has received above average rainfall this calendar year and China has indicated it will no longer support growers through purchases by its reserve system. Chinese imports of fiber are expected to fall 40% and Chinese yarn import demand began to decrease last fall. Due to these factors, stocks outside of China are forecast to reach a new record in 2014/15. The increase in available supply has already pushed prices lower. Developments involving growing conditions around the world and Chinese policy should determine whether recent decreases will be sustained or augmented.
- 3. Charts - Daily Charts - Monthly Tables Note: Differences in price movement in local and international terms (cents/lb) due to changes in exchange rates. A Index & NY Nearby Chinese Prices Indian Prices Pakistani Prices Balance Sheets (bales) Balance Sheets (tons) Supply & Demand (bales) Supply & Demand (tons) List of Charts and Tables A Index & NY Nearby Chinese Prices Indian Prices Pakistani Prices 16,500 17,500 18,500 19,500 20,500 21,500 110 120 130 140 150 160 cents/lb RMB/ton 60.00 65.00 70.00 75.00 80.00 85.00 90.00 95.00 100.00 105.00 110.00 60 70 80 90 100 110 A Index NY Nearby One Year of Daily A Index and NY Nearby Prices cents/lb One Year of Daily CC Index (Grade 328) Prices local terms (RMB/ton)cents/lb
- 4. MONTHLY ECONOMIC LETTER | JULY 2014 Note: Movement in prices in cents/lb and local terms will not be identical due to changes in exchange rates. Note: Differences in price movement in local and international terms (cents/lb) due to changes in exchange rates. return to list of charts and tables 4,000 5,000 6,000 7,000 8,000 9,000 60 70 80 90 100 110 cents/lb PKR/maund 30,000 35,000 40,000 45,000 50,000 55,000 70 80 90 100 110 120 cents/lb INR/candy One Year of Daily Indian Spot Prices (Shankar-6 Variety) cents/lb One Year of Daily Pakistani Spot Prices cents/lb local terms (INR/candy, candy=355.62 kg) local terms (PKR/maund, maund = 37.32 kg)
- 5. MONTHLY ECONOMIC LETTER | JULY 2014 Note: Differences in price movement in local and international terms (cents/lb) due to changes in exchange rates. return to list of charts and tables 17,000 18,500 20,000 21,500 23,000 24,500 26,000 120 130 140 150 160 170 180 cents/lb RMB/ton 60.00 80.00 100.00 120.00 140.00 160.00 180.00 60 80 100 120 140 160 180 A Index NY Nearby Three Years of Monthy A Index and NY Nearby Prices cents/lb Three Years of Monthly CC Index (Grade 328) Prices local terms (RMB/ton)cents/lb
- 6. MONTHLY ECONOMIC LETTER | JULY 2014 Note: Differences in price movement in local and international terms (cents/lb) due to changes in exchange rates. return to list of charts and tables 30,000 35,000 40,000 45,000 50,000 55,000 60,000 65,000 70 80 90 100 110 120 130 cents/lb INR/candy Three Years of Monthly Indian Spot Prices (Shankar-6 Variety) cents/lb local terms (INR/candy, candy=355.62 kg) 5,000 5,500 6,000 6,500 7,000 7,500 8,000 8,500 9,000 60 70 80 90 100 110 120 130 cents/lb PKR/maund Three Years of Monthly Pakistani Spot Prices cents/lb local terms (PKR/maund, maund = 37.32 kg)
- 7. MONTHLY ECONOMIC LETTER | JULY 2014 World Balance Sheet million 480 lb. bales 2010/11 2011/12 2012/13 2013/14 2014/15 2014/15 June July Beginning Stocks 47.1 50.4 73.5 90.0 99.0 100.6 Production 117.0 126.6 123.0 118.3 115.9 116.4 Supply 164.1 177.0 196.4 208.4 214.9 217.0 Mill-Use 114.7 103.1 106.8 108.5 112.3 111.3 Ending Stocks 50.4 73.5 90.0 100.6 102.7 105.7 Stocks/Use Ratio 43.9% 71.3% 84.3% 92.7% 91.5% 94.9% World-Less-China Balance Sheet million 480 lb. bales 2010/11 2011/12 2012/13 2013/14 2014/15 2014/15 June July Beginning Stocks 32.9 39.8 42.4 39.7 38.7 39.2 Production 86.5 92.6 88.0 86.3 86.4 86.9 Imports 24.4 20.6 25.9 27.0 27.6 27.5 Supply 143.8 153.0 156.2 153.0 152.7 153.7 Mill-Use 68.7 65.1 70.8 74.0 75.3 74.8 Exports 35.3 45.8 46.6 40.4 35.5 35.5 Demand 104.0 110.9 117.4 114.4 110.8 110.4 Ending Stocks 39.8 42.4 39.7 39.2 42.0 43.4 Stocks/Use Ratio 38.2% 38.2% 33.8% 34.3% 37.9% 39.3% China Balance Sheet million 480 lb. bales 2010/11 2011/12 2012/13 2013/14 2014/15 2014/15 June July Beginning Stocks 14.2 10.6 31.1 50.4 60.3 61.3 Production 30.5 34.0 35.0 32.0 29.5 29.5 Imports 12.0 24.5 20.3 13.5 8.0 8.0 Supply 56.7 69.1 86.4 95.9 97.8 98.8 Mill-Use 46.0 38.0 36.0 34.5 37.0 36.5 Exports 0.1 0.1 0.0 0.1 0.1 0.1 Demand 46.1 38.1 36.0 34.6 37.1 36.6 Ending Stocks 10.6 31.1 50.4 61.3 60.8 62.3 Stocks/Use Ratio 23.0% 82.0% 140.0% 177.0% 164.0% 170.3% Source: USDA return to list of charts and tables
- 8. MONTHLY ECONOMIC LETTER | JULY 2014 India Balance Sheet million 480 lb. bales 2010/11 2011/12 2012/13 2013/14 2014/15 2014/15 June July Beginning Stocks 9.7 11.8 10.9 12.0 11.0 11.0 Production 27.2 29.0 28.5 30.5 28.5 28.0 Imports 0.5 0.6 1.2 0.8 1.0 1.1 Supply 37.3 41.4 40.6 43.2 40.5 40.1 Mill-Use 20.6 19.5 21.9 23.8 24.3 24.3 Exports 5.0 11.1 7.8 9.0 5.7 5.5 Demand 25.6 30.5 29.6 32.8 30.0 29.8 Ending Stocks 11.8 10.9 12.0 11.0 10.5 10.3 Stocks/Use Ratio 46.0% 36.0% 40.0% 33.0% 35.1% 34.7% U.S. Balance Sheet million 480 lb. bales 2010/11 2011/12 2012/13 2013/14 2014/15 2014/15 June July Beginning Stocks 2.9 2.6 3.4 3.9 2.7 2.7 Production 18.1 15.6 17.3 12.9 15.0 16.5 Imports 0.0 0.0 0.0 0.0 0.0 0.0 Supply 21.1 18.2 20.7 16.8 17.7 19.2 Mill-Use 3.9 3.3 3.5 3.6 3.7 3.8 Exports 14.4 11.7 13.0 10.5 9.7 10.2 Demand 18.3 15.0 16.5 14.1 13.4 14.0 Ending Stocks 2.6 3.4 3.9 2.7 4.3 5.2 Stocks/Use Ratio 14.0% 22.0% 24.0% 19.0% 32.1% 37.1% Pakistan Balance Sheet million 480 lb. bales 2010/11 2011/12 2012/13 2013/14 2014/15 2014/15 June July Beginning Stocks 3.0 2.5 2.8 2.9 2.7 2.6 Production 8.6 10.6 9.3 9.5 9.5 9.5 Imports 1.4 0.9 2.2 1.5 2.5 2.2 Supply 13.1 14.0 14.3 13.9 14.7 14.3 Mill-Use 9.9 10.0 11.0 10.7 11.3 11.0 Exports 0.7 1.2 0.5 0.6 0.5 0.5 Demand 10.6 11.2 11.5 11.3 11.8 11.5 Ending Stocks 2.5 2.8 2.9 2.6 3.0 2.8 Stocks/Use Ratio 24.0% 25.0% 25.0% 23.0% 25.2% 24.5% Source: USDA return to list of charts and tables
- 9. MONTHLY ECONOMIC LETTER | JULY 2014 World Cotton Production million 480 lb. bales 2010/11 2011/12 2012/13 2013/14 2014/15 2014/15 June July China 30.5 34.0 35.0 32.0 29.5 29.5 India 27.2 29.0 28.5 30.5 28.5 28.0 United States 18.1 15.6 17.3 12.9 15.0 16.5 Pakistan 8.6 10.6 9.3 9.5 9.5 9.5 Brazil 9.0 8.7 6.0 7.8 8.3 8.0 Uzbekistan 4.1 4.2 4.5 4.2 4.2 4.2 Turkey 2.1 3.4 2.7 2.3 2.9 2.9 Australia 4.2 5.5 4.6 4.1 3.1 2.7 Turkmenistan 1.8 1.4 1.6 1.5 1.5 1.5 Greece 0.9 1.3 1.2 1.4 1.4 1.4 Argentina 1.4 1.0 0.8 1.2 1.2 1.2 Burkina 0.7 0.8 1.2 1.2 1.1 1.1 Mexico 0.7 1.2 1.0 0.9 1.1 1.1 Rest of World 7.7 9.9 9.3 8.9 8.7 8.8 African Franc Zone 2.1 3.0 3.9 4.0 3.9 3.9 EU-27 1.2 1.6 1.5 1.6 1.7 1.7 World 117.0 126.6 123.0 118.3 115.9 116.4 World Cotton Exports million 480 lb. bales 2010/11 2011/12 2012/13 2013/14 2014/15 2014/15 June July United States 14.4 11.7 13.0 10.5 9.7 10.2 India 5.0 11.1 7.8 9.0 5.7 5.5 Brazil 2.0 4.8 4.3 2.3 3.3 3.4 Australia 2.5 4.6 6.2 4.5 3.1 3.3 Uzbekistan 2.7 2.5 3.2 2.7 2.5 2.5 Greece 0.8 1.0 1.2 1.2 1.2 1.1 Burkina 0.7 0.7 1.2 1.2 1.1 1.0 Mali 0.5 0.6 0.9 0.8 0.9 0.9 Malaysia 0.1 1.0 0.7 0.8 0.8 0.8 Turkmenistan 1.1 0.8 1.0 0.8 0.8 0.7 Cote d'Ivoire 0.3 0.4 0.7 0.7 0.6 0.6 Cameroon 0.2 0.3 0.4 0.5 0.5 0.5 Pakistan 0.7 1.2 0.5 0.6 0.5 0.5 Rest of World 4.7 5.3 5.7 5.0 5.1 4.9 African Franc Zone 2.0 2.3 3.8 3.8 3.7 3.5 EU-27 1.1 1.4 1.6 1.5 1.5 1.4 World 35.5 45.9 46.7 40.5 35.6 35.6 Source: USDA return to list of charts and tables
- 10. MONTHLY ECONOMIC LETTER | JULY 2014 World Cotton Consumption million 480 lb. bales 2010/11 2011/12 2012/13 2013/14 2014/15 2014/15 June July China 46.0 38.0 36.0 34.5 37.0 36.5 India 20.6 19.5 21.9 23.8 24.3 24.3 Pakistan 9.9 10.0 11.0 10.7 11.3 11.0 Turkey 5.6 5.6 6.1 6.3 6.4 6.4 Bangladesh 4.2 3.5 3.9 4.2 4.3 4.3 Brazil 4.3 4.0 4.1 4.2 4.2 4.0 United States 3.9 3.3 3.5 3.6 3.7 3.8 Vietnam 1.6 1.7 2.3 3.0 2.9 2.9 Indonesia 2.4 2.3 2.6 2.7 2.7 2.7 Mexico 1.7 1.7 1.8 1.9 1.8 1.8 Thailand 1.7 1.3 1.5 1.5 1.7 1.6 Uzbekistan 1.3 1.4 1.5 1.5 1.5 1.5 South Korea 1.0 1.1 1.3 1.3 1.3 1.3 Rest of World 10.6 9.8 9.6 9.4 9.3 9.3 African Franc Zone 0.1 0.1 0.1 0.1 0.1 0.1 EU-27 1.1 0.9 0.9 0.9 1.0 0.9 World 114.7 103.1 106.8 108.5 112.3 111.3 World Cotton Imports million 480 lb. bales 2010/11 2011/12 2012/13 2013/14 2014/15 2014/15 June July China 12.0 24.5 20.3 13.5 8.0 8.0 Bangladesh 4.3 3.3 3.9 4.1 4.3 4.4 Turkey 3.4 2.4 3.7 4.5 3.8 3.9 Vietnam 1.6 1.6 2.4 3.3 2.9 2.9 Indonesia 2.4 2.3 2.6 2.7 2.8 2.8 Pakistan 1.4 0.9 2.2 1.5 2.5 2.2 Thailand 1.8 1.3 1.5 1.6 1.7 1.6 South Korea 1.0 1.2 1.3 1.3 1.3 1.4 India 0.5 0.6 1.2 0.8 1.0 1.1 Malaysia 0.3 1.1 0.8 1.1 1.0 1.1 Mexico 1.2 1.0 1.0 1.0 1.1 1.1 Taiwan 0.8 0.9 0.9 0.9 0.9 0.9 Egypt 0.6 0.3 0.2 0.4 0.5 0.4 Rest of World 5.3 3.8 4.1 4.0 3.9 3.9 African Franc Zone 0.0 0.0 0.0 0.0 0.0 0.0 EU-27 1.1 0.9 0.9 0.9 0.9 0.9 World Total 36.4 45.1 46.2 40.5 35.6 35.5 Source: USDA return to list of charts and tables
- 11. MONTHLY ECONOMIC LETTER | JULY 2014 World Balance Sheet million metric tons 2010/11 2011/12 2012/13 2013/14 2014/15 2014/15 June July Beginning Stocks 10.3 11.0 16.0 19.6 21.6 21.9 Production 25.5 27.6 26.8 25.8 25.2 25.3 Supply 35.7 38.5 42.8 45.4 46.8 47.2 Mill-Use 25.0 22.4 23.2 23.6 24.4 24.2 Ending Stocks 11.0 16.0 19.6 21.9 22.4 23.0 Stocks/Use Ratio 43.9% 71.3% 84.3% 92.7% 91.5% 94.9% World-Less-China Balance Sheet million metric tons 2010/11 2011/12 2012/13 2013/14 2014/15 2014/15 June July Beginning Stocks 7.2 8.7 9.2 8.6 8.4 8.5 Production 18.8 20.2 19.1 18.8 18.8 18.9 Imports 5.3 4.5 5.6 5.9 6.0 6.0 Supply 31.3 33.3 34.0 33.3 33.2 33.5 Mill-Use 15.0 14.2 15.4 16.1 16.4 16.3 Exports 7.7 10.0 10.2 8.8 7.7 7.7 Demand 22.7 24.1 25.6 24.9 24.1 24.0 Ending Stocks 8.7 9.2 8.6 8.5 9.1 9.5 Stocks/Use Ratio 38.2% 38.2% 33.8% 34.3% 37.9% 39.3% China Balance Sheet million metric tons 2010/11 2011/12 2012/13 2013/14 2014/15 2014/15 June July Beginning Stocks 3.1 2.3 6.8 11.0 13.1 13.3 Production 6.6 7.4 7.6 7.0 6.4 6.4 Imports 2.6 5.3 4.4 2.9 1.7 1.7 Supply 12.4 15.1 18.8 20.9 21.3 21.5 Mill-Use 10.0 8.3 7.8 7.5 8.1 7.9 Exports 0.0 0.0 0.0 0.0 0.0 0.0 Demand 10.0 8.3 7.8 7.5 8.1 8.0 Ending Stocks 2.3 6.8 11.0 13.3 13.2 13.6 Stocks/Use Ratio 23.0% 82.0% 140.0% 177.0% 164.0% 170.3% Source: USDA return to list of charts and tables
- 12. MONTHLY ECONOMIC LETTER | JULY 2014 India Balance Sheet million metric tons 2010/11 2011/12 2012/13 2013/14 2014/15 2014/15 June July Beginning Stocks 2.1 2.6 2.4 2.6 2.4 2.4 Production 5.9 6.3 6.2 6.6 6.2 6.1 Imports 0.1 0.1 0.3 0.2 0.2 0.2 Supply 8.1 9.0 8.8 9.4 8.8 8.7 Mill-Use 4.5 4.2 4.8 5.2 5.3 5.3 Exports 1.1 2.4 1.7 2.0 1.2 1.2 Demand 5.6 6.6 6.4 7.1 6.5 6.5 Ending Stocks 2.6 2.4 2.6 2.4 2.3 2.2 Stocks/Use Ratio 46.0% 36.0% 40.0% 33.0% 35.1% 34.7% U.S. Balance Sheet million metric tons 2010/11 2011/12 2012/13 2013/14 2014/15 2014/15 June July Beginning Stocks 0.6 0.6 0.7 0.8 0.6 0.6 Production 3.9 3.4 3.8 2.8 3.3 3.6 Imports 0.0 0.0 0.0 0.0 0.0 0.0 Supply 4.6 4.0 4.5 3.7 3.9 4.2 Mill-Use 0.8 0.7 0.8 0.8 0.8 0.8 Exports 3.1 2.6 2.8 2.3 2.1 2.2 Demand 4.0 3.3 3.6 3.1 2.9 3.0 Ending Stocks 0.6 0.7 0.8 0.6 0.9 1.1 Stocks/Use Ratio 14.0% 22.0% 24.0% 19.0% 32.1% 37.1% Pakistan Balance Sheet million metric tons 2010/11 2011/12 2012/13 2013/14 2014/15 2014/15 June July Beginning Stocks 0.7 0.5 0.6 0.6 0.6 0.6 Production 1.9 2.3 2.0 2.1 2.1 2.1 Imports 0.3 0.2 0.5 0.3 0.5 0.5 Supply 2.9 3.1 3.1 3.0 3.2 3.1 Mill-Use 2.2 2.2 2.4 2.3 2.5 2.4 Exports 0.1 0.3 0.1 0.1 0.1 0.1 Demand 2.3 2.4 2.5 2.4 2.6 2.5 Ending Stocks 0.5 0.6 0.6 0.6 0.6 0.6 Stocks/Use Ratio 24.0% 25.0% 25.0% 23.0% 25.2% 24.5% Source: USDA return to list of charts and tables
- 13. MONTHLY ECONOMIC LETTER | JULY 2014 World Cotton Production million metric tons 2010/11 2011/12 2012/13 2013/14 2014/15 2014/15 June July China 6.6 7.4 7.6 7.0 6.4 6.4 India 5.9 6.3 6.2 6.6 6.2 6.1 United States 3.9 3.4 3.8 2.8 3.3 3.6 Pakistan 1.9 2.3 2.0 2.1 2.1 2.1 Brazil 2.0 1.9 1.3 1.7 1.8 1.7 Uzbekistan 0.9 0.9 1.0 0.9 0.9 0.9 Turkey 0.5 0.7 0.6 0.5 0.6 0.6 Australia 0.9 1.2 1.0 0.9 0.7 0.6 Turkmenistan 0.4 0.3 0.3 0.3 0.3 0.3 Greece 0.2 0.3 0.3 0.3 0.3 0.3 Argentina 0.3 0.2 0.2 0.3 0.3 0.3 Burkina 0.1 0.2 0.3 0.3 0.2 0.2 Mexico 0.2 0.3 0.2 0.2 0.2 0.2 Rest of World 1.7 2.1 2.0 1.9 1.9 1.9 African Franc Zone 0.5 0.6 0.8 0.9 0.8 0.8 EU-27 0.3 0.3 0.3 0.3 0.4 0.4 World 25.5 27.6 26.8 25.8 25.2 25.3 World Cotton Exports million metric tons 2010/11 2011/12 2012/13 2013/14 2014/15 2014/15 June July United States 3.1 2.6 2.8 2.3 2.1 2.2 India 1.1 2.4 1.7 2.0 1.2 1.2 Brazil 0.4 1.0 0.9 0.5 0.7 0.7 Australia 0.5 1.0 1.3 1.0 0.7 0.7 Uzbekistan 0.6 0.5 0.7 0.6 0.5 0.5 Greece 0.2 0.2 0.3 0.3 0.3 0.2 Burkina 0.1 0.1 0.3 0.3 0.2 0.2 Mali 0.1 0.1 0.2 0.2 0.2 0.2 Malaysia 0.0 0.2 0.2 0.2 0.2 0.2 Turkmenistan 0.2 0.2 0.2 0.2 0.2 0.1 Cote d'Ivoire 0.1 0.1 0.1 0.2 0.1 0.1 Cameroon 0.0 0.1 0.1 0.1 0.1 0.1 Pakistan 0.1 0.3 0.1 0.1 0.1 0.1 Rest of World 1.0 1.2 1.2 1.1 1.1 1.1 African Franc Zone 0.4 0.5 0.8 0.8 0.8 0.8 EU-27 0.2 0.3 0.3 0.3 0.3 0.3 World 7.7 10.0 10.2 8.8 7.7 7.7 Source: USDA return to list of charts and tables
- 14. MONTHLY ECONOMIC LETTER | JULY 2014 World Cotton Consumption million metric tons 2010/11 2011/12 2012/13 2013/14 2014/15 2014/15 June July China 10.0 8.3 7.8 7.5 8.1 7.9 India 4.5 4.2 4.8 5.2 5.3 5.3 Pakistan 2.2 2.2 2.4 2.3 2.5 2.4 Turkey 1.2 1.2 1.3 1.4 1.4 1.4 Bangladesh 0.9 0.8 0.8 0.9 0.9 0.9 Brazil 0.9 0.9 0.9 0.9 0.9 0.9 United States 0.8 0.7 0.8 0.8 0.8 0.8 Vietnam 0.4 0.4 0.5 0.7 0.6 0.6 Indonesia 0.5 0.5 0.6 0.6 0.6 0.6 Mexico 0.4 0.4 0.4 0.4 0.4 0.4 Thailand 0.4 0.3 0.3 0.3 0.4 0.3 Uzbekistan 0.3 0.3 0.3 0.3 0.3 0.3 South Korea 0.2 0.2 0.3 0.3 0.3 0.3 Rest of World 2.3 2.1 2.1 2.1 2.0 2.0 African Franc Zone 0.0 0.0 0.0 0.0 0.0 0.0 EU-27 0.2 0.2 0.2 0.2 0.2 0.2 World Total 25.0 22.4 23.2 23.6 24.4 24.2 World Cotton Imports million metric tons 2010/11 2011/12 2012/13 2013/14 2014/15 2014/15 June July China 2.6 5.3 4.4 2.9 1.7 1.7 Bangladesh 0.9 0.7 0.8 0.9 0.9 0.9 Turkey 0.7 0.5 0.8 1.0 0.8 0.8 Vietnam 0.3 0.4 0.5 0.7 0.6 0.6 Indonesia 0.5 0.5 0.6 0.6 0.6 0.6 Pakistan 0.3 0.2 0.5 0.3 0.5 0.5 Thailand 0.4 0.3 0.3 0.3 0.4 0.4 South Korea 0.2 0.3 0.3 0.3 0.3 0.3 India 0.1 0.1 0.3 0.2 0.2 0.2 Malaysia 0.1 0.2 0.2 0.2 0.2 0.2 Mexico 0.3 0.2 0.2 0.2 0.2 0.2 Taiwan 0.2 0.2 0.2 0.2 0.2 0.2 Egypt 0.1 0.1 0.1 0.1 0.1 0.1 Rest of World 1.2 0.8 0.9 0.9 0.8 0.8 African Franc Zone 0.0 0.0 0.0 0.0 0.0 0.0 EU-27 0.2 0.2 0.2 0.2 0.2 0.2 World Total 7.9 9.8 10.1 8.8 7.7 7.7 Source: USDA return to list of charts and tables