SlideShare ist ein Scribd-Unternehmen logo
1 von 11
Downloaden Sie, um offline zu lesen
Stock Idea – Asian Paints Ltd.


Vol. 1 / 11-12                                                                                                                                 April 5, 2011


Buy                                                                                                     CMP: 2529.65                   Target: 3014.0


ASIAN PAINTS LTD.                                                                                       Upside: 19.2 %                 Horizon: 9-12 M


Analyst:                                   Atul Kanwar
Phone:                         +91 11 66272300 Ext: 651       About the Company
Email:                      atulkanwar@bajajcapital.com
                                                              Asian Paints Ltd. is India’s largest and Asia’s third largest paint company. This company,
Head of Research:                            Alok Agarwala    established in 1942 has been a market leader in the paints industry in India since 1968. Today it is
E-mail:                            aloka@bajajcapital.com     almost triple the size of its nearest rival in India. Asian Paints manufactures a wide range of paints
                                                              for decorative and industrial (including automotive) use. The fully integrated company is ranked
Key Data (Consolidated)                                       among the top ten decorative coatings companies in the world. Apart from these the company also
Sector                                                Paint   manufactures various accessories like wall primer, wood primer, putty etc. Asian Paints had
Face value (Rs.)                                      10.0    acquired Berger International in order to expand its reach in the overseas market.
52-week high/low (Rs.)                     3027.3 / 2008.0
                                                              The Indian paint market
Market cap (Rs. cr.)                              24264.4
Book value (Rs.)                                     250.3
Price / book value                                    10.1                                 Decorative      Industrial (including automotive)
PE ratio (TTM)                                        26.8
Market cap / sales                                     3.2
Dividend (%)                                            85
Average daily volume (1 Y)                          96950
Beta                                                  0.14
1 year return (%)                                     25.2                                          25%


Shareholding Pattern

        Promoter            FII      DII        Others
                                                                                                                         75%

                   21..7%

           11.4%                     52.3%

               14.6%


Source: BSE. As on Dec 31, 2010
                                                              Investment Rationale
Stock Performance
  160                                                         Robust demand in the Indian market
  140                                                         As India is the second fastest growing economy in the world, with a GDP growth of about 8.5%
  120
  100
                                                              expected in FY2011, the outlook for the paint industry remains good. The Indian paint demand
   80                                                         that was excellent till July 2010, faltered in August and September of that year due to the
   60                                                         continuing rains. But it has again revived since October 2010. The rural and small town demand is
   40                                                         significantly better than that of the large towns. Volumes in the paint industry are expected to grow
   20
   0
                                                              at a CAGR of 16% in FY2012 and Asian Paints is expected to exceed the industry growth rate.
                                                              Underlying demand conditions in decorative paints continues to be robust across markets driven
                                                              by economic recovery, shorter repainting cycles and continuing strong demand in tier-II and III
                                                              cities. Expansion in the housing and construction sectors would drive the demand for the paint
                    Asian Paints             NSE              industry going forward.

                                                                                                                                                        1
                                                               Bajaj Capital Centre for Investment Research
Stock Idea – Asian Paints Ltd.


The Indian paint industry has grown at an        India paint industry: growth in volumes
average of 15.3% from FY05 to FY10.


                                                                                    18%        18%
                                                                                                                   16%                      16%
                                                                         14%                               13%                   14%
                                                              13%


                                                           FY05       FY06       FY07        FY08        FY09    FY10          FY11E     FY12E

                                                                                                                                              Source: Company


                                                 Asian Paints is a giant of the Indian paint industry
                                                 Asian Paints is the clear market leader in the Indian paints industry with about 32.4% market
                                                 share. The top four players that include Berger, Kansai & ICI (Akzo Nobel) apart from Asian
                                                 Paints, have cornered around 60% of the total market share. Other players in the organized sector
                                                 account for only 5% of the industry market share. The unorganized sector is a large one but is very
                                                 fragmented, constituting 35% of the total paints market. The organized section of the industry is
                                                 growing faster than the unorganized sector.

The competition in the paint industry is         India’s paint industry: market share of major players
becoming more intense with the entry of
foreign players like Jotun, Nippon & Sherwin              Asian Paints     Berger     Kansai        ICI (Akzo Nobel)     Others        Unorganized sector
Williams.


                                                                                     35.0%                             32.4%


                                                                                    5.0%                                10.8%
                                                                                           6.0%          10.8%


                                                                                                                                       Source: Company, BCCIR


                                                 Huge capacity addition plans
                                                 Strong volume visibility has resulted in Asian Paints continuing its streak of capacity addition. The
                                                 commercial production at its new paint manufacturing facility at Rohtak, Haryana has started. The
                                                 plant has an initial capacity of 1.5 lakh kl per annum. The project cost for setting up this capacity
                                                 was Rs ~500 cr. The plant capacity can be scaled up to 4 lakh kl per annum in future expansions.
                                                 The company is also planning to set up a manufacturing plant in northeastern parts of Andhra
                                                 Pradesh with a capacity of 1 lakhs tonnes per annum. The company is considering this location
                                                 because it is well connected with all parts of the country. Though the investment in the proposed
                                                 plant was not disclosed but the management has said that they would like to set up one of the
                                                 largest plants in India, if the Andhra Pradesh government provides them with land. The proposed
Asian Paints bought land in Maharashtra for      project will be classified under mega projects category. This decision was taken by the company
a greenfield mega project with a capacity of 4   after the state government denied permission, due to environmental concerns, to set up the plant at
lakh tonnes per annum. An amount of Rs 735       Patancheru on the outskirts of Hyderabad where the company has a manufacturing facility and
cr would be spent on the project in 5 years.     wanted to go in for brownfield expansion.


                                                                                                                                                  2
                                                   Bajaj Capital Centre for Investment Research
Stock Idea – Asian Paints Ltd.


Asian Paints may look at further hike in prices   Price hike
if raw material prices continue to move up.       To pass on the rise in raw material costs, Asian Paints has gone in for multiple price increase. The
                                                  company has affected four price hikes in FY2011 i.e. 4.15% on May 1, 2.6% on July 1, 1.2% on
                                                  August 1, and 2.9% in December 2010. The price hike has been the highest in the past 10 years,
                                                  Asian Paints is the price leader and other players in the industry follow with a lag. Broadly, price
                                                  hikes by all players have been similar. The paint industry in the past has been able to raise prices in
                                                  line with the rise in inflation without having a significant impact on volumes.

                                                  Asian Paints: price hikes over the years


                                                                                                                          4.2%

                                                       2.5%                                                                      2.6%              2.9%

                                                            1.4%                                                                      1.2%


                                                              -1.8%        -2.0%             -2.3%

                                                                   -5.1%

                                                                                                                                        Source: Company

                                                  In-house manufacturing of raw material
                                                  Most paint companies are hit by the fact that they do not make raw materials themselves. For
                                                  example, Phthalic Anhydride (PAN) is manufactured from orthoxylene, which goes into the
Asian Paints benefits by selling Phthalic         production of paints along with titanium dioxide. Asian Paints is the only paint company in India
Anhydride (PAN) in the open market.               that manufactures PAN. The other industry players have to import this stock. Since PAN prices
                                                  generally outpace international orthoxylene prices by ~50%, paint companies end up paying a
                                                  fortune when prices rise

                                                  Shift to enamels & emulsion would lead to significant growth
                                                  Growth is expected in future, in the paints industry through an increase in enamels and emulsion
                                                  use. At present 19% of the revenue in the industry is realized through the distemper segment. But
                                                  going ahead, the share of distemper is expected to come down, while that of enamels and emulsion
                                                  is expected to go up. This would lead to better realizations and higher margins for the company.

                                                  Revenue breakdown of Indian paint industry (FY10)


                                                              Enamels        Distemper        Interior Emulsion   Exterior Emulsion      Wood Finish

                                                                                                           2%

                                                                                                     12%

                                                                                         17%
                                                                                                                    50%


                                                                                               19%


                                                                                                                                        Source: Company


                                                  Extensive distribution network
Almost half of the revenues earned by the         Asian Paints has a very large distribution network in India. It boasts of 90 depots across the
Indian paint industry are through enamels.        country. It has over 27,000 retailers as compared to 6,500 of Kansai Nerolac.

                                                                                                                                               3
                                                    Bajaj Capital Centre for Investment Research
Stock Idea – Asian Paints Ltd.


Industrial coating accounts for ~25% of the   Second JV with PPG industries
~Rs 17,000 cr paints segment and has a high   Asian Paints approved plans to enhance its fourteen year relationship with PPG Industries Inc,
presence of unorganized players. Major        USA, to accelerate growth of the non-decorative coatings businesses in India. As part of this
organized players in this segment include     arrangement, Asian Paints and PPG will enhance their existing non-decorative coatings presence
Kansai Nerolac, ICI and Jotun Paints apart    in India by expanding their current 50-50 joint venture relationship - Asian PPG Industries Ltd
from Asian Paints Industrial Coating Ltd.     (APPG) and also establish a second 50-50 joint venture. The modalities are being worked on. The
(APICL), a 100% subsidiary of Asian Paints.   arrangement is subject to regulatory approval and is expected to be completed during CY2011.
                                              APPG currently services the Indian transportation coatings markets and this change will expand its
                                              scope to additionally service the marine and consumer packaging markets. The second joint
                                              venture will service the industrial containers and light industrial coatings markets. The two joint
                                              ventures together will serve all customers for non-decorative products in the Indian market. The
                                              JV's would leverage PPG's technology and global customer relationships while continuing to build
                                              on Asian Paints' customer base, manufacturing footprint, distribution channels and local
                                              relationships. Asian Paints and PPG have agreed that Asian Paints will take the lead in the second
                                              venture and PPG will take the lead in APPG in order to utilize their respective strengths to best
                                              capture the growth in infrastructure development and the economic boom in India.

                                              Geographically diversified
                                              The Asian Paints group operates in five regions across the world i.e. South Asia, South East Asia,
                                              South Pacific, Middle East & Caribbean through its five corporate brands viz. Asian Paints, Berger
                                              International, SCIB Paints, Apco Coatings and Taubmans. The company along with its
                                              subsidiaries has operations in 17 countries across the world with 23 paint manufacturing facilities,
                                              servicing consumers in 65 countries. It is the largest paint company in eleven countries.


                                              International operations: regional sales contribution (FY2010)


                                                            Middle East         Caribbean        South Asia      South East Asia      South Pacific


Middle East accounts for the majority of
Asian Paints’ international sales
                                                                                                 7.0%
                                                                                        7.9%

                                                                        15.4%
                                                                                                                              53.6%


                                                                                16.1%


                                                                                                                                           Source: Company


                                              International operations: countries

                                                               Region                                                Countries
                                               Middle East                                 Egypt, Oman, Bahrain & UAE
                                               Caribbean                                   Barbados, Jamaica, Trinidad & Tobago
                                               South Asia                                  Bangladesh, Nepal & Sri Lanka
In   9MFY11,     International operations
accounted for Rs 756.7 cr or ~13% of Asian     South East Asia                             Singapore
Paints’ sales.
                                               South Pacific                               Fiji, Solomon Islands, Samoa, Tonga & Vanuatu
                                                                                                                                           Source: Company


                                                                                                                                                4
                                                Bajaj Capital Centre for Investment Research
Stock Idea – Asian Paints Ltd.


For 9MFY11, net sales of the company            Financial Performance
jumped by 19.5% to Rs 5740.6 cr, compared
to Rs 4804.2 cr in 9MFY10.                      Decent Q3FY11 results
                                                On a standalone basis, the company posted a growth of 15.6% in its APAT for the quarter ended
                                                December 31, 2010 at Rs 206.6 cr as compared to Rs 178.7 cr for the corresponding quarter of the
                                                previous year. Its net sales surged by 37.3% at Rs 1754.2 cr, compared to Rs 1277.7 cr for the
                                                similar quarter of the previous year due to a robust decorative paints segment. On consolidated
                                                basis, the group has posted a APAT attributable to shareholders of Rs 220.3 cr for the quarter
                                                ended December 31, 2010 as compared to Rs 198.6 cr for the quarter ended December 31, 2009,
                                                rising by 11.0%. Its consolidated net sales has increased 29.6% to Rs 2099.6 cr for the quarter
                                                ended December 31, 2010 from Rs 1620.0 cr for the December quarter of 2009.

                                                Consensus EPS forecast

                                                                       Financial Year                                       Consensus Forecast
                                                                          FY 2011                                                    94.4
                                                                          FY 2012                                                  113.9

                                                Net sales performance (consolidated)

                                                   2500.0                                                                                    2099.6   40.0%
                                                                                                              1876.8      1830.2   1810.8
                                                   2000.0                               1723.9   1620.0                                               30.0%
                                                               1422.6      1460.2
                                                   1500.0                                                     31.9%
                                                                25.2%                                                    25.3%                        20.0%
                                                   1000.0                                          22.5%                                     29.6%
                                                                            17.5%       16.8%                                        5.0%
                                                    500.0                                                                                             10.0%

The net sales performance of Asian Paints             0.0                                                                                             0.0%
dipped YoY in Q2FY11 due to prolonged                          Q4FY10 Q1FY10 Q2FY10 Q3FY10 Q4FY10 Q1FY11 Q2FY11 Q3FY11
monsoon and delayed festival season, but the
sales staged a smart recovery in Q3FY11.                                                Net sales (Rs cr)             % increase (YoY)

                                                Operating profit performance (consolidated)

                                                   500.0                                410.2                                                         25.0%
                                                                          20.0%                   334.9                  365.5       356.4   364.3
                                                   400.0                                23.8%                 332.5                                   20.0%
                                                                           291.4                                         20.0%
                                                   300.0                                          20.7%       17.7%                  19.7%   17.3%    15.0%
                                                              188.9
                                                   200.0                                                                                              10.0%
                                                              13.3%
                                                   100.0                                                                                              5.0%
                                                     0.0                                                                                              0.0%
                                                              Q4FY10 Q1FY10 Q2FY10 Q3FY10 Q4FY10 Q1FY11 Q2FY11 Q3FY11

                                                                                   Operating profit (Rs cr)             Operating margins

                                                APAT performance (consolidated)


                                                   300.0                                268.4                                                         20.0%
                                                   250.0                                                                  222.2      214.7   220.3
                                                                                                   198.4      192.0                                   15.0%
                                                   200.0                   176.1        15.6%
                                                   150.0       102.2                                                     12.1%       11.9%            10.0%
                                                                           12.1%                  12.2%       10.2%                          10.5%
                                                   100.0
                                                               7.2%                                                                                   5.0%
                                                    50.0
                                                     0.0                                                                                              0.0%
Asian Paints is expected to sustain operating
                                                              Q4FY10 Q1FY10 Q2FY10 Q3FY10 Q4FY10 Q1FY11 Q2FY11 Q3FY11
margins at 16-18% levels going forward,
aided by strong pricing power and superior
                                                                                          APAT (Rs cr)                APAT margins
product mix (higher proportion of emulsions).


                                                                                                                                                  5
                                                  Bajaj Capital Centre for Investment Research
Stock Idea – Asian Paints Ltd.


Though the APAT has remained steady for the      Paints products: volume growth
past few quarters, the APAT margins have
shown a dip due to high raw material costs and      500000                                                                                          20.0%
                                                                                       17.7%                16.8%                       411369
higher depreciation.
                                                    400000                                                                    354370
                                                                                                                     316871                         15.0%
                                                               12.1%                            241903     282602                       16.1%
                                                    300000
                                                                                       220284                                 11.8%                 10.0%
                                                                           187221                                    12.1%
                                                    200000 184622                                 9.8%
                                                                                                                                                    5.0%
                                                    100000                  1.4%
                                                          0                                                                                         0.0%
                                                                  FY03      FY04        FY05     FY06       FY07     FY08     FY09      FY10

                                                                                 Production (million tonnes)            Growth (YoY)

                                                 Paints products: sales realization growth

                                                    120000                                                                                          12.0%
                                                                                                                              98972     97963
                                                    100000                                       84512     87240     90147                          10.0%
                                                                  75771    78946       80634
                                                     80000                                                                                          8.0%
                                                                                                                               9.8%
                                                                                                  4.8%                                              6.0%
                                                     60000                  4.2%                            3.2%     3.3%
                                                                                        2.1%                                                        4.0%
                                                     40000                                                                                          2.0%
                                                     20000     -0.1%                                                                                0.0%
                                                                                                                                          -1.0%
                                                          0                                                                                         -2.0%
                                                                  FY03      FY04        FY05     FY06       FY07     FY08     FY09      FY10
 Robust performance was seen in the
 Decorative paint business though the                                          Sales realization/kilo litre (Rs)         Growth (YoY)
 Industrial paint business did not match that
 performance.

                                                 Review of Business Segments (Q3FY11)

                                                 Decorative Business
                                                         In Q3FY11 the performance was mostly good in all parts of the country.
                                                         The demand for interior and exterior emulsions was particularly good.
                                                         The demand for Enamel was higher than anticipated.

                                                 Industrial business
                                                         Demand condition for Industrial paints was challenging.
                                                         Automotive business grew in line with the market.

                                                 International operations
                                                         Demand conditions for International business was challenging in some areas. However,
                                                          South Asia has shown a decent growth.
                                                         Net Sales & operating income growth was flat in the period April – Dec 2010 compared
                                                          to 9 months of the previous year.

                                                 International operations: net sales (Rs cr)


                                                      Region                 9MFY11                        9MFY10                      Growth
                                                  Caribbean                    123.9                         129.7                      -4.4%
 South Asia outperformed. There was growth        Middle East                  401.7                         409.6                      -1.9%
 in South Pacific too. But the Caribbean and
                                                  Asia                         174.8                         142.9                      22.3%
 Middle East business was sluggish.
                                                  South Pacific                 56.3                          52.4                      7.3%


                                                                                                                                                6
                                                   Bajaj Capital Centre for Investment Research
Stock Idea – Asian Paints Ltd.


Asian Paints has better margins than its          Peer Analysis
peers. It also scores over the other paint
companies in terms of a high RONW%.               Major paint companies: strengths

                                                        Company                                                             Strengths
                                                   Asian Paints              Market leader in the paints industry
                                                   ICI (Akzo Nobel)          Strong in premium end paints/emulsion
                                                   Berger Paints             Focused on enamels and lower end paints
                                                   Kansai Nerolac            Leader in Industrial paints, with half the sales coming from auto industry
                                                   Nippon                    Largest paint manufacturer in the world with premium technology. No. 1 in China.


                                                  Paint industry majors - comparison (standalone financials in Rs cr)

                                                                             Net                   PBIDTM          APATM                    RONW                                Mkt
                                                       Company              Sales       PAT          (%)            (%)           D/E        (%)         P/E      P/BV          Cap
                                                   Akzo Nobel              1041.7       159.3            12.6             8.6      0.0          16.2     19.4        2.4        2676.2
                                                   Berger Paints           1686.5       120.1            11.0             6.6      0.1          22.9     20.9        4.0        2912.0
                                                   Kansai Nerolac          1822.0       165.5            14.4             8.4      0.1          23.2     23.4        4.6        4232.0
                                                   Asian Paints            5372.7       774.5            20.5            13.4      0.1          58.4     31.0       11.7       24260.6
                                                  P/E, P/BV & Mkt Cap figures are for March 25, 2011. Net Sales, PAT, PBIDTM (%), APATM (%) & RONW% statistics are for FY10.


On an average, raw materials account for
60% of net sales in the paints industry.
                                                  Key Concerns

                                                  Rising price of raw material
                                                  The paint industry is raw material intensive. These raw materials are of a wide variety. Rising cost
                                                  and erratic availability of raw material mark the Indian paint industry. Crude derivatives account
                                                  for about 30-35% of Asian Paint’s raw material costs.


                                                  Brent crude prices (US$)


                                                                                                                                                                115.6
                                                                                                                                                  104.0
                                                                                                                                     96.3
                                                                                                                       91.8
                                                                                           82.9          85.7
                                                               76.7          77.8


Crude prices have been in an upswing and
this is raising the cost burden of the industry            Aug-10         Sep-10        Oct-10       Nov-10         Dec-10        Jan-11        Feb-11        Mar-11
players.
                                                                                          Note: March 2011 figures are for the closing on the 25th day of that month.


                                                                                                                                                                           7
                                                    Bajaj Capital Centre for Investment Research
Stock Idea – Asian Paints Ltd.


There is a demand supply gap in case of          The input costs have shown a northward trend since Q1FY10 but the surge has been particularly
Titanium Dioxide. There is no greenfield         harsh in CY2010. Prices of raw materials like titanium dioxide, solvent and crude related inputs
capacity on the anvil and it would almost take   have increased sharply.
a couple of years before a brownfield
additional capacity starts operating. Titanium   Input cost index
dioxide accounts for 20-25% of the total input
cost.
                                                                                                                        103.9      104.5

                                                             100.0
                                                                                                               98.5
                                                                                                     94.4
                                                                                 91.7       92.7
                                                                       91.4


                                                           FY09      Q1FY10 Q2FY10 Q3FY10 Q4FY10 Q1FY11 Q2FY11 Q3FY11

                                                                                                                                     Source: Company

                                                 Slowdown in the economy
                                                 The well being of the paint industry is dependent on the growth of the economy. 75% of the
                                                 decorative paints demand comes from repainting and repainting demand depends on how well the
                                                 Indian economy is doing. Any slowdown in the real estate and the industrial growth impacts the
                                                 volumes of the paints industry negatively.
The crisis in Egypt and Bahrain would impact
Asian Paints’ business marginally. Egypt has     Advertisement and promotion spends expected to rise going forward
two manufacturing facilities and accounts for    The competition in the paint industry has intensified with new players entering the Indian market
50-53% of the company’s middle-east              This has resulted in an increase in advertisement spend of some companies in this sector. For
revenues. Bahrain has one manufacturing unit     Asian paints, the advertising and promotion spend has been ~4.5% of its net sales. But on account
and contributes 10-12% of the company’s          of higher competition and advertisement rate inflation, it may rise in the future.
middle-east sales. These two countries
together contribute ~4.5% to the net sales of
Asian Paints.
                                                 Valuation

                                                 Asian Paints is by far the largest paint company in India, with almost one-third of the total market
                                                 share. It also ranks among the top ten decorative coating companies in the world. With the Indian
                                                 economy expanding at a fast rate and the housing & infrastructure sectors expected to attract big
                                                 investments, the paint industry volumes are expected to grow at a healthy 16% in FY12.This bodes
                                                 well for Asian Paints, the market leader of the industry. The company also has huge expansion
                                                 plans. After commencing operations at its new facility in Haryana recently, it plans to set up mega
                                                 projects in Maharashtra and Andhra Pradesh. Asian Paints boasts of an extensive distribution
                                                 network comprising of 27,000 retailers. The company is fully capable of negating the increase in
                                                 price of raw materials, by increasing the price of its products. This was amply demonstrated when
                                                 it raised prices four times in CY2010. Asian Paints is also planning to start its second joint venture
                                                 with PPG Industries of USA in CY2011. These two JV’s would provide the entire spectrum of
                                                 paints for the industrial sector. A is also geographically well diversified servicing customers in 65
                                                 countries across the globe.

         .                                       Asian Paints has a market capitalization of Rs 24264.4 cr. and is trading at a share price of Rs.
                                                 2529.65. The consolidated TTM EPS is Rs. 94.4 translating into a TTM PE of 26.8. The price to
                                                 book value stands at 10.1. The stock is an attractive buy considering the growth prospects of the
                                                 industry as well as the company. We expect the company to register an EPS of Rs 115.9 for FY12
                                                 on the basis of strong volume growth and pricing power. This makes the stock currently trade at
The demand in the paint industry is seasonal
                                                 21.8x FY12.
to some extent. While the demand dips in the
monsoon season, it is the maximum in the
festive season                                   We recommend a “BUY” on the stock with an investment horizon of 9-12 months and target
                                                 price of Rs. 3014.

                                                                                                                                           8
                                                   Bajaj Capital Centre for Investment Research
Stock Idea – Asian Paints Ltd.


SWOT Analysis


                   Strengths                                                          Weaknesses

 • Market leader: Asian Paints is the largest paint                    • Industrial business performing below par: The
   company in India with a market share of 32.4%. It is                  industrial business of the company has performed below
   also the 3rd largest in Asia and among the top 10                     expectations, though the decorative business has done
   decorative paint companies in the world.                              very well. The automotive business has performed in
 • Capacity expansion plans: The company has already                     line with expectations. Subject to regulatory approvals,
   commenced its Rohtak operations recently that has a                   Asian Paints is planning to have a second joint venture
   capacity of 1.5 lakh kl per annum. In addition to this it             with PPG industries. Both the joint ventures would
   has plans for greenfield expansion of 4 lakh tonnes in                cover the entire gamut of the non-decorative paint
   Maharashtra and 1 lakh tonnes per annum in AP.                        business. Asian Paints would leverage PPG's technology
 • Pricing power: Asian paints has had four price hikes in               and customer relationships around the globe.
   CY2010. It intends to raise product prices again if the             • Hiccups in international business: The middle east
   raw material prices keep going northwards.                            business is being hampered by strife in Egypt &
 • Manufactures PAN: The company manufactures                            Bahrain.The Caribbean sales also dipped in Q3FY11.
   Phthalic Anhydride (PAN), a key raw material.                         But Asia & South Pacific business has been doing well.
 • Wide distribution network: Comprising of 90 depots                  • International presence restricted to small pockets:
   and 27,000 retailers.                                                 Asian Paints need to spread its business to big centres
                                                                         worldwide, to become a true multinational.


              Opportunities                                                                Threats

 • Fast growing Indian economy: The fast growing                       • Competition from the world majors: Major world
   Indian economy and a growth in the realty and                         players like Jotun, Nippon and Sherwin Williams are
   construction industries presents a big opportunity for                now competiting with Asian Paints in the domestic
   Asian Paints.                                                         Indian markets.
 • Shorter repainting cycles: The growing affluence of                 • Competition from the unorganized sector: The
   the Indian people is resulting in shorter repainting cycles           unorganized sector, though fragmented holds a ~35%
   benefiting the paint industry.                                        share of the Indian paint industry and gives tough
 • Growth in the tier II and III towns: The paint demand                 competition to established players.
   in these towns is growing at a faster rate than the tier I          • Rising cost of raw materials: The input costs for Asian
   cities.                                                               Paints and the other players in the industry are rising.
 • Steady growth in industry volumes: The paint industry                 The price of crude derivatives and titanium dioxide, two
   has shown an average volume growth of 15.3% in the                    key inputs has seen a sharp upswing.
   past six years and the growth is expected to be 16% in              • Slowdown in the economic growth: The paint industry
   FY12.                                                                 fortunes are positively co-related to the growth of the
 • Expected decrease in the use of distemper in future:                  economy.
   Increase in enamels & emulsion use would have a                     • Unstable political situation in middle east: This region
   positive impact on company's margins.                                 accounts for over 50% of company's international sales.


                                                                                                                                9
                                            Bajaj Capital Centre for Investment Research
Stock Idea – Asian Paints Ltd.


Financials

 Income Statement (Quarterly) Consolidated                                                     Rs. Cr.
             Particulars               Q3FY11        Q2FY11       Q3FY10       QoQ (%)       YoY (%)
 Net Sales                                2099.6        1810.8       1620.0           15.9       29.6
 Total Income                             2119.0        1835.7       1636.9           15.4       29.5
 Total Expenditure                        1754.7        1479.3       1302.0           18.6       34.8
 PBIDT                                     364.3         356.4        334.9            2.2         8.8
 PBIDT Margin %                             17.3          19.7         20.7
 Interest                                    5.9            4.6          7.9          28.3       -26.1
 Depreciation                               28.6          28.4         19.7            0.8       45.8
 Tax                                        87.9          90.2         92.3           -2.5        -4.7
 APAT                                      220.3         214.7        198.4            2.6       11.0
 APATM (%)                                  10.5          11.9         12.2


 Financials (Annual):Consolidated                                                              Rs. Cr.
                                                                                                                                  5 yr CAGR
                                        9MFY11       201003        200903       200803       200703      200603     200503             %
 Share Capital                              95.9          95.9         95.9           95.9       95.9        95.9       95.9
 Networth                                               1710.0       1203.2          982.4      777.8       646.3      567.2
 Capital Employed                                       1939.2       1511.8         1257.6     1084.0       907.5      806.7
 Debt                                                    229.2        308.6          275.2      306.2       261.3      239.5
 CWIP                                                    407.2         92.1          114.2       13.8        33.7       10.6
 Inventory                                               955.9        769.0          714.0      598.0       488.9      454.5
 Sundry Debtors                                          542.5        571.9          460.3      420.6       347.5      295.9
 Cash & Bank Balance                                     105.8        210.4          110.7      105.4        73.4       60.8
 Revenues                                 5740.6        6965.3       5719.0         4590.9     3835.9      3166.9     2673.3            21.1
 Total Income                             5803.3        7208.5       5802.8         4687.5     3960.1      3209.8     2779.9            21.0
 Total Expenditure                        4717.1        5831.2       5079.1         3970.6     3445.2      2795.7     2419.9            19.2
 PBIDT                                    1086.2        1377.3        723.7          717.0      514.9       414.2      360.0            30.8
 Interest                                   14.6          36.8         32.5           26.4       24.0        11.4       10.8            27.7
 Depreciation                               84.0          83.6         74.4           59.2       61.1        60.6       61.4             6.4
 APAT                                      657.2         785.5        395.7          411.3      284.9       211.8      171.3            35.6
 Cash Flow from Operating Activities                    1058.0        401.9          473.7      252.2       179.2      106.7
 Cash Flow from Investing Activities                     -299.0       -270.1        -334.8      -109.5     -125.0      -73.9
 Cash Flow from Financing Activities                     -331.9       -230.4        -133.6      -110.8      -41.6      -41.9
 Free Cash Flows                                         759.0        131.9          139.0      142.8        54.2       32.9
 Dividend %                                              270.0        175.0          170.0      130.0       125.0       95.0
 EPS (Rs.)                                  68.5          87.6         40.7           41.7       27.6        20.1       17.6
 Debt-Equity Ratio                                          0.2          0.3           0.3         0.4        0.4        0.3
 RoNW %                                                   57.3         36.2           45.6       36.7        31.4       29.6
 Fixed Asset Turnover Ratio                                 4.9          4.6           4.3         4.0        3.6        3.1
 PBIDT Margin %                             18.9          19.8         12.7           15.6       13.4        13.1       13.5
 APAT Margin %                              11.4          11.3           6.9           9.0         7.4        6.7        6.4


                                                                                                                             10
                                          Bajaj Capital Centre for Investment Research
Stock Idea – Asian Paints Ltd.


Disclaimer:

This document has been prepared by Bajaj Capital Centre for Investment Research (BCCIR), a unit of Bajaj Capital Limited (BCL). BCL and its subsidiaries
and associated companies form an integrated unit imparting investment banking, investment advisory and brokerage services in stocks, mutual funds, debt,
real estate, personal finance etc. Our research analysts and sales persons provide important input into our investment banking and advisory activities.

This document does not constitute an offer or solicitation for the purchase or sale of any financial instrument or as an official confirmation of any
transaction.

The information contained herein is from publicly available data or other sources believed to be reliable. We do not represent that information contained
herein is accurate or complete and it should not be relied upon as such. This document is prepared for assistance only and is not intended to be and must not
alone be taken as the basis for an investment decision. The user assumes the entire risk of any use made of this information. Each recipient of this document
should make such investigations as it deems necessary to arrive at an independent evaluation of an investment in the securities of companies referred to in
this document (including the merits and risks involved). The investment discussed or views expressed may not be suitable for all investors.

Affiliates of BCL may have issued other reports that are inconsistent with and reach to a different conclusion from the information presented in this report.

This report is not directed or intended for distribution to, or use by, any person or entity who is a citizen or resident of or located in any locality, state,
country or other jurisdiction, where such distribution, publication, availability or use would be contrary to law, regulation or which would subject BCL and
affiliates to any registration or licensing requirement within such jurisdiction. The securities described herein may or may not be eligible for sale in all
jurisdictions or to certain category of investors. Persons in whose possession this document may come are required to inform themselves of and to observe
such restriction.

BCL & affiliates may have used the information set forth herein before publication and may have positions in, may from time to time purchase or sell or may
be materially interested in any of the securities mentioned or related securities. BCL and affiliates may from time to time solicit from, or perform investment
banking, or other services for, any company mentioned herein. Without limiting any of the foregoing, in no event shall BCL, any of its affiliates or any third
party involved in, or related to, computing or compiling the information have any liability for any damages of any kind. Any comments or statements made
herein are those of the analyst and do not necessarily reflect those of BCL and affiliates.

This Document is subject to changes without prior notice and is intended only for the person or entity to which it is addressed and may contain confidential
and/or privileged material and is not for any type of circulation. Any review, retransmission, or any other use is prohibited.

Though disseminated to all the customers simultaneously, not all customers may receive this report at the same time. BCL will not treat recipients as
customers by virtue of their receiving this report.

Equity and securities investments are subject to market risks and there is no assurance or guarantee that the objectives of the investment will be achieved. As
with any investment in securities, the share price of a particular company can go up or down depending on the forces and factors affecting the capital
markets.


Disclosure of interest:

1. BCL and its affiliates do not hold paid up capital of the company.

2. The Analyst and his/her dependent family members do not hold any long or short position in the shares of the company covered as on the date of
publication of research on the subject company.


© Copyright in this document vests exclusively with BCL.

Bajaj Capital Centre for Investment Research
Bajaj Capital Ltd
97, Bajaj House, Nehru Place
New Delhi 110019
Tel 4169 3000, 4169 2900, Ext. 651
Email: bccir@bajajcapital.com


                                                                                                                                                 11
                                                Bajaj Capital Centre for Investment Research

Weitere ähnliche Inhalte

Was ist angesagt?

Asian paints finance presentation
Asian paints finance presentationAsian paints finance presentation
Asian paints finance presentationparthproy
 
Report on Asian Paints Bangladesh Ltd.
Report on Asian Paints Bangladesh Ltd.Report on Asian Paints Bangladesh Ltd.
Report on Asian Paints Bangladesh Ltd.Sadia Afroz
 
Asian Paints Case Study
Asian Paints Case StudyAsian Paints Case Study
Asian Paints Case StudyRWPromotions
 
Asian Paints - Resource Based Perspective
Asian Paints - Resource Based PerspectiveAsian Paints - Resource Based Perspective
Asian Paints - Resource Based PerspectiveYashowardhan Chaturvedi
 
PPT Asian Paints
PPT Asian PaintsPPT Asian Paints
PPT Asian Paints22hsukna
 
Asian paints ppt
Asian paints pptAsian paints ppt
Asian paints pptYuvraj Zala
 
Asian paints marketing
Asian paints marketingAsian paints marketing
Asian paints marketingMehul Rasadiya
 
Asian paints group 5
Asian paints group 5Asian paints group 5
Asian paints group 5milan agrawal
 
25112127 operational-analysis-of-asian-paints
25112127 operational-analysis-of-asian-paints25112127 operational-analysis-of-asian-paints
25112127 operational-analysis-of-asian-paintsArun Schumacher
 
Asian paints final 1
Asian paints final 1Asian paints final 1
Asian paints final 1Ajay Patel
 
asian paints financial management
asian paints financial managementasian paints financial management
asian paints financial managementharshidoshi
 
Asian Paints Business Strategy
Asian Paints Business StrategyAsian Paints Business Strategy
Asian Paints Business StrategySumeet Singh
 

Was ist angesagt? (20)

Asian paints finance presentation
Asian paints finance presentationAsian paints finance presentation
Asian paints finance presentation
 
Report on Asian Paints Bangladesh Ltd.
Report on Asian Paints Bangladesh Ltd.Report on Asian Paints Bangladesh Ltd.
Report on Asian Paints Bangladesh Ltd.
 
Asian Paints Case Study
Asian Paints Case StudyAsian Paints Case Study
Asian Paints Case Study
 
Asian paints
Asian paintsAsian paints
Asian paints
 
Asian Paints - Resource Based Perspective
Asian Paints - Resource Based PerspectiveAsian Paints - Resource Based Perspective
Asian Paints - Resource Based Perspective
 
Asian paints
Asian paintsAsian paints
Asian paints
 
Asian Paints
Asian PaintsAsian Paints
Asian Paints
 
Asian paint final ppt
Asian paint final pptAsian paint final ppt
Asian paint final ppt
 
PPT Asian Paints
PPT Asian PaintsPPT Asian Paints
PPT Asian Paints
 
asian paints
asian paintsasian paints
asian paints
 
Asian Paint
Asian Paint Asian Paint
Asian Paint
 
Asian paints ppt
Asian paints pptAsian paints ppt
Asian paints ppt
 
Asian paints-ppt- (1)
Asian paints-ppt- (1)Asian paints-ppt- (1)
Asian paints-ppt- (1)
 
Asian paints
Asian paintsAsian paints
Asian paints
 
Asian paints marketing
Asian paints marketingAsian paints marketing
Asian paints marketing
 
Asian paints group 5
Asian paints group 5Asian paints group 5
Asian paints group 5
 
25112127 operational-analysis-of-asian-paints
25112127 operational-analysis-of-asian-paints25112127 operational-analysis-of-asian-paints
25112127 operational-analysis-of-asian-paints
 
Asian paints final 1
Asian paints final 1Asian paints final 1
Asian paints final 1
 
asian paints financial management
asian paints financial managementasian paints financial management
asian paints financial management
 
Asian Paints Business Strategy
Asian Paints Business StrategyAsian Paints Business Strategy
Asian Paints Business Strategy
 

Andere mochten auch

Chic Paints Ltd (3) (1)
Chic Paints Ltd (3) (1)Chic Paints Ltd (3) (1)
Chic Paints Ltd (3) (1)William Jordan
 
Jat holdings (pvt) ltd annual report 2014-15 lowres (2)
Jat holdings (pvt) ltd   annual report 2014-15 lowres (2)Jat holdings (pvt) ltd   annual report 2014-15 lowres (2)
Jat holdings (pvt) ltd annual report 2014-15 lowres (2)Faisal Hourani
 
Osman rapor son halı
Osman rapor son halıOsman rapor son halı
Osman rapor son halıosmanbakkal
 
Asian Paints - Strategies, Entry Mode, Structure
Asian Paints - Strategies, Entry Mode, StructureAsian Paints - Strategies, Entry Mode, Structure
Asian Paints - Strategies, Entry Mode, StructureTony Sebastian
 
Internal control system
Internal control systemInternal control system
Internal control systemMadiha Hassan
 

Andere mochten auch (7)

Chic Paints Ltd (3) (1)
Chic Paints Ltd (3) (1)Chic Paints Ltd (3) (1)
Chic Paints Ltd (3) (1)
 
SANJAY
SANJAYSANJAY
SANJAY
 
Jat holdings (pvt) ltd annual report 2014-15 lowres (2)
Jat holdings (pvt) ltd   annual report 2014-15 lowres (2)Jat holdings (pvt) ltd   annual report 2014-15 lowres (2)
Jat holdings (pvt) ltd annual report 2014-15 lowres (2)
 
Osman rapor son halı
Osman rapor son halıOsman rapor son halı
Osman rapor son halı
 
Asian Paints
Asian PaintsAsian Paints
Asian Paints
 
Asian Paints - Strategies, Entry Mode, Structure
Asian Paints - Strategies, Entry Mode, StructureAsian Paints - Strategies, Entry Mode, Structure
Asian Paints - Strategies, Entry Mode, Structure
 
Internal control system
Internal control systemInternal control system
Internal control system
 

Ähnlich wie Asian paints 20110405_1302845884

PAINTING NEW INVESTMENTS
PAINTING NEW INVESTMENTSPAINTING NEW INVESTMENTS
PAINTING NEW INVESTMENTSpincdelhi01
 
Asian paints ylp final (1)
Asian paints ylp final (1)Asian paints ylp final (1)
Asian paints ylp final (1)Nivas Ramalingam
 
Asian paints (7 decades of excellence)
Asian paints (7 decades of excellence)Asian paints (7 decades of excellence)
Asian paints (7 decades of excellence)Hitesh Raheja
 
Presentation on Industrial analysis of Paint Industry
Presentation on Industrial analysis of Paint IndustryPresentation on Industrial analysis of Paint Industry
Presentation on Industrial analysis of Paint IndustryJaya Saxena
 
Berager paints project report
Berager paints   project reportBerager paints   project report
Berager paints project reportMohan Suyamburaj
 
Paint industry bright or tight
Paint industry   bright or tightPaint industry   bright or tight
Paint industry bright or tightABHAY TIWARI
 
Perception and buying behavior of paint dealer towards berger paint
Perception and buying behavior of paint dealer towards berger paintPerception and buying behavior of paint dealer towards berger paint
Perception and buying behavior of paint dealer towards berger paintApurv Deshmukh
 
G 4 global scenario in paint industry -amit jain
G 4   global scenario in paint industry -amit jainG 4   global scenario in paint industry -amit jain
G 4 global scenario in paint industry -amit jainGn Tewari
 
Financial Analysis Paint Industry
Financial Analysis Paint IndustryFinancial Analysis Paint Industry
Financial Analysis Paint IndustryAditya Agrawal
 
Indian Paint Industry
 Indian Paint Industry Indian Paint Industry
Indian Paint IndustryAkash Agarwal
 
The India Paints industry to reach USD 12,430 million by 2017: Ken Research
The India Paints industry to reach USD 12,430 million by 2017: Ken ResearchThe India Paints industry to reach USD 12,430 million by 2017: Ken Research
The India Paints industry to reach USD 12,430 million by 2017: Ken ResearchAnkur Gupta
 
Asian Paints Analysis by Sagar Faujdar
Asian Paints Analysis by Sagar FaujdarAsian Paints Analysis by Sagar Faujdar
Asian Paints Analysis by Sagar FaujdarSagarFaujdar
 
Team: The Chromus 3, Asian Paints Canvas 2012, IIM Kozhikode
Team: The Chromus 3, Asian Paints Canvas 2012, IIM KozhikodeTeam: The Chromus 3, Asian Paints Canvas 2012, IIM Kozhikode
Team: The Chromus 3, Asian Paints Canvas 2012, IIM KozhikodeAnshul Kumar
 

Ähnlich wie Asian paints 20110405_1302845884 (20)

PAINTING NEW INVESTMENTS
PAINTING NEW INVESTMENTSPAINTING NEW INVESTMENTS
PAINTING NEW INVESTMENTS
 
Asian paints ylp final (1)
Asian paints ylp final (1)Asian paints ylp final (1)
Asian paints ylp final (1)
 
Asian paints (7 decades of excellence)
Asian paints (7 decades of excellence)Asian paints (7 decades of excellence)
Asian paints (7 decades of excellence)
 
Presentation on Industrial analysis of Paint Industry
Presentation on Industrial analysis of Paint IndustryPresentation on Industrial analysis of Paint Industry
Presentation on Industrial analysis of Paint Industry
 
Asian paints
Asian paintsAsian paints
Asian paints
 
Berager paints project report
Berager paints   project reportBerager paints   project report
Berager paints project report
 
IJSR
IJSRIJSR
IJSR
 
Sherwin Williams
Sherwin WilliamsSherwin Williams
Sherwin Williams
 
Paint industry bright or tight
Paint industry   bright or tightPaint industry   bright or tight
Paint industry bright or tight
 
Perception and buying behavior of paint dealer towards berger paint
Perception and buying behavior of paint dealer towards berger paintPerception and buying behavior of paint dealer towards berger paint
Perception and buying behavior of paint dealer towards berger paint
 
CASE STUDY_unlocked.pdf
CASE STUDY_unlocked.pdfCASE STUDY_unlocked.pdf
CASE STUDY_unlocked.pdf
 
CASE STUDY.pdf
CASE STUDY.pdfCASE STUDY.pdf
CASE STUDY.pdf
 
G 4 global scenario in paint industry -amit jain
G 4   global scenario in paint industry -amit jainG 4   global scenario in paint industry -amit jain
G 4 global scenario in paint industry -amit jain
 
Financial Analysis Paint Industry
Financial Analysis Paint IndustryFinancial Analysis Paint Industry
Financial Analysis Paint Industry
 
Indian Paint Industry
 Indian Paint Industry Indian Paint Industry
Indian Paint Industry
 
Akzo Nobel India Ltd.
Akzo Nobel India Ltd.Akzo Nobel India Ltd.
Akzo Nobel India Ltd.
 
Paint industry
Paint industry Paint industry
Paint industry
 
The India Paints industry to reach USD 12,430 million by 2017: Ken Research
The India Paints industry to reach USD 12,430 million by 2017: Ken ResearchThe India Paints industry to reach USD 12,430 million by 2017: Ken Research
The India Paints industry to reach USD 12,430 million by 2017: Ken Research
 
Asian Paints Analysis by Sagar Faujdar
Asian Paints Analysis by Sagar FaujdarAsian Paints Analysis by Sagar Faujdar
Asian Paints Analysis by Sagar Faujdar
 
Team: The Chromus 3, Asian Paints Canvas 2012, IIM Kozhikode
Team: The Chromus 3, Asian Paints Canvas 2012, IIM KozhikodeTeam: The Chromus 3, Asian Paints Canvas 2012, IIM Kozhikode
Team: The Chromus 3, Asian Paints Canvas 2012, IIM Kozhikode
 

Asian paints 20110405_1302845884

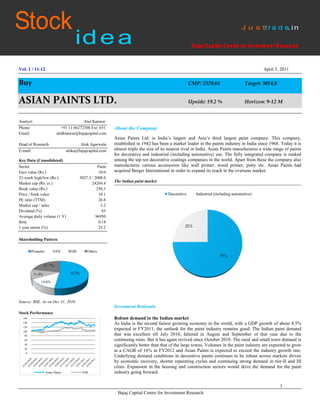
  • 1. Stock Idea – Asian Paints Ltd. Vol. 1 / 11-12 April 5, 2011 Buy CMP: 2529.65 Target: 3014.0 ASIAN PAINTS LTD. Upside: 19.2 % Horizon: 9-12 M Analyst: Atul Kanwar Phone: +91 11 66272300 Ext: 651 About the Company Email: atulkanwar@bajajcapital.com Asian Paints Ltd. is India’s largest and Asia’s third largest paint company. This company, Head of Research: Alok Agarwala established in 1942 has been a market leader in the paints industry in India since 1968. Today it is E-mail: aloka@bajajcapital.com almost triple the size of its nearest rival in India. Asian Paints manufactures a wide range of paints for decorative and industrial (including automotive) use. The fully integrated company is ranked Key Data (Consolidated) among the top ten decorative coatings companies in the world. Apart from these the company also Sector Paint manufactures various accessories like wall primer, wood primer, putty etc. Asian Paints had Face value (Rs.) 10.0 acquired Berger International in order to expand its reach in the overseas market. 52-week high/low (Rs.) 3027.3 / 2008.0 The Indian paint market Market cap (Rs. cr.) 24264.4 Book value (Rs.) 250.3 Price / book value 10.1 Decorative Industrial (including automotive) PE ratio (TTM) 26.8 Market cap / sales 3.2 Dividend (%) 85 Average daily volume (1 Y) 96950 Beta 0.14 1 year return (%) 25.2 25% Shareholding Pattern Promoter FII DII Others 75% 21..7% 11.4% 52.3% 14.6% Source: BSE. As on Dec 31, 2010 Investment Rationale Stock Performance 160 Robust demand in the Indian market 140 As India is the second fastest growing economy in the world, with a GDP growth of about 8.5% 120 100 expected in FY2011, the outlook for the paint industry remains good. The Indian paint demand 80 that was excellent till July 2010, faltered in August and September of that year due to the 60 continuing rains. But it has again revived since October 2010. The rural and small town demand is 40 significantly better than that of the large towns. Volumes in the paint industry are expected to grow 20 0 at a CAGR of 16% in FY2012 and Asian Paints is expected to exceed the industry growth rate. Underlying demand conditions in decorative paints continues to be robust across markets driven by economic recovery, shorter repainting cycles and continuing strong demand in tier-II and III cities. Expansion in the housing and construction sectors would drive the demand for the paint Asian Paints NSE industry going forward. 1 Bajaj Capital Centre for Investment Research
  • 2. Stock Idea – Asian Paints Ltd. The Indian paint industry has grown at an India paint industry: growth in volumes average of 15.3% from FY05 to FY10. 18% 18% 16% 16% 14% 13% 14% 13% FY05 FY06 FY07 FY08 FY09 FY10 FY11E FY12E Source: Company Asian Paints is a giant of the Indian paint industry Asian Paints is the clear market leader in the Indian paints industry with about 32.4% market share. The top four players that include Berger, Kansai & ICI (Akzo Nobel) apart from Asian Paints, have cornered around 60% of the total market share. Other players in the organized sector account for only 5% of the industry market share. The unorganized sector is a large one but is very fragmented, constituting 35% of the total paints market. The organized section of the industry is growing faster than the unorganized sector. The competition in the paint industry is India’s paint industry: market share of major players becoming more intense with the entry of foreign players like Jotun, Nippon & Sherwin Asian Paints Berger Kansai ICI (Akzo Nobel) Others Unorganized sector Williams. 35.0% 32.4% 5.0% 10.8% 6.0% 10.8% Source: Company, BCCIR Huge capacity addition plans Strong volume visibility has resulted in Asian Paints continuing its streak of capacity addition. The commercial production at its new paint manufacturing facility at Rohtak, Haryana has started. The plant has an initial capacity of 1.5 lakh kl per annum. The project cost for setting up this capacity was Rs ~500 cr. The plant capacity can be scaled up to 4 lakh kl per annum in future expansions. The company is also planning to set up a manufacturing plant in northeastern parts of Andhra Pradesh with a capacity of 1 lakhs tonnes per annum. The company is considering this location because it is well connected with all parts of the country. Though the investment in the proposed plant was not disclosed but the management has said that they would like to set up one of the largest plants in India, if the Andhra Pradesh government provides them with land. The proposed Asian Paints bought land in Maharashtra for project will be classified under mega projects category. This decision was taken by the company a greenfield mega project with a capacity of 4 after the state government denied permission, due to environmental concerns, to set up the plant at lakh tonnes per annum. An amount of Rs 735 Patancheru on the outskirts of Hyderabad where the company has a manufacturing facility and cr would be spent on the project in 5 years. wanted to go in for brownfield expansion. 2 Bajaj Capital Centre for Investment Research
  • 3. Stock Idea – Asian Paints Ltd. Asian Paints may look at further hike in prices Price hike if raw material prices continue to move up. To pass on the rise in raw material costs, Asian Paints has gone in for multiple price increase. The company has affected four price hikes in FY2011 i.e. 4.15% on May 1, 2.6% on July 1, 1.2% on August 1, and 2.9% in December 2010. The price hike has been the highest in the past 10 years, Asian Paints is the price leader and other players in the industry follow with a lag. Broadly, price hikes by all players have been similar. The paint industry in the past has been able to raise prices in line with the rise in inflation without having a significant impact on volumes. Asian Paints: price hikes over the years 4.2% 2.5% 2.6% 2.9% 1.4% 1.2% -1.8% -2.0% -2.3% -5.1% Source: Company In-house manufacturing of raw material Most paint companies are hit by the fact that they do not make raw materials themselves. For example, Phthalic Anhydride (PAN) is manufactured from orthoxylene, which goes into the Asian Paints benefits by selling Phthalic production of paints along with titanium dioxide. Asian Paints is the only paint company in India Anhydride (PAN) in the open market. that manufactures PAN. The other industry players have to import this stock. Since PAN prices generally outpace international orthoxylene prices by ~50%, paint companies end up paying a fortune when prices rise Shift to enamels & emulsion would lead to significant growth Growth is expected in future, in the paints industry through an increase in enamels and emulsion use. At present 19% of the revenue in the industry is realized through the distemper segment. But going ahead, the share of distemper is expected to come down, while that of enamels and emulsion is expected to go up. This would lead to better realizations and higher margins for the company. Revenue breakdown of Indian paint industry (FY10) Enamels Distemper Interior Emulsion Exterior Emulsion Wood Finish 2% 12% 17% 50% 19% Source: Company Extensive distribution network Almost half of the revenues earned by the Asian Paints has a very large distribution network in India. It boasts of 90 depots across the Indian paint industry are through enamels. country. It has over 27,000 retailers as compared to 6,500 of Kansai Nerolac. 3 Bajaj Capital Centre for Investment Research
  • 4. Stock Idea – Asian Paints Ltd. Industrial coating accounts for ~25% of the Second JV with PPG industries ~Rs 17,000 cr paints segment and has a high Asian Paints approved plans to enhance its fourteen year relationship with PPG Industries Inc, presence of unorganized players. Major USA, to accelerate growth of the non-decorative coatings businesses in India. As part of this organized players in this segment include arrangement, Asian Paints and PPG will enhance their existing non-decorative coatings presence Kansai Nerolac, ICI and Jotun Paints apart in India by expanding their current 50-50 joint venture relationship - Asian PPG Industries Ltd from Asian Paints Industrial Coating Ltd. (APPG) and also establish a second 50-50 joint venture. The modalities are being worked on. The (APICL), a 100% subsidiary of Asian Paints. arrangement is subject to regulatory approval and is expected to be completed during CY2011. APPG currently services the Indian transportation coatings markets and this change will expand its scope to additionally service the marine and consumer packaging markets. The second joint venture will service the industrial containers and light industrial coatings markets. The two joint ventures together will serve all customers for non-decorative products in the Indian market. The JV's would leverage PPG's technology and global customer relationships while continuing to build on Asian Paints' customer base, manufacturing footprint, distribution channels and local relationships. Asian Paints and PPG have agreed that Asian Paints will take the lead in the second venture and PPG will take the lead in APPG in order to utilize their respective strengths to best capture the growth in infrastructure development and the economic boom in India. Geographically diversified The Asian Paints group operates in five regions across the world i.e. South Asia, South East Asia, South Pacific, Middle East & Caribbean through its five corporate brands viz. Asian Paints, Berger International, SCIB Paints, Apco Coatings and Taubmans. The company along with its subsidiaries has operations in 17 countries across the world with 23 paint manufacturing facilities, servicing consumers in 65 countries. It is the largest paint company in eleven countries. International operations: regional sales contribution (FY2010) Middle East Caribbean South Asia South East Asia South Pacific Middle East accounts for the majority of Asian Paints’ international sales 7.0% 7.9% 15.4% 53.6% 16.1% Source: Company International operations: countries Region Countries Middle East Egypt, Oman, Bahrain & UAE Caribbean Barbados, Jamaica, Trinidad & Tobago South Asia Bangladesh, Nepal & Sri Lanka In 9MFY11, International operations accounted for Rs 756.7 cr or ~13% of Asian South East Asia Singapore Paints’ sales. South Pacific Fiji, Solomon Islands, Samoa, Tonga & Vanuatu Source: Company 4 Bajaj Capital Centre for Investment Research
  • 5. Stock Idea – Asian Paints Ltd. For 9MFY11, net sales of the company Financial Performance jumped by 19.5% to Rs 5740.6 cr, compared to Rs 4804.2 cr in 9MFY10. Decent Q3FY11 results On a standalone basis, the company posted a growth of 15.6% in its APAT for the quarter ended December 31, 2010 at Rs 206.6 cr as compared to Rs 178.7 cr for the corresponding quarter of the previous year. Its net sales surged by 37.3% at Rs 1754.2 cr, compared to Rs 1277.7 cr for the similar quarter of the previous year due to a robust decorative paints segment. On consolidated basis, the group has posted a APAT attributable to shareholders of Rs 220.3 cr for the quarter ended December 31, 2010 as compared to Rs 198.6 cr for the quarter ended December 31, 2009, rising by 11.0%. Its consolidated net sales has increased 29.6% to Rs 2099.6 cr for the quarter ended December 31, 2010 from Rs 1620.0 cr for the December quarter of 2009. Consensus EPS forecast Financial Year Consensus Forecast FY 2011 94.4 FY 2012 113.9 Net sales performance (consolidated) 2500.0 2099.6 40.0% 1876.8 1830.2 1810.8 2000.0 1723.9 1620.0 30.0% 1422.6 1460.2 1500.0 31.9% 25.2% 25.3% 20.0% 1000.0 22.5% 29.6% 17.5% 16.8% 5.0% 500.0 10.0% The net sales performance of Asian Paints 0.0 0.0% dipped YoY in Q2FY11 due to prolonged Q4FY10 Q1FY10 Q2FY10 Q3FY10 Q4FY10 Q1FY11 Q2FY11 Q3FY11 monsoon and delayed festival season, but the sales staged a smart recovery in Q3FY11. Net sales (Rs cr) % increase (YoY) Operating profit performance (consolidated) 500.0 410.2 25.0% 20.0% 334.9 365.5 356.4 364.3 400.0 23.8% 332.5 20.0% 291.4 20.0% 300.0 20.7% 17.7% 19.7% 17.3% 15.0% 188.9 200.0 10.0% 13.3% 100.0 5.0% 0.0 0.0% Q4FY10 Q1FY10 Q2FY10 Q3FY10 Q4FY10 Q1FY11 Q2FY11 Q3FY11 Operating profit (Rs cr) Operating margins APAT performance (consolidated) 300.0 268.4 20.0% 250.0 222.2 214.7 220.3 198.4 192.0 15.0% 200.0 176.1 15.6% 150.0 102.2 12.1% 11.9% 10.0% 12.1% 12.2% 10.2% 10.5% 100.0 7.2% 5.0% 50.0 0.0 0.0% Asian Paints is expected to sustain operating Q4FY10 Q1FY10 Q2FY10 Q3FY10 Q4FY10 Q1FY11 Q2FY11 Q3FY11 margins at 16-18% levels going forward, aided by strong pricing power and superior APAT (Rs cr) APAT margins product mix (higher proportion of emulsions). 5 Bajaj Capital Centre for Investment Research
  • 6. Stock Idea – Asian Paints Ltd. Though the APAT has remained steady for the Paints products: volume growth past few quarters, the APAT margins have shown a dip due to high raw material costs and 500000 20.0% 17.7% 16.8% 411369 higher depreciation. 400000 354370 316871 15.0% 12.1% 241903 282602 16.1% 300000 220284 11.8% 10.0% 187221 12.1% 200000 184622 9.8% 5.0% 100000 1.4% 0 0.0% FY03 FY04 FY05 FY06 FY07 FY08 FY09 FY10 Production (million tonnes) Growth (YoY) Paints products: sales realization growth 120000 12.0% 98972 97963 100000 84512 87240 90147 10.0% 75771 78946 80634 80000 8.0% 9.8% 4.8% 6.0% 60000 4.2% 3.2% 3.3% 2.1% 4.0% 40000 2.0% 20000 -0.1% 0.0% -1.0% 0 -2.0% FY03 FY04 FY05 FY06 FY07 FY08 FY09 FY10 Robust performance was seen in the Decorative paint business though the Sales realization/kilo litre (Rs) Growth (YoY) Industrial paint business did not match that performance. Review of Business Segments (Q3FY11) Decorative Business  In Q3FY11 the performance was mostly good in all parts of the country.  The demand for interior and exterior emulsions was particularly good.  The demand for Enamel was higher than anticipated. Industrial business  Demand condition for Industrial paints was challenging.  Automotive business grew in line with the market. International operations  Demand conditions for International business was challenging in some areas. However, South Asia has shown a decent growth.  Net Sales & operating income growth was flat in the period April – Dec 2010 compared to 9 months of the previous year. International operations: net sales (Rs cr) Region 9MFY11 9MFY10 Growth Caribbean 123.9 129.7 -4.4% South Asia outperformed. There was growth Middle East 401.7 409.6 -1.9% in South Pacific too. But the Caribbean and Asia 174.8 142.9 22.3% Middle East business was sluggish. South Pacific 56.3 52.4 7.3% 6 Bajaj Capital Centre for Investment Research
  • 7. Stock Idea – Asian Paints Ltd. Asian Paints has better margins than its Peer Analysis peers. It also scores over the other paint companies in terms of a high RONW%. Major paint companies: strengths Company Strengths Asian Paints Market leader in the paints industry ICI (Akzo Nobel) Strong in premium end paints/emulsion Berger Paints Focused on enamels and lower end paints Kansai Nerolac Leader in Industrial paints, with half the sales coming from auto industry Nippon Largest paint manufacturer in the world with premium technology. No. 1 in China. Paint industry majors - comparison (standalone financials in Rs cr) Net PBIDTM APATM RONW Mkt Company Sales PAT (%) (%) D/E (%) P/E P/BV Cap Akzo Nobel 1041.7 159.3 12.6 8.6 0.0 16.2 19.4 2.4 2676.2 Berger Paints 1686.5 120.1 11.0 6.6 0.1 22.9 20.9 4.0 2912.0 Kansai Nerolac 1822.0 165.5 14.4 8.4 0.1 23.2 23.4 4.6 4232.0 Asian Paints 5372.7 774.5 20.5 13.4 0.1 58.4 31.0 11.7 24260.6 P/E, P/BV & Mkt Cap figures are for March 25, 2011. Net Sales, PAT, PBIDTM (%), APATM (%) & RONW% statistics are for FY10. On an average, raw materials account for 60% of net sales in the paints industry. Key Concerns Rising price of raw material The paint industry is raw material intensive. These raw materials are of a wide variety. Rising cost and erratic availability of raw material mark the Indian paint industry. Crude derivatives account for about 30-35% of Asian Paint’s raw material costs. Brent crude prices (US$) 115.6 104.0 96.3 91.8 82.9 85.7 76.7 77.8 Crude prices have been in an upswing and this is raising the cost burden of the industry Aug-10 Sep-10 Oct-10 Nov-10 Dec-10 Jan-11 Feb-11 Mar-11 players. Note: March 2011 figures are for the closing on the 25th day of that month. 7 Bajaj Capital Centre for Investment Research
  • 8. Stock Idea – Asian Paints Ltd. There is a demand supply gap in case of The input costs have shown a northward trend since Q1FY10 but the surge has been particularly Titanium Dioxide. There is no greenfield harsh in CY2010. Prices of raw materials like titanium dioxide, solvent and crude related inputs capacity on the anvil and it would almost take have increased sharply. a couple of years before a brownfield additional capacity starts operating. Titanium Input cost index dioxide accounts for 20-25% of the total input cost. 103.9 104.5 100.0 98.5 94.4 91.7 92.7 91.4 FY09 Q1FY10 Q2FY10 Q3FY10 Q4FY10 Q1FY11 Q2FY11 Q3FY11 Source: Company Slowdown in the economy The well being of the paint industry is dependent on the growth of the economy. 75% of the decorative paints demand comes from repainting and repainting demand depends on how well the Indian economy is doing. Any slowdown in the real estate and the industrial growth impacts the volumes of the paints industry negatively. The crisis in Egypt and Bahrain would impact Asian Paints’ business marginally. Egypt has Advertisement and promotion spends expected to rise going forward two manufacturing facilities and accounts for The competition in the paint industry has intensified with new players entering the Indian market 50-53% of the company’s middle-east This has resulted in an increase in advertisement spend of some companies in this sector. For revenues. Bahrain has one manufacturing unit Asian paints, the advertising and promotion spend has been ~4.5% of its net sales. But on account and contributes 10-12% of the company’s of higher competition and advertisement rate inflation, it may rise in the future. middle-east sales. These two countries together contribute ~4.5% to the net sales of Asian Paints. Valuation Asian Paints is by far the largest paint company in India, with almost one-third of the total market share. It also ranks among the top ten decorative coating companies in the world. With the Indian economy expanding at a fast rate and the housing & infrastructure sectors expected to attract big investments, the paint industry volumes are expected to grow at a healthy 16% in FY12.This bodes well for Asian Paints, the market leader of the industry. The company also has huge expansion plans. After commencing operations at its new facility in Haryana recently, it plans to set up mega projects in Maharashtra and Andhra Pradesh. Asian Paints boasts of an extensive distribution network comprising of 27,000 retailers. The company is fully capable of negating the increase in price of raw materials, by increasing the price of its products. This was amply demonstrated when it raised prices four times in CY2010. Asian Paints is also planning to start its second joint venture with PPG Industries of USA in CY2011. These two JV’s would provide the entire spectrum of paints for the industrial sector. A is also geographically well diversified servicing customers in 65 countries across the globe. . Asian Paints has a market capitalization of Rs 24264.4 cr. and is trading at a share price of Rs. 2529.65. The consolidated TTM EPS is Rs. 94.4 translating into a TTM PE of 26.8. The price to book value stands at 10.1. The stock is an attractive buy considering the growth prospects of the industry as well as the company. We expect the company to register an EPS of Rs 115.9 for FY12 on the basis of strong volume growth and pricing power. This makes the stock currently trade at The demand in the paint industry is seasonal 21.8x FY12. to some extent. While the demand dips in the monsoon season, it is the maximum in the festive season We recommend a “BUY” on the stock with an investment horizon of 9-12 months and target price of Rs. 3014. 8 Bajaj Capital Centre for Investment Research
  • 9. Stock Idea – Asian Paints Ltd. SWOT Analysis Strengths Weaknesses • Market leader: Asian Paints is the largest paint • Industrial business performing below par: The company in India with a market share of 32.4%. It is industrial business of the company has performed below also the 3rd largest in Asia and among the top 10 expectations, though the decorative business has done decorative paint companies in the world. very well. The automotive business has performed in • Capacity expansion plans: The company has already line with expectations. Subject to regulatory approvals, commenced its Rohtak operations recently that has a Asian Paints is planning to have a second joint venture capacity of 1.5 lakh kl per annum. In addition to this it with PPG industries. Both the joint ventures would has plans for greenfield expansion of 4 lakh tonnes in cover the entire gamut of the non-decorative paint Maharashtra and 1 lakh tonnes per annum in AP. business. Asian Paints would leverage PPG's technology • Pricing power: Asian paints has had four price hikes in and customer relationships around the globe. CY2010. It intends to raise product prices again if the • Hiccups in international business: The middle east raw material prices keep going northwards. business is being hampered by strife in Egypt & • Manufactures PAN: The company manufactures Bahrain.The Caribbean sales also dipped in Q3FY11. Phthalic Anhydride (PAN), a key raw material. But Asia & South Pacific business has been doing well. • Wide distribution network: Comprising of 90 depots • International presence restricted to small pockets: and 27,000 retailers. Asian Paints need to spread its business to big centres worldwide, to become a true multinational. Opportunities Threats • Fast growing Indian economy: The fast growing • Competition from the world majors: Major world Indian economy and a growth in the realty and players like Jotun, Nippon and Sherwin Williams are construction industries presents a big opportunity for now competiting with Asian Paints in the domestic Asian Paints. Indian markets. • Shorter repainting cycles: The growing affluence of • Competition from the unorganized sector: The the Indian people is resulting in shorter repainting cycles unorganized sector, though fragmented holds a ~35% benefiting the paint industry. share of the Indian paint industry and gives tough • Growth in the tier II and III towns: The paint demand competition to established players. in these towns is growing at a faster rate than the tier I • Rising cost of raw materials: The input costs for Asian cities. Paints and the other players in the industry are rising. • Steady growth in industry volumes: The paint industry The price of crude derivatives and titanium dioxide, two has shown an average volume growth of 15.3% in the key inputs has seen a sharp upswing. past six years and the growth is expected to be 16% in • Slowdown in the economic growth: The paint industry FY12. fortunes are positively co-related to the growth of the • Expected decrease in the use of distemper in future: economy. Increase in enamels & emulsion use would have a • Unstable political situation in middle east: This region positive impact on company's margins. accounts for over 50% of company's international sales. 9 Bajaj Capital Centre for Investment Research
  • 10. Stock Idea – Asian Paints Ltd. Financials Income Statement (Quarterly) Consolidated Rs. Cr. Particulars Q3FY11 Q2FY11 Q3FY10 QoQ (%) YoY (%) Net Sales 2099.6 1810.8 1620.0 15.9 29.6 Total Income 2119.0 1835.7 1636.9 15.4 29.5 Total Expenditure 1754.7 1479.3 1302.0 18.6 34.8 PBIDT 364.3 356.4 334.9 2.2 8.8 PBIDT Margin % 17.3 19.7 20.7 Interest 5.9 4.6 7.9 28.3 -26.1 Depreciation 28.6 28.4 19.7 0.8 45.8 Tax 87.9 90.2 92.3 -2.5 -4.7 APAT 220.3 214.7 198.4 2.6 11.0 APATM (%) 10.5 11.9 12.2 Financials (Annual):Consolidated Rs. Cr. 5 yr CAGR 9MFY11 201003 200903 200803 200703 200603 200503 % Share Capital 95.9 95.9 95.9 95.9 95.9 95.9 95.9 Networth 1710.0 1203.2 982.4 777.8 646.3 567.2 Capital Employed 1939.2 1511.8 1257.6 1084.0 907.5 806.7 Debt 229.2 308.6 275.2 306.2 261.3 239.5 CWIP 407.2 92.1 114.2 13.8 33.7 10.6 Inventory 955.9 769.0 714.0 598.0 488.9 454.5 Sundry Debtors 542.5 571.9 460.3 420.6 347.5 295.9 Cash & Bank Balance 105.8 210.4 110.7 105.4 73.4 60.8 Revenues 5740.6 6965.3 5719.0 4590.9 3835.9 3166.9 2673.3 21.1 Total Income 5803.3 7208.5 5802.8 4687.5 3960.1 3209.8 2779.9 21.0 Total Expenditure 4717.1 5831.2 5079.1 3970.6 3445.2 2795.7 2419.9 19.2 PBIDT 1086.2 1377.3 723.7 717.0 514.9 414.2 360.0 30.8 Interest 14.6 36.8 32.5 26.4 24.0 11.4 10.8 27.7 Depreciation 84.0 83.6 74.4 59.2 61.1 60.6 61.4 6.4 APAT 657.2 785.5 395.7 411.3 284.9 211.8 171.3 35.6 Cash Flow from Operating Activities 1058.0 401.9 473.7 252.2 179.2 106.7 Cash Flow from Investing Activities -299.0 -270.1 -334.8 -109.5 -125.0 -73.9 Cash Flow from Financing Activities -331.9 -230.4 -133.6 -110.8 -41.6 -41.9 Free Cash Flows 759.0 131.9 139.0 142.8 54.2 32.9 Dividend % 270.0 175.0 170.0 130.0 125.0 95.0 EPS (Rs.) 68.5 87.6 40.7 41.7 27.6 20.1 17.6 Debt-Equity Ratio 0.2 0.3 0.3 0.4 0.4 0.3 RoNW % 57.3 36.2 45.6 36.7 31.4 29.6 Fixed Asset Turnover Ratio 4.9 4.6 4.3 4.0 3.6 3.1 PBIDT Margin % 18.9 19.8 12.7 15.6 13.4 13.1 13.5 APAT Margin % 11.4 11.3 6.9 9.0 7.4 6.7 6.4 10 Bajaj Capital Centre for Investment Research
  • 11. Stock Idea – Asian Paints Ltd. Disclaimer: This document has been prepared by Bajaj Capital Centre for Investment Research (BCCIR), a unit of Bajaj Capital Limited (BCL). BCL and its subsidiaries and associated companies form an integrated unit imparting investment banking, investment advisory and brokerage services in stocks, mutual funds, debt, real estate, personal finance etc. Our research analysts and sales persons provide important input into our investment banking and advisory activities. This document does not constitute an offer or solicitation for the purchase or sale of any financial instrument or as an official confirmation of any transaction. The information contained herein is from publicly available data or other sources believed to be reliable. We do not represent that information contained herein is accurate or complete and it should not be relied upon as such. This document is prepared for assistance only and is not intended to be and must not alone be taken as the basis for an investment decision. The user assumes the entire risk of any use made of this information. Each recipient of this document should make such investigations as it deems necessary to arrive at an independent evaluation of an investment in the securities of companies referred to in this document (including the merits and risks involved). The investment discussed or views expressed may not be suitable for all investors. Affiliates of BCL may have issued other reports that are inconsistent with and reach to a different conclusion from the information presented in this report. This report is not directed or intended for distribution to, or use by, any person or entity who is a citizen or resident of or located in any locality, state, country or other jurisdiction, where such distribution, publication, availability or use would be contrary to law, regulation or which would subject BCL and affiliates to any registration or licensing requirement within such jurisdiction. The securities described herein may or may not be eligible for sale in all jurisdictions or to certain category of investors. Persons in whose possession this document may come are required to inform themselves of and to observe such restriction. BCL & affiliates may have used the information set forth herein before publication and may have positions in, may from time to time purchase or sell or may be materially interested in any of the securities mentioned or related securities. BCL and affiliates may from time to time solicit from, or perform investment banking, or other services for, any company mentioned herein. Without limiting any of the foregoing, in no event shall BCL, any of its affiliates or any third party involved in, or related to, computing or compiling the information have any liability for any damages of any kind. Any comments or statements made herein are those of the analyst and do not necessarily reflect those of BCL and affiliates. This Document is subject to changes without prior notice and is intended only for the person or entity to which it is addressed and may contain confidential and/or privileged material and is not for any type of circulation. Any review, retransmission, or any other use is prohibited. Though disseminated to all the customers simultaneously, not all customers may receive this report at the same time. BCL will not treat recipients as customers by virtue of their receiving this report. Equity and securities investments are subject to market risks and there is no assurance or guarantee that the objectives of the investment will be achieved. As with any investment in securities, the share price of a particular company can go up or down depending on the forces and factors affecting the capital markets. Disclosure of interest: 1. BCL and its affiliates do not hold paid up capital of the company. 2. The Analyst and his/her dependent family members do not hold any long or short position in the shares of the company covered as on the date of publication of research on the subject company. © Copyright in this document vests exclusively with BCL. Bajaj Capital Centre for Investment Research Bajaj Capital Ltd 97, Bajaj House, Nehru Place New Delhi 110019 Tel 4169 3000, 4169 2900, Ext. 651 Email: bccir@bajajcapital.com 11 Bajaj Capital Centre for Investment Research