
Empfohlen
Empfohlen
Weitere ähnliche Inhalte
Andere mochten auch
Kürzlich hochgeladen
Kürzlich hochgeladen (20)
Iv visualisation on carbon emmisions final
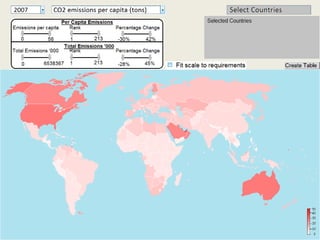
- 1. Original Layout when person first opens the visualisation
- 2. Original Layout when person first opens the visualisation Drop down menus to change year and data you wish to receive
- 3. Original Layout when person first opens the visualisation
- 4. Original Layout when person first opens the visualisation
- 5. Original Layout when person first opens the visualisation Adjust slide bars to filter data
- 6. Original Layout when person first opens the visualisation i.e adjust emissions per capita for range 15-19 Note: all other bars adjust automatically to represent filtered data
- 8. Select to adjust scale and colour intensity for filtered data Note: Scale range will change
- 10. Ability to change data displayed on map without slide bars moving
- 12. Original Layout when person first opens the visualisation Rollover on specific countries provides detailed information Double-clicking adds country to grey box for comparison
- 13. Original Layout when person first opens the visualisation
- 14. Original Layout when person first opens the visualisation Clicking box provides a fisheye list of all countries. Rollover a country will illustrate position on map and provide detailed information Selecting country adds it to the comparison table
- 15. Original Layout when person first opens the visualisation
- 16. Original Layout when person first opens the visualisation
- 17. Original Layout when person first opens the visualisation Selecting this option creates pop-up with a table of countries listed to provide comparison
- 18. Original Layout when person first opens the visualisation
- 19. Original Layout when person first opens the visualisation All columns have ability to be ordered and sort using arrow