

Empfohlen
Empfohlen
Weitere ähnliche Inhalte
Was ist angesagt?
Was ist angesagt? (20)
Andere mochten auch
Mehr von Naveen Francis
Dsp thrissur ch1
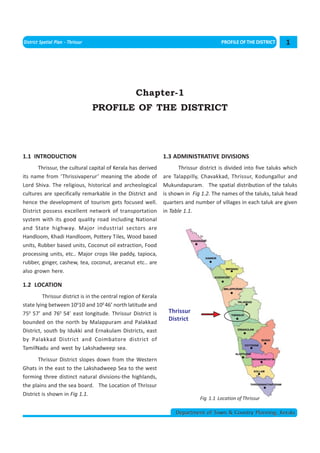
- 1. < CONTENTS > District Spatial Plan - Thrissur PROFILE OF THE DISTRICT 1 Chapter-1 PROFILE OF THE DISTRICT 1.1 INTRODUCTION 1.3 ADMINISTRATIVE DIVISIONS Thrissur, the cultural capital of Kerala has derived Thrissur district is divided into five taluks which its name from ‘Thrissivaperur’ meaning the abode of are Talappilly, Chavakkad, Thrissur, Kodungallur and Lord Shiva. The religious, historical and archeological Mukundapuram. The spatial distribution of the taluks cultures are specifically remarkable in the District and is shown in Fig 1.2. The names of the taluks, taluk head hence the development of tourism gets focused well. quarters and number of villages in each taluk are given District possess excellent network of transportation in Table 1.1. system with its good quality road including National and State highway. Major industrial sectors are Handloom, Khadi Handloom, Pottery Tiles, Wood based units, Rubber based units, Coconut oil extraction, Food processing units, etc.. Major crops like paddy, tapioca, rubber, ginger, cashew, tea, coconut, arecanut etc.. are also grown here. 1.2 LOCATION Thrissur district is in the central region of Kerala state lying between 10010’ and 100 46’ north latitude and 750 57’ and 760 54’ east longitude. Thrissur District is Thrissur bounded on the north by Malappuram and Palakkad District District, south by Idukki and Ernakulam Districts, east by Palakkad District and Coimbatore district of TamilNadu and west by Lakshadweep sea. Thrissur District slopes down from the Western Ghats in the east to the Lakshadweep Sea to the west forming three distinct natural divisions-the highlands, the plains and the sea board. The Location of Thrissur District is shown in Fig 1.1. Fig 1.1 Location of Thrissur Department of Town & Country Planning, Kerala
- 2. 2 PROFILE OF THE DISTRICT District Spatial Plan - Thrissur The District has 17 Panchayat blocks, six munici- Table 1.1: Taluks and Taluk Head Quarters pal councils namely Chalakkudy, Chavakkad, Name of Taluk Taluk Head Quarters No of Villages Kunnamkulam, Irinjalakkuda, Guruvayur and Talappilly Wadakkanchery 70 Kodungallur and one Municipal Corporation (Thrissur Municipal Corporation). The name of the blocks, block Chavakkad Chavakkad 19 head quarters and block wise distribution of the popu- Thrissur Thrissur 49 lation is given in Table 1.2. The spatial distribution of Kodungallur Kodungallur 14 the development blocks are shown in Fig 1.3. Mukundapuram Irinjalakkuda 52 Fig 1.2 Taluks – Thrissur District The 17 development blocks are divided in to Annexe 1. The spatial distribution of which is shown in 92 Grama Panchayats, the list of which is given in Fig 1.4. Department of Town & Country Planning, Kerala
- 3. District Spatial Plan - Thrissur PROFILE OF THE DISTRICT 3 Thrissur Muncipal Corporation Collectorate, Thrissur Fig 1.3: Block Panchayats of Thrissur District Department of Town & Country Planning, Kerala
- 4. 4 PROFILE OF THE DISTRICT District Spatial Plan - Thrissur Table 1.2: Block Panchayats and their Head Quarters Name of the Grama Sl.No Name of Block Population Block Head Panchayat where Panchayat 2001 Quarters Block Panchayat HQ situated 1 Chowwannur 136592 Kanipayur Chowannur 2 Wadakkanchery 227026 Wadakkanchery Wadakkanchery 3 Pazhayannur 171636 Pazhayannur Pazhayannur 4 Chavakkad 125364 Chavakkad Chavakkad Municipal Council 5 Thalikulam 131384 Thalikulam Thalikulam 6 Mullassery 58269 Mullassery Mullassery 7 Puzhakkal 128438 Puranattukkara Puzhakkal 8 Ollukkara 120959 Ollukkara Pananchery 9 Anthicad 109205 Kizhakkumuri Anthicad 10 Cherpu 45937 Palakkal Avinissery 11 Mathilakam 145959 Mathilakam Mathilakam 12 Kodungalloor 39384 Eriyad Eriyad 13 Mala 144525 Kuruvilassery Mala 14 Irinjalakuda 124743 Madayikonam Porathissery 15 Kodakara 181996 Puthukad Puthukad 16 Vellangallur 114151 Vellangallur Vellangallur 17 Chalakkudy 129231 Chalakkudy Chalakkudy Municipal Council Fig 1.4: Grama Panchayats and Municipalities of the District Department of Town & Country Planning, Kerala
- 5. District Spatial Plan - Thrissur PROFILE OF THE DISTRICT 5 1.4 TOPOGRAPHY AND PHYSICAL FEATURES lays the basin representing the “Kole Lands” .This bot- Thrissur District can be divided into five well de- tom land which lies below the sea level is submerged fined Topography regions. The lowest elevation below under water for a major part of the year. Paddy is ex- MSL (mean sea level) is in the Kole lands towards the tensively grown in these lands. The units encountered west and the highest elevation of 1430 m are at in this topographical division are given below. Karimalagopuram lying on the boundary between (II) MIDLANDS (ML) Palakkad District and Mukundapuram Taluk. Fig 1.5 shows Topographical divisions of the District. The elevation ranges from 20m to 100m. The midlands adjoining the high hills stretches in the north Fig 1.5: Topographic division of the District TOPOGRAPHICAL DIVISIONS OF THE DISTRICT south direction towards the west of mid up lands. This constitutes the undulating to rolling lands with inter- (I) LOW LANDS (LL) mittent flat topped low laterite hillocks broken by broad The low land region has an elevation of 20m and narrow valley. Buff coloured hard laterite exten- above MSL. The low land region of the District run par- sively used as building material is amply located in the allel to the Arabian Sea in the north - south direction in flat topped hillocks. The units encountered in the to- a narrow strip. This area constitutes marine sediment pographic division are below. modified considerably by intensive cultivation. The sandwitched between the sea coast and the midland Department of Town & Country Planning, Kerala
- 6. 6 PROFILE OF THE DISTRICT District Spatial Plan - Thrissur (III) MID UP LANDS (MUL) B) CLIMATE : The district has a tropical humid climate with an The elevation 100 to 300m rolling to hilly terrain oppressive hot season and plentiful and seasonal rain- with steep side slopes, isolated rocky patches and in- fall. The hot season from March to May is followed by termittent narrow valleys. Slope ranges from 10 - 40%. South West Monsoon from June to September. Octo- (IV) UP LANDS (UL) ber and November form the post monsoon or retreat- ing monsoon season. The rains stop by the end of De- The elevation is 300 to 600m. Hilly terrain with cember and the rest of the period is generally hot. On high hills and very steep side slopes. Land slope ranges an average there are 124 rainy days in a year. from 25- 50%. The average daily maximum temperature in (V) HIGH LANDS (HL) March & April is about 310 C (830 F) in the coastal re- gions and 360 C (970 F) in the interior. The elevation is above 600m for high land. Hill ranges of the Western Ghats (Sahyadri) with escarp- The air is highly humid throughout the year, the ments, summits and rocky cliffs. Areas above 100 m el- relative humidity being generally over 70%. Winds are evation are mostly under forest and hence put under generally light to moderate and they strengthen in the high lands. The high Land running on the east and south monsoon season. eastern parts covering portions of Mukundapuram and C) MOUNTAINS : Thrissur Taluks, constitute a chain of hills as the Machad Hills, the Paravattani Hills, The Palappilly Hill, the The Western Ghats which separate the district Kodassery Hills, the Athirappilly Hill etc. from Tamil Nadu consist of several ridges and conical peaks. The Machad Hills in Talappilly taluk, the 1.4.1 PHYSICAL FEATURES Physical features of the District namely Natural Sub-Divisions, Climate, Mountains, Rivers & Lakes and Backwaters etc. of the District is described here under; A) NATURAL SUB-DIVISIONS: Thrissur district falls in the Central Kerala Coast. Physiographically, the district has five divisions includ- ing Low Lands, Mid Lands, Mid Up Lands, Up Lands, High Lands. The highland goes to heights of over 1220 meters above the mean sea level. The highland goes to North east part of the district. The low land gently slopes up Poomala Hills to the Backwaters. The sea board lies as a narrow stretch Paravattani Hills in Thrissur taluk and Palappilly, bordering the sea. Besides, other natural assets in the Kodassery and Athirappally Hills in Mukundapuram region are backwaters locally known as ‘Kayals’ lie par- taluk are worth mentioning. There are about 30 peaks allel to the sea coast interconnected by canals, moun- in the district with height ranging between 330 metres tains, reserve forest and four rivers (Bharathpuzha, and 1439 metres. The highest peak Karimalapopuram Kecheri puzha, Karuvannur puzha and Chalakkudy river). (1439metres) lies at the boundary of Palakkad district Department of Town & Country Planning, Kerala
- 7. District Spatial Plan - Thrissur PROFILE OF THE DISTRICT 7 near Arattupuzha and assumes the name Karuvannur River. This river has a length of 65 km. Peechi Dam con- structed across Manali River and Chimmoni Dam across Karumali River help to control floods and to irrigate land. The water bodies of Thrissur District is shown in Figure 1.6. The longest river of this district is Chalakkudy River. It has 4 main tributaries. It joins the Periyar River about 10 kms east of Kodungallur. The hydro electric projects at Peringalkuthu and Sholayar are the two main projects of the river. This river has drainage area of about Peechi Dam 1704 sq.km. and Mukundapuram taluk of Thrissur district. E) LAKES & BACKWATERS : The backwaters locally known as Kayals lie paral- D) RIVERS: lel to the sea coast interconnected by canal. Forming The main rivers of the District are Bharathapuzha, Kecheri puzha, Karuvannur puzha and Chalakudy river. The Bharathapuzha (209km) originates from Anaimalai Hills. The 5 tributaries of this river are Gayathripuzha, Kannadipuzha, Kalpathipuzha, Cheerankuzhy (Gayathririver) and Thuthupuzha. It flows as northern boundary of Thrissur for about 40km. The Kechery River otherwise known as Wadakkanchery river originates from the Machad hills flowing westwards and joins the backwaters of Chettuvai. It has a length of 51 km and Vazhani dam is constructed on this river basin. The Manali River and Karumali River combines Chalakkudy River part of a continuous waterway from Vadakkara to Thiruvananthapuram, the inland navigation systems of the District provides facilities for all types of country boats throughout the year. The water of these backwa- ters is saltish for most part of the year except during rainy season. There are four fresh water lakes in the District namely Kattakampal in Talappilly taluk, Muriyad in Mukundapuram Taluk, Enamakal and Manakkody in Thrissur Taluk. The chain of lagoons and backwaters on the western part running parallel to the Arabian Sea are navigable through out the year. Bharathapuza Department of Town & Country Planning, Kerala
- 8. 8 PROFILE OF THE DISTRICT District Spatial Plan - Thrissur 1.4.2 LAND UTILIZATION The land utilization pattern exhibits the charac- teristics of the district in terms of its growth, develop- ment and activity pattern. It also indicates indirectly the amount of land available for future development. The land utilization pattern of Thrissur district is broadly classified under the categories listed in Table 1.3. Chimmoni Dam Puthenthodu in Thrissur Taluk, Sangumugham canal in Mukundapuram Taluk, and Canoli canal in Chavakkad Taluk form the important inland waterways in the District. Athirappally is famous for a beautiful 80 feet high waterfall at the entrance to the Sholayar ranges. This waterfall joins the Chalakudy River. Vazhachal water- fall lies east of Chalakudy, near the entrance to the Sholayar forest ranges. Athirappally and Vazhachal are the most famous waterfalls of Kerala which attract Athirappally water falls plenty of tourists. Fig 1.6. Water bodies of Thrissur District Department of Town & Country Planning, Kerala
- 9. District Spatial Plan - Thrissur PROFILE OF THE DISTRICT 9 Table 1.3 Thrissur District: Land Utilization Pattern by Category, 2003-05(Area in Ha) 2003-04 2004-05 Land Utilization category Area % Area % Geographical area (in ha) 299390 100 299390 100 Net sown area(in ha) 141685 47.32 136847 45.71 Fallow land(in ha) 5224 1.74 4911 1.64 Current fallow(in ha) 9159 3.05 9658 3.23 Cultivable waste(in ha) 3038 1.01 2937 1.0 Forest(in ha) 103619 34.61 103619 34.61 Uncultivable Land 40464 13.52 40464 13.52 Source: Agricultural Statistics 04-05. 1.5 SOCIO-ECONOMIC ASPECTS state in India having literacy rate of 90.86%. Inter-dis- In the case of socio-economic aspects the follow- trict comparison within Kerala reveals that the highest ing parameters are analyzed. literacy is recorded in Kottayam district (95.9%) and the lowest is in Palakkad district (84.3%). Thrissur District Literacy rate (1991 and 2001); had the 8th rank in 1991 census. In 2001 the literacy rate Share of Work force (1991 and 2001); of Thrissur is 92.27%, which is above state average. The Gross state Domestic Product (2008-09); rural and urban literacy rate of Thrissur are 91.50% & Net State Domestic Product (2003-04); and 94.23% respectively. The district has got 6th rank for lit- Per capita Income (2008-09) eracy rate in 2001 census. The share of male literates is a) Literacy Rate: 48.86% while female is 51.14%. Literacy rate in various District, 2001 census is given in table 1.4 As per 2001 census, Kerala is the most literate Table 1.4 Literacy Rate in various districts, 2001 No Name of the District Literacy rate in % 1 Kasaragod 84.57 2 Kannur 92.59 3 Wayanad 85.25 4 Kozhikode 92.24 5 Malappuram 89.61 6 Palakkad 84.35 7 Thrissur 92.27 8 Ernakulam 93.20 9 Idukki 88.69 10 Kottayam 95.82 Department of Town & Country Planning, Kerala
- 10. 10 PROFILE OF THE DISTRICT District Spatial Plan - Thrissur 11 Alappuzha 93.43 12 Pathanamthitta 94.84 13 Kollam 91.18 14 Thiruvananthapuram 89.28 Source : 2001 Census c) Gross State Domestic Product (GSDP): b) Share of Workers: During 2008-09 the contribution from primary, The work participation ratio (WPR) in Kerala has secondary and tertiary sectors to the GSDP of state at increased from 31.43% to 32.30% from 1991 to 2001 cen- constant prices (1999-2000) was 12.42%, 25.02% and sus. In 2001 Census, Thrissur district holds 9th rank with 62.56% respectively. While analyzing the sectoral dis- 32.12 % of WPR, which is below the state average. The tribution of state income it is seen that the contribu- WPR of main, marginal and other-workers of Thrissur tion from primary sector is decreasing and tertiary sec- district and the State is given in table 1.5. tor is increasing. But secondary sector remains almost stagnant. Table 1.5 WPR of workers - comparison with state GSDP district wise distribution as factor cost Catagory of worker Thrissur Kerala shows that Ernakulam District continues to have high- Main workers 27.20% 25.87% est income of Rs. 19940.06 crore in 2008-09. While low- Marginal workers 4.92% 6.43% est gross domestic product was recorded in Wayanad district (Rs. 2440.12 crore). The GSDP of Thrissur district Other workers 67.88% 67.70% was Rs. 13338.06 crore, (9.87% of total GSDP of State) in Source : 2001 Census 2008-09 and is ranked 3rd in the state. The details are given in Table 1.6. Table 1.6: GSDP in various districts, 2008-09 NO NAME OF DISTRICT GSDP IN CRORE STATE PERCENTAGE 1 Thiruvananthapuram 14941.69 11.05% 2 Kollam 9974.42 7.38% 3 Pathanamthitta 5321.41 3.94% 4 Alappuzha 8755.38 6.48% 5 Kottayam 9495.00 7.02% 6 Idukki 4354.11 3.22% 7 Ernakulam 19940.06 14.75% 8 Thrissur 13338.06 9.87% 9 Palakkad 10209.08 7.55% 10 Malappuram 10303.48 7.62% 11 Kozhikode 11938.27 8.83% 12 Wayanad 2440.12 1.8% 13 Kannur 9743.37 7.21% 14 Kasargode 4448.04 3.29% Total 135202.49 Source: Department of Economics & Statistics Department of Town & Country Planning, Kerala
- 11. District Spatial Plan - Thrissur PROFILE OF THE DISTRICT 11 District wise and sector-wise analysis of GSDP shows was 3443.72 crore and it was ranked 3rd place in the state. that the highest contribution from primary sector in- Lowest secondary sector income was in Wayanad dis- come of Rs. 1602.09 crore at constant (1999-2000) prices trict (Rs.350.36 crore). Regarding tertiary sector the high- was in Kottayam district during 2008-09. The contribu- est income during 2008-09 was in Ernakulam district tion of Thrissur district from primary sector was 1169.87 (Rs.10752.26 crore). The contribution of Thrissur district th crore and it was ranked 8 place in the state. During from tertiary sector was 8724.47 crore and it was ranked 2008-09 the lowest primary sector income was in 3rd place in the state. Lowest tertiary sector income was Wayanad District (Rs. 589.19 crore). in Wayanad district (Rs.500.57 crore). The district wise The highest income from secondary sector during details of sectoral income and growth rate are presented 2008-09 was in Ernakulam district (Rs.7599.91 crore). The in Annexe 2 and the same is shown in fig 1.7. Hence the contribution of Thrissur district from secondary sector analysis of the Gross State Domestic Product shows that 25000 Thrissur is third highest contributor of Secondary and Territory sector GSDP of the State. 20000 Rs. Crore 15000 TERITARY SECONDARY 10000 PRIMARY 5000 0 i r ad e r r a m l a m i t t a zha am k k l a m su k a m od ad n u od pu l o m th u tay I d u k u p t i s l a k p u r hik r a an a n a r g y K th a K a ap Ko na Th P ap o z a s n n Al Er al K W Ka na t ha M va Pa i ru District Th Fig 1.7.District -wise Sectoral Distribution of GSDP at current prices - 2007-08 Table 1.7 NSDP in various districts - 2003-04 No Name of District NSDP in crore State Percentage 1 Thiruvananthapuram 8829.88 11.19% 2 Kollam 6358.60 8.06% 3 Pathanamthitta 3079.76 3.9% 4 Alappuzha 5345.92 6.77% 5 Kottayam 5464.63 6.92% 6 Idukki 3229.55 4.09% 7 Ernakulam 9957.15 12.61% 8 Thrissur 7932.79 10.05% 9 Palakkad 5559.50 7.04% 10 Malappuram 5924.31 7.51% 11 Kozhikode 7318.83 9.27% 12 Wayanad 1618.42 2.05% 13 Kannur 5591.80 7.08% 14 Kasargode 2722.19 3.45% Total 78933.33 Source: Statistics for Planning Department of Town & Country Planning, Kerala
- 12. 12 PROFILE OF THE DISTRICT District Spatial Plan - Thrissur c) Net State Domestic Product (NSDP): in 2008-09 as against Rs.56060 in 2007-08. The per capita NSDP district wise distribution as factor cost income of Thrissur District has increased from Rs. 39658 shows that the Ernakulam district continues to have in 2007-08 to Rs. 42316 in 2008-09 with growth rate of highest income at Rs. 9957.15 crore in 2003-04, while 6.7% and it is ranked 4th place in the state. The lowest lowest net domestic product was recorded in Wayanad per capita income was recorded in Malappuram district district (Rs. 1618.42 crore). The NSDP of Thrissur dis- (Rs.25291) in 2008-09 at constant prices. trict was Rs.7932.79 crore, (10.05 % of total NSDP of The highest rate of growth of per capita income State) in 2003-04 and is ranked 3rd in the state. The dis- of 6.97% was recorded in Ernakulam District in 2008-09 trict wise NSDP is given in Table. 1.7. followed by Trissur (6.70%). The growth rate of per capita income of the district is higher than the state (6.15%). d) Per Capita Income (PCI): The lowest growth rate was recorded in Wayanad Dis- The analysis of district wise per capita income trict (4.47%). The district wise per capita income with shows that Ernakulam district stands first with the per growth rate is given in Table 1.8. capita income of Rs.59970 at constant (1999-2000) prices Table 1.8: PCI in various districts, 2008-09 No District PCI (in Rs) Rank G.R(%) 1 Thiruvananthapuram 43247 3 6.26 2 Kollam 36698 10 6.09 3 Pathanamthitta 42166 5 6.49 4 Alappuzha 40089 6 6.60 5 Kottayam 46362 2 6.04 6 Idukki 37374 9 5.14 7 Ernakulam 59970 1 6.97 8 Thrissur 42316 4 6.70 9 Palakkad 36487 11 5.63 10 Malappuram 25291 14 5.09 11 Kozhikode 38798 7 6.33 12 Wayanad 28047 13 4.47 13 Kannur 38634 8 6.37 14 Kasargode 34006 12 5.25 Total 39815 6.15 Source: Department of Economics & Statistics Department of Town & Country Planning, Kerala
- 13. District Spatial Plan - Thrissur PROFILE OF THE DISTRICT 13 1.6 INFERENCE trict is blessed with mountains and rivers. The literacy Thrissur District has 17 development blocks, six rate of the district is 92.27% and work participation rate Municipal Council and one Municipal Corporation. is 32.12%. Thrissur district can be divided into 5 well defined physi- The district contribute 9.87% of the total GSDP of ographic regions namely (i) Low lands (ii) Mid Lands the state and is ranked 3rd in the state. The sectoral (iii) Mid Up Lands (iv) Up Lands (v)High Lands. The dis- contribution of the district into the state GSDP shows trict has about 33.34% of its geographical area as forest that the district is the 3rd highest contributer in sec- mainly seen in the eastern part of the district. The Dis- ondary and tertiary sector. Department of Town & Country Planning, Kerala < CONTENTS > CHAPTER 2 >>