Futurewatch panoptic
•
0 gefällt mir•293 views

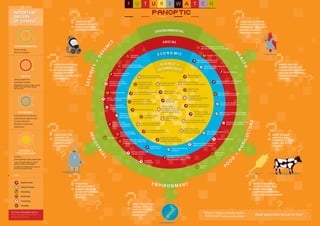
Future trend map by New Zealand's Ministry of Science.

Empfohlen
Empfohlen
Weitere ähnliche Inhalte
Mehr von Nares Damrongchai
Mehr von Nares Damrongchai (17)
Futurewatch panoptic
- 1. IMPORTANT DRIVERS OF CHANGE HOW CAN WE HOW CAN WE BETTER ENHANCE SECURITY FOCUS ON EFFECTIVELY WHILE ALSO SAFE MANAGING “WELLNESS” GUARDING PRIVACY? RATHER THAN JUST TREATING ILLNESS? ENVIRONMENTAL Tensions between enhanced security and protection of privacy Climate change Resource limitations Changing Fertility rates behaviours Internet-enabled access to information and services HOW CAN ATTITUDES Protecting and sharing WHERE ARE THE Intellectual Property Rights Costs for medical diagnostics AND BEHAVIOURS and treatments OPPORTUNITIES FOR BE ENCOURAGED TO CONTAINING COSTS OF Levels of obesity CHANGE TO HELP Focus on renewable HEALTHCARE WITHOUT ADDRESS UNDERLYING energy resources New forms of sharing Moving beyond COMPROMISING SOCI AL genomic data CHALLENGES? and visualising information HEALTH? Ageing populations Concerns over who Use of genetics to inform health, Sustainable lifestyles Institutional and Biology becoming Systems thinking to controls technologies diet and lifestyle decisions researcher inertia understand complex systems Affordable access to high quality and resources more predictive health care and other goods to new ways of and services doing science Making sense Faster, cheaper of the data Financial markets Manufactured nanomaterials sequencing of DNA Changing business models, with novel properties such as outsourcing R&D “Bio-nano-info” Extent, nature and pace Convergences of biotech, of climate change Characterisation and Faster, cheaper nanotech and ICT assessment standards for computing manufactured nanomaterials Concern for ethical Moving toward a Range and sophistication agricultural production carbon constrained “Robot creep” of genetic modifications future Increasing use of robots Biofuels development for military, industrial and EC ONOMI C domestic applications Synthetic biology New pests and diseases emerging Whole of value chain – building organisms and resurgence of existing ones Profitability and productivity assessment for new Turning cellulose Techniques for from scratch technologies into ethanol engineering the Exploiting new opportunities climate Clinical successes with Consumer demands Desire for more gene therapy emerging Demand for improved food Remote monitoring and Regulatory frameworks effective and equitable safety and traceability environmental sensing Globalisation resource management Use of adult stem Developing production cells for clinical and Having a suitably systems less reliant on oil veterinary therapies GM crops being grown trained and skilled more widely HOW DOES THE workforce WHAT SHOULD DELIVERY OF Biodiversity Design-led innovation NEW ZEALAND Tensions between short-term improving product safety, Food vs fuel debate GOVERNMENT techno-fixes and addressing usability and sustainability FARMING SYSTEMS SERVICES NEED underlying issues Regulatory responses to new LOOK LIKE IN THE TO CHANGE? science and technologies FUTURE? Investment in “Clean Tech” “Green”and ethical SC I ENCE + investors Spiritual, ethical and Competing TEC HNOL OG Y cultural concerns Influence of multinational land uses Curiosity companies and supermarkets Solving problems and unmet needs on production systems Access to Tools and techniques to study fresh water nature, matter and people Wild fish e-research enabling new ways to share and analyse data stocks Rapid increase WHAT WILL WHAT IS REQUIRED Gradual increase NEW ZEALAND’S TO EFFECTIVELY AND ENERGY NEEDS BE FAIRLY MANAGE Decreasing IN THE FUTURE AND COMPETING RESOURCE HOW CAN THEY AND LAND USE DEMANDS? Bottlenecks BE MET? Uncertainty WHAT ROLES WILL Changing SCIENCE NEED TO PLAY IN CREATING For more information go to: SUSTAINABLE “And in today already walks www.morst.govt.nz/current- INDUSTRIES? tomorrow”SAMUEL TAYLOR COLERIDGE WHAT QUESTIONS OCCUR TO YOU? work/futurewatch/
- 2. OCTOBER 2009 THE MINISTRY OF RESEARCH, SCIENCE AND TECHNOLOGY P R E PA R E D F O R N E W Z E A L A N D G O V E R N M E N T A G E N C I E S B Y Potential bottleneck or barrier S CA N S U MMA RY Stimulating influence S CI E N CE A N D TECH N OLOG Y science and technologies implications with the patient. Regulatory responses to new the genetic data and to discuss required to help make sense of doctors, counsellors, etc are to provide adequate safeguards. Appropriately trained researchers, discourage innovation and/or fail with developments can Regulations that fail to keep up trained workforce Having a suitably Faster, cheaper computing applications. sequencing of DNA appropriately regulate clinical Cheaper and quicker thinking about how to over the internet is stimulating Ready access to genomics data of the data and lifestyle decisions Making sense inform health, diet Use of genetics to Systems biology and effects. better understanding of causes Levels of obesity biological data can lead to a Linking genetics with other information and services Internet-enabled access to Changing behaviours information has little effect. lifestyle may mean that the genetic and behaviours to health, diet and Reluctance to change attitudes THAN JUST TREAT SICKNESS? USED MORE EFFECTIVELY TO PREVENT RATHER THAT ENABLE (OR INHIBIT) GENETICS TO BE EXAMPLE WHAT WILL BE IMPORTANT FACTORS AN EXAMPLE OF HOW TO USE THE F U T U R E W A T C H F U T U R E W A T C H MoRST 2009 Science and Technology Scan Summary Some underlying drivers of change in New Zealand SOCIAL F OR EC A ST F OR N EW Z EA L A N D : F E WE R B A BIE S , M ORE W RIN K LI ES WHAT IS This poster provides an overview of the trends and scanning observations made during 45 THIS POSTER? 2008 and 2009 by MoRST’s science and technology scanning network. Observations are Forecast 40 derived from a variety of sources – published scientific papers, reports from governments PERCENTAGE OF POPULATION 35 or other organisations, media reports, conferences, and blogs. Many of the observations 0-14 yrs are based on developments occurring elsewhere, but may have significant implications 30 15-39 yrs for New Zealand. More detailed assessments of some of the trends can be found on 25 40-64 yrs MoRST’s website, along with links to other futures’ related material – 20 65-84 yrs www.morst.govt.nz/current-work/futurewatch/ 15 85+ yrs 10 The observations are divided into four categories – science & technology, economic, 5 social, and environment (ie the natural world). This is a simplification (due to space 0 constraints) of the traditional PESTLE (political, environmental, social, technological, legal 1991 2001 2011 2021 2031 2041 2051 2061 and economic) framing of futures work. Some of the observations encompass more than one of these categories and observations related to politics or the law may be C ON S EQ U EN C ES F OR H EA LTH EX PEN D I TU R E placed in one of the other spheres depending on the issue. Some major global drivers of change and trends that underlie some of the observations are identified to the left of the main diagram. Examples of some important New Zealand drivers and trends are shown on the next page. Observations are subjectively characterised as: Ages 65+ 40% Ages 65+ 51% Ages 65+ 63% I Rapid increase – a trend or development that is progressing rapidly Ages 15-64 + 48% Ages 15-64 + 41% Ages 15-64 + 31% (such as significant progress over the past year) Ages 0-14 + 12% Ages 0-14 + 8% Ages 0-14 + 6% I Gradual increase – a trend or development that is growing at a slower 20 0 2 2 026 20 5 1 but steady rate NZ HEALTH BILL: $7.7 BILLION $14.3 BILLION? $25.7 BILLION? I Decreasing – signifying a decline or an absence of recent progress Source: Ministry of Health (2004). Population ageing and health expenditure: New Zealand 2002–2051. I Bottlenecks – factors with the potential to inhibit developments or applications I Uncertainty – issues where at the moment it is not clear how they may change ECONOMIC N EW Z EA L A N D ’S D E CL IN IN G PR O D U CT IV I TY and/or influence other elements 100 I Changing – noting that the identified issue is currently experiencing a change 90 in state rather than a change in pace GDP PER HOUR WORKED 80 (AS PERCENT OF USA) The diagram does not provide a comprehensive overview of all major scientific developments 70 Australia and trends. It only reflects observations that members of the scanning network have Finland 60 New Zealand provided over the last year, based on their areas of expertise and interest. MoRST intends 50 to update the poster annually. 40 HOW TO USE IT This poster is intended to stimulate thinking about future implications for New Zealand 30 of scientific trends and developments. The main diagram does not indicate what will or is likely to occur, or provide a timeframe. Instead we are using it to illustrate that 1985 1988 1991 1994 1997 2000 2003 2006 science and technologies do not develop linearly, but are influenced by, and influence, Source: OECD a range of other contextual factors (ethical, cultural, political, economic, etc). The diagram encourages consideration of the policy implications for New Zealand of E N V I R O N M E N TA L C H A LL EN G E: RE D U CIN G G R EEN H O U SE G A S E M I SSI O N S scientific and technological developments, particularly in relation to five main areas – 18 GREENHOUSE GAS ABSOLUTE CHANGE health, food & agriculture, the environment, industrial development, and security & 16 RELATIVE TO 1990 (MEGA TONNES) 14 defence. Illustrative questions to prompt thinking about implications for New Zealand Total Emissions 12 Energy are included around the edge of the diagram. Feel free to write your own questions. 10 Agricultural 8 Industrial Processes NAVIGATING While some observations are clustered in the area where they are directly relevant Waste 6 THE POSTER (eg health, or food & agriculture) many of the observations can be relevant to more than 4 one area (such as changing behaviours and regulatory responses). On the back of the 2 poster is an example of one way in which some of the information can be used to 0 consider how different elements may influence each other. -2 DISCLAIMER Comments and views included on this poster do not necessarily represent the views 1990 1992 1994 1996 1998 2000 2002 2004 2006 of the Ministry of Research, Science and Technology or the New Zealand government. Source: Ministry for the Environment (2007). Environment New Zealand 2007 LIFT TO OPEN