SlideShare ist ein Scribd-Unternehmen logo
1 von 18
Downloaden Sie, um offline zu lesen
IJOPM
19,7
738
International Journal of Operations &
Production Management,
Vol. 19 No. 7, 1999, pp. 738-755.
# MCB University Press, 0144-3577
A pragmatic approach to
product costing based on
standard time estimation
Jianxin Jiao and Mitchell M. Tseng
The Hong Kong University of Science and Technology,
Kowloon, Hong Kong
Keywords Product costing, Cost estimating, Activity-based costing, Time
Abstract Proposes a pragmatic approach to product costing. The approach involves two stages,
namely the preparatory stage and the production stage. In the preparatory stage, standard
routings are first extracted from existing products. A generic activity hierarchy is established
according to the analysis of standard routings, where cost drivers for each activity are identified
and summarized by appropriate Cost-related Design Features (CDFs). Then the Maynard
Operation Sequence Technique (MOST) is employed to analyze each operation of standard
routings to determine the associated standard time. Historical cost data are analyzed to induce
the relationships between the CDFs and standard time, namely Time-Estimating Relationships
(TERs). By allocating plant-wide overhead costs to standard routings, the unit price of standard
time is established to indicate Cost-Estimating Relationships (CERs). A library of material costs is
also summarized from existing products. In the production stage, CDFs are first induced from the
schematic of a new design. Then a ``dummy process plan'' for this design can be inferred and
used to retrieve the associated TERs to determine its time estimate. Once a standard time has
been estimated, CERs can be applied to compile the total product cost by adding the estimated
material costs. A case study conducted in an electronics enterprise is also reported.
1. Introduction
Manufacturing is often viewed as the entire process of delivering an artifact in
response to customer needs. Product design plays the central role within this
broad view of manufacturing. It is well known that, particularly in discrete
goods manufacturing, a predominant percentage (up to 85 percent) of the
manufacturing cost of a product is established through decisions made during
the product design stage (Whitney, 1987). This implies that the largest impact
on product cost can be made in the design process. Therefore, the ability to
make design decisions is dependent upon the availability of cost estimates for
each alternative during the early development phase (Ostwald, 1992). Such a
process of estimating the final cost of a product at the design stage is often
referred to as product costing (Sheldon et al., 1991). Product costing supports
the entire product realization in two aspects. First, they make designers aware
of a product's suitability for production, thus indicating potential cost
reduction areas (Keys et al., 1987). Second, production costs are an important
The current issue and full text archive of this journal is available at
http://www.emerald-library.com
This research is partially supported by an electronics company in Hong Kong (CPI 95/96.EG01),
the HKUST Research Infrastructure Grant (RI 93/94EG08), and Hong Kong Research Grant
Council (HKUST 797/96E). The authors would like to express their sincere appreciation to Dr
W.K. Lo and Mr Jonathan H.K. Tsui for their support.
Product costing
739
part of the total product cost, hence estimation of these costs helps to determine
appropriate sales prices (Ostwald, 1992).
Resulting from its paramount importance, product costing has received
enormous attention and popularity in industry and academia alike (Sheldon et
al., 1991; Ostwald, 1992). Though a number of methods have been proposed and
practiced, there is still much to be desired due to the hindrance inherent in the
product costing process. Product costing involves quite a few instruments such
as the description of the product (the technical system to be made), knowledge
about the manufacturing systems and technologies, recognition of the markets
regarding raw materials and semi-finished goods, application of cost
calculation methods, and so on. The difficulties associated with product costing
lie in several aspects including lack of manufacturing knowledge, dependence
on detailed design description, no structured mapping between design and
production, and contextual heterogeneity. First, cost estimation has
traditionally been the province of manufacturing engineering. Typically, the
product cost is derived from the summation of various cost components such as
materials, machine hours, direct labor, administration, and engineering costs
(Ostwald, 1992). However, cost accountants often do not have sufficient
knowledge of manufacturing processes and the cost incurred therein (Sheldon
et al., 1991). Second, a reliable cost estimation requires detailed knowledge of
product design and process plans. Usually, a complete description of the
product is not available at the conceptual phase (Hundal, 1993). Third,
relationships between design attributes and their cost figures are often not
clearly available in the early design stage. It is difficult, if not impossible, to
establish accurate cost structures according to the sources from which they
arise and approximate cost functions accurately according to actual cost data
(Ulrich and Fine, 1990). Lastly, different departments within manufacturing
organizations focus on different cost-carrying areas, thus employing different
costing methods and using various sets of costing data for different purposes.
Cost accountants are always under great pressure to produce a wide variety of
cost information for various decision makers and to maintain the coherence of
diverse cost structures so that a variety of costing methods can be supported
(Sheldon et al., 1993). This is particularly important in the contemporary
business environment where there is a growing emphasis on time-based
competition as well as a greater degree of customization of products. The
emerging paradigm of mass customization emphasizes the coordination among
sales, marketing, design, and manufacturing, where cross-functional product
costing plays an important role in matching a company's process capabilities
with the window of market niches (Tseng and Jiao, 1996).
To address the above issues, this paper proposes a pragmatic approach to
product costing prior to the actual production run by adopting the ABC
(Activity-Based Costing) concept and utilizing historical cost data. To allow the
designers to make a good trade-off decision, this approach emphasizes
modeling cost information and identifying the product cost during the early
design stage where only a schematic design may be available, yet a large
IJOPM
19,7
740
proportion of the manufacturing cost is still to be determined. The work
reported in the paper is summarized from an industrial project with a local
electronics enterprise. Its main products are power supplies that represent
typical characteristics of electronic product design and manufacturing.
The remainder of the paper proceeds as follows. In the next section, different
existing approaches to product costing are summarized. Section 3 presents a
Pragmatic Product Costing (PPC) approach along with its systematic
framework. A case study of PPC implementation is described in Section 4.
Testing results and discussions are also given in Section 4. Finally, conclusions
are drawn in Section 5.
2. Literature review
Although there is a considerable amount of literature available on product
costing, the first comprehensive work was published by Ehrlenspiel (1985). The
book provides guidelines and rules for lowering product costs, and methods for
estimating these during the design process. A continual emphasis in the book is
on the systematic design method (Pahl and Beitz, 1988). They pointed out that
while products are influenced at all stages of their life-cycle ± from design order
to sales ± the most important factors are the concept, size of the product, and
number of parts. Ott and Hubka (1985) described a method for calculating the
manufacturing cost of weldments based on weld dimensions. They calculated
the time requirements for each welding operation. Ostwald (1992) provided a
thorough treatment of cost estimating, including the pertinent topics of
operation and product cost estimation. A discussion of practices in
manufacturing, construction, as well as chemical, electronic and mechanical
industries is given by Sheldon et al. (1991). Various costing methods can be
classified in terms of categorization of manufacturing costs, cost structures,
and cost models.
Total manufacturing costs can be classified in several ways (Ostwald, 1992).
For example, they may be divided into material and production costs. They
may also be categorized as direct costs and overhead costs. Further, the costs
may be divided into variable costs that consist of direct costs and variable
overhead costs, and fixed costs that remain constant over a period of time. It is
the variable costs that can be influenced most at the design stage (Hundal,
1993). The predominant approach conventionally employed in cost estimation
is what is termed the ``burdened'' (Fritz and Kimbler, 1996) or ``volume-based''
(Fendrock, 1992) costing approach. It uses an allocation base such as direct
labor dollars, machine hours, or material dollars to assign indirect costs to
products. The assumption is based on the unit-level characteristics of the
products where the allocation base is directly proportional to product volume
(the number of product units) and resources are consumed in proportion to
product volume. In many cases, however, high-volume products are over-
costed while low-volume products are under-costed. As argued by Fritz and
Kimbler (1996), this method can significantly distort product pricing in
Product costing
741
operations that encounter fluctuations in production, volume, complexity, size,
materials, and setup, where volume-based allocations are not directly
proportional to production volume.
A cost structure shows the breakdown of the product cost according to one
of several criteria such as parts, types of cost, functions, production processes,
etc. Sheldon et al. (1991) classify cost structures into four types: organizational
breakdown based on departments and units, general breakdown based on
elements and features of the products, functional breakdown based on
functions of the products, and work breakdown based on activities. Ehrlenspiel
(1985) used a magnitude-based costing analysis to categorize products
according to particular properties, such as weight and costs. This approach
highlights the more important aspects of the design according to the chosen
category. Hundal (1993) emphasized the aid of value analysis to increase the
value-to-cost ratio of a product. French (1990) advocated function-costing to
provide designers with a technique for estimating costs directly from the
specification of a product. Activity-based costing adopts the work (activity)
breakdown structure to assign indirect costs more accurately and gives greater
visibility to manufacturing activities for planning and control (Innes and
Mitchell, 1990).
Among many costing models in design, the most noteworthy are those
based on operations, weight, material, throughput parameters, physical
relationships, regression analysis, and similarity laws (Ostwald, 1992). The
regression approach tries to find the dependence relationships between costs
and product characteristics such as size and materials. The coefficients and
exponents are derived through the regression analysis of historical cost data
(Pscyna et al., 1982). The group technology based approach is based on the
similarity principle. It typically uses a basic cost value while taking into
account the effects of variable cost factors such as complexity and size. Linear
relationships between the final costs and the variable cost factors are always
assumed (Hundal, 1993).
In summary, the majority of the literature addressing cost estimating
techniques to date focuses primarily on the final production function, i.e.
manufacturing. The problem lies in that complete product design information
must be available before an estimate can be computed. Current trends towards
compression of design to market times have impeded their use as the time
required for gathering cost data and performing cost studies is eroded (Bush
and Sheldon, 1995). In addition, many cost estimation techniques have been
developed for different products based on various cost drivers. The explicit
cost drivers, such as material cost, can be obtained directly while the implicit
ones, such as design complexity-related costs, have to be derived through
analysis of historical cost data. Therefore, the linchpin to product cost
estimation is how to use historical cost data to understand the implicit cost
drivers. Moreover, in today's manufacturing environment, direct labor costs are
decreasing because of the application of advanced manufacturing technologies
and management techniques, and costs are shifting from direct to indirect
IJOPM
19,7
742
(Brismon, 1986). Accordingly, traditional costing, mainly using direct labor to
allocate the indirect (overhead) costs to products, will distort product costing.
In view of this deficiency, activity based costing (ABC) divides the overhead
costs into several pools and has been recognized as a more rational approach to
determining how and why the overhead costs arise (Innes and Mitchell, 1990).
The main disadvantage of ABC is the difficulty in obtaining accurate
information which would enable the proper allocations (Hundal, 1997), that is, it
is difficult to obtain the cost per unit of the activity's output (unit price of a cost
driver). It has also been argued that ABC requires detailed activity analysis,
which implies significant changes in existing cost accounting systems (Sheldon
et al., 1991).
3. A pragmatic product costing approach
The standpoint of the PPC approach is to utilize historical costing data. The
rationale manifests itself through the fact that most engineering designs
involve modifying existing products instead of starting from scratch.
Accordingly, patterns of cost estimation in existing products are applicable to a
new design. For this type of variant design, where similar work has been done
before, there is greater knowledge of costs that can be extrapolated to a new
product with a higher degree of confidence. Although in the earlier stages of
design the cost estimation can only be approximate, decisions made in its
absence can be costly (Hundal, 1997).
The PPC approach adopts the ABC concept to identify the underlying
activities that drive costs. These activities are then used as building blocks to
construct the costs of a given process or work center. However, the hindrance
inherent in ABC lies in how to determine the resource consumption in terms of
number of cost drivers for each activity and the unit price of each activity with
respect to a particular cost driver. Instead of dealing with these trivia, the PPC
approach determines resource consumption according to the estimated
processing time for each activity timed by the unit price of standard time. This
intermediate measurement provides a common, consistent metrology to
approximate various cost functions for different activities and cost drivers. The
feasibility is embodied by the large amount of effort devoted to standard time
estimation from both research and practice, such as work measurement and
time study (Hodson, 1992). Table I gives a comparison of ABC and PPC.
Instead of reliance on detailed design information and manufacturing
knowledge, the PPC approach aims at a rapid cost estimation without
developing detailed process plans. Considering that a large majority of
products follows a finite set of process routings, the PPC approach first extracts
these standard routings generic to all the products according to historical
production documents. Every standard routing is associated with a set of
design characteristics that can be employed to determine the possible standard
routings applied to manufacturing a given product. These characteristics are
Product costing
743
referred to as Cost-related Design Features (CDFs) and are treated as indexes to
infer a ``dummy process plan'' for rapid cost estimation in PPC approach.
Usually CDFs can be determined from a schematic in an early stage of design.
The PPC approach involves two stages, namely the preparatory stage and
the production stage (Figure 1). In the preparatory stage, standard routings are
first extracted from existing products and depicted by a Process Flow Diagram
(PFD). A generic activity hierarchy is established according to the analysis of
standard routings, where cost drivers for each activity are identified and
summarized by appropriate CDFs. Then the Maynard Operation Sequence
Technique (MOST) is employed to analyze each operation of standard routings
to determine the associated standard time. Historical cost data are analyzed to
induce the relationships between the CDFs and standard time, namely Time-
Estimating Relationships (TERs). By allocating plant-wide overhead costs to
standard routings, the unit price of standard time is established to indicate Cost-
Estimating Relationships (CERs). A library of material costs is also summarized
from existing products. In the production stage, CDFs are first induced from the
schematic of a new design. Then a ``dummy process plan'' for this design can be
inferred and used to retrieve the associated TERs to determine its time estimate.
Once standard time has been estimated, CERs can be applied to compile the
total product cost by adding the estimated material costs.
Table I.
A comparison of ABC
with PPC
Typical activity-based costing (ABC)
Operation A
Cost drivers
(CDs)
Consumption
(# of CDs)
Unit price of cost
drivers ($ per CD)
Calculated costs for
each activity
Activity A1 CDA1 XA1 CIA1 CA1 ˆ …XA1†Ã
C1A1
Activity A2 CDA2 XA2 CIA2 CA2 ˆ …XÃ
A2CIA2
Activity A3 CD1
A3 XA3 CI1
A3 C1
A3 ˆ …X1
A3†Ã
CI1
A3
CD2
A3 X2
A3 CI2
A3 C2
A3†Ã
CI2
A3
Ai CDAi XAi CIAi CAi ˆ …XAi†Ã
CIAi
Estimated cost of operation A
€
…CAi
Pragmatic product costing (PPC)
Operation A Cost-related
design features
Consumption
(# of CDFs)
Time-estimating
relationships (TERs)
(sec per activity)
Cost-estimating
relationships (CERs) ($
per hour)
Activity 1 CDFA1 XA1 StdTA1 ˆ KÃ
A1XA1 y
Activity A2 CDFA2 XA2 StdTA2 ˆ KÃ
A2XA2
Activity A3 CDF1
A3 X2
A3 StdTA3 ˆ K1
A3 Ã XA3
CDF2
A3 X2
A3 ‡K2
A3 Ã X2
A3
Ai CDFAi XAi SdtTAi ˆ
€
…KAij†
Total estimated time of operation A SdtT ˆ
€
…StdTAi†
Total estimated cost of operation A …StdTa60†Ã
v
IJOPM
19,7
744
3.1 Standard routing development
The development of standard routings depends on both the knowledge of
domain experts and the product history. An effective approach is first to
analyze the product database for standard routings and then to use expert
opinion on process plans and cost estimation to consolidate the results. A
PreparatoryStageProductionStage
PreparatoryPool
Product
Specifications
Material
CostLibrary
PartType
PartNumber
PartPrice
StandardRoutingIdentification
Processflow
Diagram(PFD)
Activity
Hierarchy
CostDrivers
(CDs)
Cost-relatedDesign
Features(CDFs)
StandardTimeEstablishment
Work
Measurement
(MOST)
Time-Estimating
Relationships(TERs)
Over-Estimating
Relationships(CERs)
Plant-wideOverheadCostsAllocation
NewProduct
DesignSchematic
Component
List
InferredRouting
PFD
CDFs
Material
Costs
StandardTime
Estimation
TotalProductCostCompilation
Figure 1.
Two-stage methodology
of PPC
Product costing
745
Process Flow Diagram (PFD) is suggested to describe standard routings in a
formal way. Figure 2 gives an example of such a PFD for the PCB assembly of
encapsulated AC/DC converters.
3.2 Activity hierarchy formulation and CDF identification
To establish the cost structure of ABC, each operation in a standard routing is
treated as a cost center and analyzed to determine the activities that fulfill this
operation. All activities associated with each cost center can be organized by an
activity hierarchy. An activity hierarchy adopts a combined decomposition
(``a_part_of'' link) and classification (``a_kind_of'' link) tree to represent various
inter-relationships among activities. Figure 3 shows the activity hierarchy for
the operation of a heat sink sub-assembly.
The ramifications of an activity hierarchy depend on the identification of
cost drivers for each activity. In the PPC approach, cost drivers associated with
specific activities are identified according to whether the consumption of an
activity can be appropriately expressed in terms of design features instead of
adopting the process characteristics as most ABC efforts have practiced. In
such a way, a set of Cost-related Design Features (CDFs) performs as the cost
drivers to comprise a ``dummy process plan'' and to indicate the consumption of
activities. Figure 3 illustrates the breakdown of an activity hierarchy in parallel
to the identification of appropriate CDFs.
3.3 Standard time establishment and TER approximation
The importance of establishing time standards for improving labor efficiency
and organizational performance has been well recognized (Kilgore, 1997). In
practice, most companies have laid the groundwork for predetermined time
standards such as Motion Time Analysis (MTA), Work-Factor (WF), Basic
Motion Time Study (BMT), and Methods of Time Measurement (MTM)
(Hodson, 1992). The PPC approach aims at taking the advantages of standard
data to alleviate difficulties in ABC implementation.
A popular technique for work measurement, namely, the Maynard
Operation Sequence Technique (MOST1
) is adopted as the core in PPC to
synthesize the standard time data associated with standard routings. MOST1
for WindowsTM
(Maynard, 1997) is a Windows-based work measurement tool
that enables analysts to create and maintain a database of work elements. The
software automatically produces the time for each method step and sub-
operation based on the keyword method description entered by analysts. Final
time standards are developed by further considering the technological and
managerial allowances, as shown in Figure 4.
All standard time estimates obtained from MOST1
are validated according
to the actual data of existing products. Accordingly, the Time-Estimating
Relationships (TERs) for individual activities are induced in terms of the cost
drivers (i.e. CDFs) associated with specific activities. Figure 3 illustrates how
the TERs are derived. The derivation of TERs is based on the regression
analysis that provides the formula for calculating the time for various elements
IJOPM
19,7
746
MagbeticAssembly
AutoInsertion
Material
Issue
PinStakingMaterial
Issue
Sub-Assembly
Material
Issue
ComponentPreparation
MaterialIssue
Stuffing
Wave
Soldering
QC(Stuffing)
(Sampling)
QC(Slodering)
(Sampling)
Flux
Cleaning
Touch
Up
Lead
Timing
(Optional)
Top
Wire
A
Hipot&
FunctionalTest
Can
Assembly
A
WorkmanshipRepair
QC(Workmanship)
CanIsolation
Test(ForMetalCan)
Potting&
Curing
Spray
Painting
&Curing
Cover
Resistance
Soldering
(Optional)
Hipot&
FunctionalTest
Apply
Product
Label
&DateCode
Minor
WorkmanshipRepair
Burn-in
Minor
WorkmanshipRepair
PackingQA
FinalQC
Minor
Workmanship
Deviation
Store
100%Screening
Repair
CrossOutSafetyMarking
QC(Visual
B/IFailure)
Key
Input
Operation
Inspection
Test
Output
Connection
Flowdirection(compulsory)
Flowdirection(operational)
Figure 2.
Process flow diagram
(PFD) for the PCB
assembly of ecapsulated
AC/DC converters
Product costing
747
Work
Centers
(Operations
inStandard
Routings)
Activity
Hierachy
(Cost
Allocation
Pool)
Cost-
related
Design
Features
(CDFs)
Time
Estimating
Relation-
ships
(TERs)
HeatSink(H/S)
Sub-Assembly
H/SSub-AssemblyPanelAssembly
1H/S+TransistorsH/S+Diode
(BySpringClip)3H/S+4Diode1H/S+1Diode
(Bydipsoldering)
(ByScrewMounting)1H/S+NDiode
(Byhandsoldering)
Mountfuse
socketbynut
&insertfuse
MountSocketManualsolder
wiretosocket/
fuse/tab
MountSocket
byelect.
screwdriver
Plugwire
intosocket
MountSocket
byplug-in
Plugcrimp
wiretoPCB
M:ofH/S
N:Totalof
XSTR
–//–N:ofH/S
assembly
–//–N:ofH/S
assembly
–//–
–//–
M:ofH/S
N:Totalof
XSTR
–//–
–//–
M:ofH/S
N:Totalof
diodes
–//–
–//–
N:offuse–//–
M:Frequencyof
PCBhandling
N:ScrewQTY
M:Frequencyof
PCBhandling
N:ofwires
M:Frequencyof
PCBhandling
N:Numberof
solderedjoints
M:Frequencyof
PCBhandling
N:ofsocket
–//–
M:Frequencyof
PCBhandling
N:ofcrimpedends–//–
15.84M+23.04N
15.84M+32.40N19.80M+9.00N10.08M+6.84N10.08M+6.84N
10.08M+10.08N4.50M+3.24N10.08M+28.44N27.79N123.12N
75.96N
A_kind_oflink
A_part_oflink
Key
–//–
Figure 3.
An example of costing
structure design in PPC
IJOPM
19,7
748
contained in the study. The formula is as follows: StdTi ˆ Ki1 Ã CDFi1‡
Ki2 Ã CDFi2 ‡ XXX ‡ Bi, where StdTi is the time estimate for activity i, CDFij is
the j-th cost driver associated with activity i, Kij is the coefficient of StdTi with
respect to the CDFij, and Bi is the intercept. The determination of coefficients is
based on the method of least squares, which basically tries to find the line
where the sum of the squares of the deviation of each data point from the line is
a minimum. Usually, a statistical package, such as Statistica or SAS, can be
adopted to simplify this approximation process. More dedicated parametric
estimation equations can also be derived by using statistical analysis methods,
e.g. StdTi ˆ A Ã …CDFi†B
, where A and B are empirically derived constants.
3.4 Overhead cost allocation and CER development
The derivation of Cost-Estimating Relationships (CERs) is based on the
allocation of overhead costs at different levels of a company. A good starting
point is to use historical cost data along with the collective knowledge of
experts from different divisions. The middle portion of Table II depicts a
typical cost computation sheet for various cost centers of standard routings,
i.e., the indirect cost pool. The right-hand column of Table II calculates the
overhead costs at the plant level, such as selling, general and administration
(SG&A), that are different from those of cost centers. Table II illustrates how
plant-wide overhead costs are translated into the manufacturing cost pool via
Basic Works Measurement
Assembly & Testing
QC Testing/Inspection
Packing & Repairing
“MOST”
Basic Time for Work Content
Technical Allowances
Relaxation Allowance
Contingence Allowance
Special Allowance
Effciency Factor
Operator Efficiency
Allowed (Target)
Allowed Basic Time
for Work Content
Labor (NPDL) Allowance
Technical Holding
Start-up Time
Service Holding etc.
Supervision & Clerical
Material Holding
Training
Allowed Basic Time
for Work Content
Non-Productive Direct
Total Standard Time
Allowed for Operator
Standard Labor Cost
Total Standard Time
X
Standard Labor Rate
Figure 4.
Standard time
establishment
Product costing
749
standard time estimation. In such a way, the overhead costs at different levels
ranging from unit level, batch level, product level to plant wide, can be
allocated to product activities that actually consume them. The employment of
TERs enables the PPC approach to estimate the total product cost, not only the
manufacturing cost. In traditional ABC practice, plant-wide activities have to
be analyzed in terms of their cost drivers, the unit price of each activity,
consumption of each cost driver, and so on. These efforts are deemed to be
overwhelming, if not impossible.
Motivated by current global manufacturing trends, most companies are
establishing geographically distributed plants to take advantage of different
manufacturing sites. In the company under our study, there are two plants,
located in Hong Kong and Zhong Shan, respectively. This distributed
manufacturing raises more difficulty in allocating overhead costs. The
activities, associated with logistics, different plant settings, etc., are very
difficult to analyze by following traditional ABC procedures. In the PPC
approach, however, TERs play an important role in unifying various activities
with respect to different cost drivers. Therefore, dealing with distributed plants
Table II.
Overhead cost
allocation and CER
derivation
Period (96.6-96.12) Indirect cost pool Plant-wide overhead costs
Indirect cost Work centers in std routings Selling, general and administration
Account category Soldering Testing ... Planning Shipping ...
Salaries and wages
Indirect labor a1 b1 ... p1 s1 ...
Premium a2 b2 ... p2 s2 ...
Vacations a3 b3 ... p3 s3 ...
Personnel expenses
Travel b4 ... p4 s4 ...
Training a4 b5 ... p5 s5 ...
Recruiting b6 ... p6 s6 ...
Relocation b7 ... p7 s7 ...
Supplies/services
Stationery b8 ... p8 s8 ...
General operating a5 b9 ... p9 s9 ...
Maintenance a6 ... p10 s10 ...
Utilities a7 b10 ... p11 s11 ...
Fixed charges
Depreciation
Equipment a8 b12 ... p12 ...
Property a9 b13 ... p13 ...
Equipment rental b14 ... ...
Property taxes ... p14 ...
Advertising ... p15 ...
...... ... ... ... ... ... ...
Sub-total $a $b ... $p $s ...
WCs ˆ a ‡ bXXX PW ˆ p ‡ s ‡ XXX
Total indirect costs TIC ˆ WCs ‡ PW
Total standard time StdT ˆ StdTProduct 1 ‡ StdTProduct 2 ‡ StdTProduct 3 ‡ XXX
Cost per std time TICaStdT ($/hour)
IJOPM
19,7
750
can be simply reflected by inducing the proportion of standard labor hours for
each plant, as illustrated in Tables III and IV. Table III summarizes the CERs of
our case study. In addition to facilitating the handling of distributed plants, the
development of CERs possesses an advantage in considering various volume
ranges which are emerging nowadays as one of the important characteristics of
mass customization manufacturing.
3.5 Total product cost compilation
The product costing worksheet in Table IV illustrates the procedure of total
product cost compilation in the PPC approach. There are three parts of costing,
i.e. material costing, direct labor costing, and indirect cost estimation. Material
cost is determined by referring to the price library and the component list.
Types and quantities of various components can be derived from a design
schematic. The price library consists of historical information from suppliers
and is established during the preparatory stage. Once the total standard time
has been estimated according to CDFs and TERs, the direct labor cost and
overhead cost can be derived using appropriate CERs. The equation of total
cost compilation is described in Table IV.
4. Implementation and testing results
By following the above procedures, the PPC approach has been implemented in
the company under our study. Figure 2 shows the PFD for the PCB assembly of
AC/DC converters. Figure 3 illustrates how the costing structure of PPC is
developed. Figure 4 shows the considerations given to the establishment of
standard time. Table III summarizes CERs for different volume ranges and
plants. The Appendix gives an example of standard time calculation sheet. A
worksheet of total product cost compilation is given in Table IV.
Table III.
CERs for the company
Material overhead rate: MOH = 12.7 % (per standard unburden material cost)
HK Labor rate: LR1 = 4.750 (per unit std labor in HK plant)
ZS Labor rate: LR2 = 0.830 (per unit std labor hour in ZS plant)
Indirect labor rate ($ per standard hour)
Volume range (VR) HK (LOH1) ZS (LOH2) Mixed (LOH3)
1-1K 7.250 2.850 4.550
1K-10K 3.300 1.550 2.900
10K-20K 2.250 1.250 1.600
20K-50K 1.700 0.900 1.200
50K-100K 1.510 0.600 1.000
100K-200K 1.313 0.550 0.900
200K-300K 1.120 0.450 0.700
300K-400K 1.100 0.300 0.650
Over 400K 1 0.192 0.580
Product costing
751
To test the potential of the PPC approach, 20 products have been selected as
testing samples. The actual cost, estimated cost, and relative deviation for each
sample product are shown in Table V. The relative deviation of cost estimation
is calculated as:
RD ˆ
C…E† À C…A†
C…A†
 1007
where C…A† and C…E† denote the actual costs and the estimated costs,
respectively. The average relative deviation of cost estimates is about 10 per
cent. From Table V and Figure 5, it can be observed that the relative cost
deviations of 19 samples (or 95 per cent of the total samples) are within ‹10 per
cent. Cost estimation on 12 samples (or 60 per cent of the total samples) is even
within the relative deviation of ‹5 per cent. The maximum cost relative
deviation from the actual cost is about 12 per cent, which is still considered
acceptable by the company.
5. Conclusions
The major drawbacks of traditional approaches to product costing include lack
of manufacturing knowledge, reliance on the detailed design description, poor
cost function approximation, and inability to update estimation algorithms by
using actual cost data. A pragmatic approach has been proposed by adopting
the ABC concept and based on estimated processing time, which shows
Table IV.
Product costing
worksheet
Material costing ALP45-7608
Component list fCPiY i ˆ 2Y 2Y F F F Y mg where m = total types of components Schematic
Direct material cost ($): CM ˆ
€
…CPiÃ
UPi† where UPi = unit price of CPi 14.106
Material overhead rate (%): MOH 12.7%
Burdened material cost ($):CCM ˆ CÃ
M …1 ‡ MOH† 15.8975
Standard time estimation
Activity hierarchy and TERs CDFs
Total stand time (hour): StdT 0.5137
Direct labor costing
HK standard hour percent (%)  100%
ZS standard hour percent (%): 1 À  0
HK standard labor rate ($/hour): LR1Ã 4.750
ZS standard labor rate ($/hour): LR2 0.830
Direct labor cost ± HK ($): CDL1 ˆ StdTÃ
Ã
LR1 2.4401
Direct labor cost ± ZS ($): CDL2 ˆ StdTÃ
…1 À †Ã
LR2 0.000
Total direct labor cost ($): CCDL ˆ CDL1 ‡ CDL2 2.4401
Indirect cost estimation
Volume range: VR 120K
Burdened labor rate ± HK ($/hour): LOH1 1.313
Burdened labor rate ± ZS ($/hour): LOH2 0.550
Burdened labor rate ± HK/ZS ($/hour): LOH3 0.900
Total overhead cost ($): CCOH ˆ StdTÃ
Ã
LOH1 1.1368
‡StdTÃ
…1 À †Ã
LOH2 ‡ StdTÃ
LOH3
Total product costs ($) CP ˆ CCM ‡ CCDL ‡ CCOH 19.4744
IJOPM
19,7
752
Table V.
Testing results
Product model C…A† ($) C…E† ($) RD (%)
NFN40-7630E 14.71 13.72 ±6.7
NFN40-7632E 10.94 11.15 1.9
NFS40-7608 9.97 1.066 6.9
NFS85-7632 11.46 11.42 ±0.3
NFN25-7631E 8.43 8.84 4.9
NFS25-7629 24.01 24.22 0.9
NAN25-7610 7.69 7.73 0.5
NAL40-3215 6.16 6.37 3.4
NFS85-7630 7.45 7.37 ±1.1
NAL40-3245 6.50 6.07 ±6.6
NFN40-7643E 9.14 9.99 9.3
NAL40-7608D 9.18 8.95 ±2.5
NFN40-7636E 6.25 5.98 ±4.3
NFS45-7631 4.79 4.68 ±2.3
NFS25-7608 8.53 8.39 ±1.6
NFS110-7901P 9.00 9.80 8.9
NFS110-7902P 11.59 10.54 9.1
NFS110-7912 12.06 12.03 ±0.2
NFS110-7915 10.58 11.47 8.4
NFS40-7644 8.05 7.10 ±12
Average relative deviation ±9.35
10
5
0
–5
–10
–15
RelativeDeviation(%)
NFN40-7630E
NFS40-7644
NFN40-7632E
NFS40-7608
NFS85-7632
NFN25-7631E
NFS25-7629
NAN25-7610
NAL40-3215
NFS85-7630
NAL40-3245
NFN40-7643E
NAL40-7608D
NFN40-7636E
NFS45-7631
NFS25-7608
NFS110-7901P
NFS110-7902P
NFS110-7912
NFS110-7915
Product Model
Figure 5.
Relative deviation of
cost estimates
Product costing
753
promise of reducing, if not eliminating, these drawbacks. Standard routings
provide a basis for estimating time requirements based on historical data. The
activity hierarchy helps to trace the underlying activities that drive costs and
identify cost-related design features that enable rapid product costing. The
allocation of plant-wide overhead costs to the manufacturing indirect cost pool
facilitates total product cost estimation. The discrimination of TERs and CERs
not only alleviates the difficulty in cost function approximation, but also
simplifies the considerations of volume ranges, distributed manufacturing
plants, and so on.
References
Brismson, J.A. (1986), ``How advanced manufacturing technologies are reshaping cost
management'', Management Accounting, Vol. 67 No. 9, pp. 25-9.
Bush, S.A. and Sheldon, D.F. (1995), ``Whole life costing: a business approach to product design'',
Proceedings of International Conference on Engineering Design, Praha, pp. 987-94.
Ehrlenspiel, K. (1985), Kostenguenstig Konstruieren, Springer Verlag, Berlin.
Fendrock, J.J. (1992), ``Product costing for contract manufacturing'', Circuits Assembly, Vol. 3
No. 9, pp. 40-4.
French, M.J. (1990), ``Function costing: a potential aid to designers'', Journal of Engineering
Design, Vol. 1 No. 1, pp. 47-53.
Fritz, R.D. and Kimbler, D.L. (1996), ``Traditional product cost estimation: problems and
alternative'', Proceedings of the 5th Industrial Engineering Research Conference, Norcross,
GA, pp. 375-80.
Hodson, W.K. (1992), Maynard's Industrial Engineering Handbook, McGraw-Hill, New York, NY.
Hundal, M.S. (1993), ``Design to cost'', in Parsaei, H.R. and Sullvian, W.G. (Eds), Concurrent
Engineering: Contemporary Issues and Modern Design Tools, Chapman and Hall, pp. 330-51.
Hundal, M.S. (1997), ``Product costing: a comparison of conventional and activity-based costing
methods'', Journal of Engineering Design, Vol. 8 No. 1, pp. 91-103.
Innes, J. and Mitchell, F. (1990), ``Activity based costing research'', Management Accounting,
Vol. 68 No. 5, pp. 28-9.
Keys, L.K., Balmer, J.R. and Creswell, R.A. (1987), ``Electronic manufacturing process systems
cost modeling and simulation tools'', IEEE Transactions on Components, Hybrids, and
Manufacturing Technology, Vol. 10 No. 3, pp. 401-10.
Kilgore, J.T. (1997), ``Standard data: developing an effective predetermined time system'', IIE
Solutions, June, pp. 40-2.
Maynard (1997), ``MOST1
for WindowsTM
'', http://www.hbmaynard.com.
Ostwald, P.F. (1992), Engineering Cost Estimating, Prentice-Hall, Englewood Cliffs, NJ.
Ott, H.H. and Hubka, V. (1985), ``Pre-determination of manufacturing costs of welded designs'',
Proceedings of International Conference on Engineering Design, Heurista, Zurich, pp. 478-87.
Pahl, G. and Beitz, W. (1988), Engineering Design: A Systematic Approach, Springer Verlag, London.
Pscyna, H., Hillebrand, A. and Rutz, A. (1982), ``Early cost estimation for casting'', Designers
Lower Manufacturing Costs, VDI Berichte No. 457, VDI Verlag.
Sheldon, D.F., Huang, G.Q. and Perks, R. (1991), ``Design for cost: past experience and recent
development'', Journal of Engineering Design, Vol. 2 No. 2, pp.127-39.
Sheldon, D., Huang, G. and Perks, R. (1993), ``Specification and development of cost-estimating
database for engineering design'', Design for Manufacturability, DE-Vol. 52, ASME, pp. 91-6.
IJOPM
19,7
754
Tseng, M.M. and Jiao, J. (1996), ``Design for mass customization'', CIRP Annals, Vol. 45 No. 1,
pp. 153-6.
Ulrich, K.T. and Fine, C.H. (1990), ``Cost estimation tools to support product design'', Proceedings
of Manufacturing International '90, ASME, Atlanta, GA.
Whitney, D.E. (1987), ``Manufacturing by design: a symbiosis'', IEEE Spectrum, Vol. 24 No. 5,
pp. 47-54.
Appendix: Standard time calculation sheet
Product costing
755

Weitere ähnliche Inhalte

Was ist angesagt?

Measurement and Comparison of Productivity Performance Under Fuzzy Imprecise ...
Measurement and Comparison of Productivity Performance Under Fuzzy Imprecise ...Measurement and Comparison of Productivity Performance Under Fuzzy Imprecise ...
Measurement and Comparison of Productivity Performance Under Fuzzy Imprecise ...Waqas Tariq
 
Location Strategy
Location StrategyLocation Strategy
Location StrategyJoanmaines
 
022 B Construction Croductivity-WRITE SYSTEM
022 B Construction Croductivity-WRITE SYSTEM 022 B Construction Croductivity-WRITE SYSTEM
022 B Construction Croductivity-WRITE SYSTEM Dr Fereidoun Dejahang
 
Cost analysis of project
Cost analysis of projectCost analysis of project
Cost analysis of projectVARSHAAWASAR
 
Production And Operation Materials
Production And Operation MaterialsProduction And Operation Materials
Production And Operation Materialspikuoec
 
Facility+location+decisions
Facility+location+decisionsFacility+location+decisions
Facility+location+decisionsRukunuddin Aslam
 
A Critical Review of the Causes of Cost Overrun in Construction Industries in...
A Critical Review of the Causes of Cost Overrun in Construction Industries in...A Critical Review of the Causes of Cost Overrun in Construction Industries in...
A Critical Review of the Causes of Cost Overrun in Construction Industries in...IRJET Journal
 
International Journal of Mathematics and Statistics Invention (IJMSI)
International Journal of Mathematics and Statistics Invention (IJMSI)International Journal of Mathematics and Statistics Invention (IJMSI)
International Journal of Mathematics and Statistics Invention (IJMSI)inventionjournals
 
Modelling Production Performance of Small Scale Production Plant
Modelling Production Performance of Small Scale Production PlantModelling Production Performance of Small Scale Production Plant
Modelling Production Performance of Small Scale Production PlantIJAEMSJORNAL
 
Facility location & steps on location selection
Facility location & steps on location selectionFacility location & steps on location selection
Facility location & steps on location selectionemmanuelpjoy1992
 

Was ist angesagt? (20)

Labour productivity
Labour productivityLabour productivity
Labour productivity
 
Measurement and Comparison of Productivity Performance Under Fuzzy Imprecise ...
Measurement and Comparison of Productivity Performance Under Fuzzy Imprecise ...Measurement and Comparison of Productivity Performance Under Fuzzy Imprecise ...
Measurement and Comparison of Productivity Performance Under Fuzzy Imprecise ...
 
Location Strategy
Location StrategyLocation Strategy
Location Strategy
 
094 Productivity Measurement
094 Productivity Measurement094 Productivity Measurement
094 Productivity Measurement
 
022 B Construction Croductivity-WRITE SYSTEM
022 B Construction Croductivity-WRITE SYSTEM 022 B Construction Croductivity-WRITE SYSTEM
022 B Construction Croductivity-WRITE SYSTEM
 
Cost managment
Cost managmentCost managment
Cost managment
 
IE
IEIE
IE
 
Cost analysis
Cost analysisCost analysis
Cost analysis
 
Cost analysis of project
Cost analysis of projectCost analysis of project
Cost analysis of project
 
Ie final doc1
Ie final doc1Ie final doc1
Ie final doc1
 
Production And Operation Materials
Production And Operation MaterialsProduction And Operation Materials
Production And Operation Materials
 
Facility location
Facility locationFacility location
Facility location
 
Facility+location+decisions
Facility+location+decisionsFacility+location+decisions
Facility+location+decisions
 
A Critical Review of the Causes of Cost Overrun in Construction Industries in...
A Critical Review of the Causes of Cost Overrun in Construction Industries in...A Critical Review of the Causes of Cost Overrun in Construction Industries in...
A Critical Review of the Causes of Cost Overrun in Construction Industries in...
 
International Journal of Mathematics and Statistics Invention (IJMSI)
International Journal of Mathematics and Statistics Invention (IJMSI)International Journal of Mathematics and Statistics Invention (IJMSI)
International Journal of Mathematics and Statistics Invention (IJMSI)
 
5. productivity
5. productivity5. productivity
5. productivity
 
Modelling Production Performance of Small Scale Production Plant
Modelling Production Performance of Small Scale Production PlantModelling Production Performance of Small Scale Production Plant
Modelling Production Performance of Small Scale Production Plant
 
Facility location & steps on location selection
Facility location & steps on location selectionFacility location & steps on location selection
Facility location & steps on location selection
 
Sewing
SewingSewing
Sewing
 
Standard costing
Standard costingStandard costing
Standard costing
 

Ähnlich wie A Pragmatic Approach to Product Costing Based on Standard Time Estimation

2005 cim castingcostestimation
2005 cim castingcostestimation2005 cim castingcostestimation
2005 cim castingcostestimationvishalwagh40
 
An Activity Based Costing-Based A Case Study Of A Taiwanese Gudeng Precisio...
An Activity Based Costing-Based   A Case Study Of A Taiwanese Gudeng Precisio...An Activity Based Costing-Based   A Case Study Of A Taiwanese Gudeng Precisio...
An Activity Based Costing-Based A Case Study Of A Taiwanese Gudeng Precisio...Kelly Lipiec
 
Cost-Estimation-Techniques unit 2.pptx
Cost-Estimation-Techniques unit 2.pptxCost-Estimation-Techniques unit 2.pptx
Cost-Estimation-Techniques unit 2.pptxSudipBalLama
 
Assessing the perception of contractors on overhead cost allocation using act...
Assessing the perception of contractors on overhead cost allocation using act...Assessing the perception of contractors on overhead cost allocation using act...
Assessing the perception of contractors on overhead cost allocation using act...Nuhu Bamalli Polytechnic Zaria
 
Accounting for Productivity and Spillover Effects in Emerging Energy Technolo...
Accounting for Productivity and Spillover Effects in Emerging Energy Technolo...Accounting for Productivity and Spillover Effects in Emerging Energy Technolo...
Accounting for Productivity and Spillover Effects in Emerging Energy Technolo...Richard Bowers
 
Purchasing functions and mrp in foodservice firms
Purchasing functions and mrp in foodservice firmsPurchasing functions and mrp in foodservice firms
Purchasing functions and mrp in foodservice firmsAlexander Decker
 
Estimation of Manufacturing Costs in the Early Stages of Product Development ...
Estimation of Manufacturing Costs in the Early Stages of Product Development ...Estimation of Manufacturing Costs in the Early Stages of Product Development ...
Estimation of Manufacturing Costs in the Early Stages of Product Development ...IJMER
 
A production - Inventory model with JIT setup cost incorporating inflation an...
A production - Inventory model with JIT setup cost incorporating inflation an...A production - Inventory model with JIT setup cost incorporating inflation an...
A production - Inventory model with JIT setup cost incorporating inflation an...IJMER
 
Financial simulation-combining-cost-information-in-systems-analy
Financial simulation-combining-cost-information-in-systems-analyFinancial simulation-combining-cost-information-in-systems-analy
Financial simulation-combining-cost-information-in-systems-analyjyoti joy
 
A REVIEW ON MATERIAL HANDLING EQUIPMENT
A REVIEW ON MATERIAL HANDLING EQUIPMENTA REVIEW ON MATERIAL HANDLING EQUIPMENT
A REVIEW ON MATERIAL HANDLING EQUIPMENTJoe Andelija
 
Concept of Value Engineering with Case Study
Concept of Value Engineering with Case StudyConcept of Value Engineering with Case Study
Concept of Value Engineering with Case StudyAditya Deshpande
 
Classmate ALearning OutcomesIn Chapters 5 and 6, we have
Classmate ALearning OutcomesIn Chapters 5 and 6, we haveClassmate ALearning OutcomesIn Chapters 5 and 6, we have
Classmate ALearning OutcomesIn Chapters 5 and 6, we haveVinaOconner450
 
Lean manufacturing context_practice_bundles_and_pe
Lean manufacturing context_practice_bundles_and_peLean manufacturing context_practice_bundles_and_pe
Lean manufacturing context_practice_bundles_and_peAngela Castillo
 
AN ECONOMIC PRODUCTION QUANTITY MODEL WITH LEARNING AND FORGETTING CONSIDERAT...
AN ECONOMIC PRODUCTION QUANTITY MODEL WITH LEARNING AND FORGETTING CONSIDERAT...AN ECONOMIC PRODUCTION QUANTITY MODEL WITH LEARNING AND FORGETTING CONSIDERAT...
AN ECONOMIC PRODUCTION QUANTITY MODEL WITH LEARNING AND FORGETTING CONSIDERAT...Tracy Morgan
 
IRJET- Integrated Optimization of Multi-Period Supply Chains and Commonality ...
IRJET- Integrated Optimization of Multi-Period Supply Chains and Commonality ...IRJET- Integrated Optimization of Multi-Period Supply Chains and Commonality ...
IRJET- Integrated Optimization of Multi-Period Supply Chains and Commonality ...IRJET Journal
 
4 Activity-Based Costing and Just-In-Time CostinghoudreiS.docx
4 Activity-Based Costing and Just-In-Time CostinghoudreiS.docx4 Activity-Based Costing and Just-In-Time CostinghoudreiS.docx
4 Activity-Based Costing and Just-In-Time CostinghoudreiS.docxtamicawaysmith
 
Economic analysis of lead time using value stream mapping (vsm) in company o...
Economic analysis of lead time using value stream mapping (vsm) in  company o...Economic analysis of lead time using value stream mapping (vsm) in  company o...
Economic analysis of lead time using value stream mapping (vsm) in company o...Jéssica M. Miloco
 

Ähnlich wie A Pragmatic Approach to Product Costing Based on Standard Time Estimation (20)

2005 cim castingcostestimation
2005 cim castingcostestimation2005 cim castingcostestimation
2005 cim castingcostestimation
 
An Activity Based Costing-Based A Case Study Of A Taiwanese Gudeng Precisio...
An Activity Based Costing-Based   A Case Study Of A Taiwanese Gudeng Precisio...An Activity Based Costing-Based   A Case Study Of A Taiwanese Gudeng Precisio...
An Activity Based Costing-Based A Case Study Of A Taiwanese Gudeng Precisio...
 
Cost-Estimation-Techniques unit 2.pptx
Cost-Estimation-Techniques unit 2.pptxCost-Estimation-Techniques unit 2.pptx
Cost-Estimation-Techniques unit 2.pptx
 
Assessing the perception of contractors on overhead cost allocation using act...
Assessing the perception of contractors on overhead cost allocation using act...Assessing the perception of contractors on overhead cost allocation using act...
Assessing the perception of contractors on overhead cost allocation using act...
 
Accounting for Productivity and Spillover Effects in Emerging Energy Technolo...
Accounting for Productivity and Spillover Effects in Emerging Energy Technolo...Accounting for Productivity and Spillover Effects in Emerging Energy Technolo...
Accounting for Productivity and Spillover Effects in Emerging Energy Technolo...
 
Purchasing functions and mrp in foodservice firms
Purchasing functions and mrp in foodservice firmsPurchasing functions and mrp in foodservice firms
Purchasing functions and mrp in foodservice firms
 
Estimation of Manufacturing Costs in the Early Stages of Product Development ...
Estimation of Manufacturing Costs in the Early Stages of Product Development ...Estimation of Manufacturing Costs in the Early Stages of Product Development ...
Estimation of Manufacturing Costs in the Early Stages of Product Development ...
 
A production - Inventory model with JIT setup cost incorporating inflation an...
A production - Inventory model with JIT setup cost incorporating inflation an...A production - Inventory model with JIT setup cost incorporating inflation an...
A production - Inventory model with JIT setup cost incorporating inflation an...
 
Financial simulation-combining-cost-information-in-systems-analy
Financial simulation-combining-cost-information-in-systems-analyFinancial simulation-combining-cost-information-in-systems-analy
Financial simulation-combining-cost-information-in-systems-analy
 
A REVIEW ON MATERIAL HANDLING EQUIPMENT
A REVIEW ON MATERIAL HANDLING EQUIPMENTA REVIEW ON MATERIAL HANDLING EQUIPMENT
A REVIEW ON MATERIAL HANDLING EQUIPMENT
 
Concept of Value Engineering with Case Study
Concept of Value Engineering with Case StudyConcept of Value Engineering with Case Study
Concept of Value Engineering with Case Study
 
SDM_Task-A_25.07.2013_AKC
SDM_Task-A_25.07.2013_AKCSDM_Task-A_25.07.2013_AKC
SDM_Task-A_25.07.2013_AKC
 
Classmate ALearning OutcomesIn Chapters 5 and 6, we have
Classmate ALearning OutcomesIn Chapters 5 and 6, we haveClassmate ALearning OutcomesIn Chapters 5 and 6, we have
Classmate ALearning OutcomesIn Chapters 5 and 6, we have
 
Lean manufacturing context_practice_bundles_and_pe
Lean manufacturing context_practice_bundles_and_peLean manufacturing context_practice_bundles_and_pe
Lean manufacturing context_practice_bundles_and_pe
 
AN ECONOMIC PRODUCTION QUANTITY MODEL WITH LEARNING AND FORGETTING CONSIDERAT...
AN ECONOMIC PRODUCTION QUANTITY MODEL WITH LEARNING AND FORGETTING CONSIDERAT...AN ECONOMIC PRODUCTION QUANTITY MODEL WITH LEARNING AND FORGETTING CONSIDERAT...
AN ECONOMIC PRODUCTION QUANTITY MODEL WITH LEARNING AND FORGETTING CONSIDERAT...
 
Edit process
Edit processEdit process
Edit process
 
IRJET- Integrated Optimization of Multi-Period Supply Chains and Commonality ...
IRJET- Integrated Optimization of Multi-Period Supply Chains and Commonality ...IRJET- Integrated Optimization of Multi-Period Supply Chains and Commonality ...
IRJET- Integrated Optimization of Multi-Period Supply Chains and Commonality ...
 
Industrial management & data systems
Industrial management & data systemsIndustrial management & data systems
Industrial management & data systems
 
4 Activity-Based Costing and Just-In-Time CostinghoudreiS.docx
4 Activity-Based Costing and Just-In-Time CostinghoudreiS.docx4 Activity-Based Costing and Just-In-Time CostinghoudreiS.docx
4 Activity-Based Costing and Just-In-Time CostinghoudreiS.docx
 
Economic analysis of lead time using value stream mapping (vsm) in company o...
Economic analysis of lead time using value stream mapping (vsm) in  company o...Economic analysis of lead time using value stream mapping (vsm) in  company o...
Economic analysis of lead time using value stream mapping (vsm) in company o...
 

Kürzlich hochgeladen

原版1:1定制南十字星大学毕业证(SCU毕业证)#文凭成绩单#真实留信学历认证永久存档
原版1:1定制南十字星大学毕业证(SCU毕业证)#文凭成绩单#真实留信学历认证永久存档原版1:1定制南十字星大学毕业证(SCU毕业证)#文凭成绩单#真实留信学历认证永久存档
原版1:1定制南十字星大学毕业证(SCU毕业证)#文凭成绩单#真实留信学历认证永久存档208367051
 
Generative AI for Social Good at Open Data Science East 2024
Generative AI for Social Good at Open Data Science East 2024Generative AI for Social Good at Open Data Science East 2024
Generative AI for Social Good at Open Data Science East 2024Colleen Farrelly
 
20240419 - Measurecamp Amsterdam - SAM.pdf
20240419 - Measurecamp Amsterdam - SAM.pdf20240419 - Measurecamp Amsterdam - SAM.pdf
20240419 - Measurecamp Amsterdam - SAM.pdfHuman37
 
办理学位证中佛罗里达大学毕业证,UCF成绩单原版一比一
办理学位证中佛罗里达大学毕业证,UCF成绩单原版一比一办理学位证中佛罗里达大学毕业证,UCF成绩单原版一比一
办理学位证中佛罗里达大学毕业证,UCF成绩单原版一比一F sss
 
modul pembelajaran robotic Workshop _ by Slidesgo.pptx
modul pembelajaran robotic Workshop _ by Slidesgo.pptxmodul pembelajaran robotic Workshop _ by Slidesgo.pptx
modul pembelajaran robotic Workshop _ by Slidesgo.pptxaleedritatuxx
 
RS 9000 Call In girls Dwarka Mor (DELHI)⇛9711147426🔝Delhi
RS 9000 Call In girls Dwarka Mor (DELHI)⇛9711147426🔝DelhiRS 9000 Call In girls Dwarka Mor (DELHI)⇛9711147426🔝Delhi
RS 9000 Call In girls Dwarka Mor (DELHI)⇛9711147426🔝Delhijennyeacort
 
9711147426✨Call In girls Gurgaon Sector 31. SCO 25 escort service
9711147426✨Call In girls Gurgaon Sector 31. SCO 25 escort service9711147426✨Call In girls Gurgaon Sector 31. SCO 25 escort service
9711147426✨Call In girls Gurgaon Sector 31. SCO 25 escort servicejennyeacort
 
Semantic Shed - Squashing and Squeezing.pptx
Semantic Shed - Squashing and Squeezing.pptxSemantic Shed - Squashing and Squeezing.pptx
Semantic Shed - Squashing and Squeezing.pptxMike Bennett
 
Minimizing AI Hallucinations/Confabulations and the Path towards AGI with Exa...
Minimizing AI Hallucinations/Confabulations and the Path towards AGI with Exa...Minimizing AI Hallucinations/Confabulations and the Path towards AGI with Exa...
Minimizing AI Hallucinations/Confabulations and the Path towards AGI with Exa...Thomas Poetter
 
Predictive Analysis for Loan Default Presentation : Data Analysis Project PPT
Predictive Analysis for Loan Default  Presentation : Data Analysis Project PPTPredictive Analysis for Loan Default  Presentation : Data Analysis Project PPT
Predictive Analysis for Loan Default Presentation : Data Analysis Project PPTBoston Institute of Analytics
 
Top 5 Best Data Analytics Courses In Queens
Top 5 Best Data Analytics Courses In QueensTop 5 Best Data Analytics Courses In Queens
Top 5 Best Data Analytics Courses In Queensdataanalyticsqueen03
 
Real-Time AI Streaming - AI Max Princeton
Real-Time AI  Streaming - AI Max PrincetonReal-Time AI  Streaming - AI Max Princeton
Real-Time AI Streaming - AI Max PrincetonTimothy Spann
 
毕业文凭制作#回国入职#diploma#degree澳洲中央昆士兰大学毕业证成绩单pdf电子版制作修改#毕业文凭制作#回国入职#diploma#degree
毕业文凭制作#回国入职#diploma#degree澳洲中央昆士兰大学毕业证成绩单pdf电子版制作修改#毕业文凭制作#回国入职#diploma#degree毕业文凭制作#回国入职#diploma#degree澳洲中央昆士兰大学毕业证成绩单pdf电子版制作修改#毕业文凭制作#回国入职#diploma#degree
毕业文凭制作#回国入职#diploma#degree澳洲中央昆士兰大学毕业证成绩单pdf电子版制作修改#毕业文凭制作#回国入职#diploma#degreeyuu sss
 
DBA Basics: Getting Started with Performance Tuning.pdf
DBA Basics: Getting Started with Performance Tuning.pdfDBA Basics: Getting Started with Performance Tuning.pdf
DBA Basics: Getting Started with Performance Tuning.pdfJohn Sterrett
 
Data Analysis Project : Targeting the Right Customers, Presentation on Bank M...
Data Analysis Project : Targeting the Right Customers, Presentation on Bank M...Data Analysis Project : Targeting the Right Customers, Presentation on Bank M...
Data Analysis Project : Targeting the Right Customers, Presentation on Bank M...Boston Institute of Analytics
 
Biometric Authentication: The Evolution, Applications, Benefits and Challenge...
Biometric Authentication: The Evolution, Applications, Benefits and Challenge...Biometric Authentication: The Evolution, Applications, Benefits and Challenge...
Biometric Authentication: The Evolution, Applications, Benefits and Challenge...GQ Research
 
Identifying Appropriate Test Statistics Involving Population Mean
Identifying Appropriate Test Statistics Involving Population MeanIdentifying Appropriate Test Statistics Involving Population Mean
Identifying Appropriate Test Statistics Involving Population MeanMYRABACSAFRA2
 
Decoding the Heart: Student Presentation on Heart Attack Prediction with Data...
Decoding the Heart: Student Presentation on Heart Attack Prediction with Data...Decoding the Heart: Student Presentation on Heart Attack Prediction with Data...
Decoding the Heart: Student Presentation on Heart Attack Prediction with Data...Boston Institute of Analytics
 
Predicting Salary Using Data Science: A Comprehensive Analysis.pdf
Predicting Salary Using Data Science: A Comprehensive Analysis.pdfPredicting Salary Using Data Science: A Comprehensive Analysis.pdf
Predicting Salary Using Data Science: A Comprehensive Analysis.pdfBoston Institute of Analytics
 

Kürzlich hochgeladen (20)

原版1:1定制南十字星大学毕业证(SCU毕业证)#文凭成绩单#真实留信学历认证永久存档
原版1:1定制南十字星大学毕业证(SCU毕业证)#文凭成绩单#真实留信学历认证永久存档原版1:1定制南十字星大学毕业证(SCU毕业证)#文凭成绩单#真实留信学历认证永久存档
原版1:1定制南十字星大学毕业证(SCU毕业证)#文凭成绩单#真实留信学历认证永久存档
 
Generative AI for Social Good at Open Data Science East 2024
Generative AI for Social Good at Open Data Science East 2024Generative AI for Social Good at Open Data Science East 2024
Generative AI for Social Good at Open Data Science East 2024
 
20240419 - Measurecamp Amsterdam - SAM.pdf
20240419 - Measurecamp Amsterdam - SAM.pdf20240419 - Measurecamp Amsterdam - SAM.pdf
20240419 - Measurecamp Amsterdam - SAM.pdf
 
Deep Generative Learning for All - The Gen AI Hype (Spring 2024)
Deep Generative Learning for All - The Gen AI Hype (Spring 2024)Deep Generative Learning for All - The Gen AI Hype (Spring 2024)
Deep Generative Learning for All - The Gen AI Hype (Spring 2024)
 
办理学位证中佛罗里达大学毕业证,UCF成绩单原版一比一
办理学位证中佛罗里达大学毕业证,UCF成绩单原版一比一办理学位证中佛罗里达大学毕业证,UCF成绩单原版一比一
办理学位证中佛罗里达大学毕业证,UCF成绩单原版一比一
 
modul pembelajaran robotic Workshop _ by Slidesgo.pptx
modul pembelajaran robotic Workshop _ by Slidesgo.pptxmodul pembelajaran robotic Workshop _ by Slidesgo.pptx
modul pembelajaran robotic Workshop _ by Slidesgo.pptx
 
RS 9000 Call In girls Dwarka Mor (DELHI)⇛9711147426🔝Delhi
RS 9000 Call In girls Dwarka Mor (DELHI)⇛9711147426🔝DelhiRS 9000 Call In girls Dwarka Mor (DELHI)⇛9711147426🔝Delhi
RS 9000 Call In girls Dwarka Mor (DELHI)⇛9711147426🔝Delhi
 
9711147426✨Call In girls Gurgaon Sector 31. SCO 25 escort service
9711147426✨Call In girls Gurgaon Sector 31. SCO 25 escort service9711147426✨Call In girls Gurgaon Sector 31. SCO 25 escort service
9711147426✨Call In girls Gurgaon Sector 31. SCO 25 escort service
 
Semantic Shed - Squashing and Squeezing.pptx
Semantic Shed - Squashing and Squeezing.pptxSemantic Shed - Squashing and Squeezing.pptx
Semantic Shed - Squashing and Squeezing.pptx
 
Minimizing AI Hallucinations/Confabulations and the Path towards AGI with Exa...
Minimizing AI Hallucinations/Confabulations and the Path towards AGI with Exa...Minimizing AI Hallucinations/Confabulations and the Path towards AGI with Exa...
Minimizing AI Hallucinations/Confabulations and the Path towards AGI with Exa...
 
Predictive Analysis for Loan Default Presentation : Data Analysis Project PPT
Predictive Analysis for Loan Default  Presentation : Data Analysis Project PPTPredictive Analysis for Loan Default  Presentation : Data Analysis Project PPT
Predictive Analysis for Loan Default Presentation : Data Analysis Project PPT
 
Top 5 Best Data Analytics Courses In Queens
Top 5 Best Data Analytics Courses In QueensTop 5 Best Data Analytics Courses In Queens
Top 5 Best Data Analytics Courses In Queens
 
Real-Time AI Streaming - AI Max Princeton
Real-Time AI  Streaming - AI Max PrincetonReal-Time AI  Streaming - AI Max Princeton
Real-Time AI Streaming - AI Max Princeton
 
毕业文凭制作#回国入职#diploma#degree澳洲中央昆士兰大学毕业证成绩单pdf电子版制作修改#毕业文凭制作#回国入职#diploma#degree
毕业文凭制作#回国入职#diploma#degree澳洲中央昆士兰大学毕业证成绩单pdf电子版制作修改#毕业文凭制作#回国入职#diploma#degree毕业文凭制作#回国入职#diploma#degree澳洲中央昆士兰大学毕业证成绩单pdf电子版制作修改#毕业文凭制作#回国入职#diploma#degree
毕业文凭制作#回国入职#diploma#degree澳洲中央昆士兰大学毕业证成绩单pdf电子版制作修改#毕业文凭制作#回国入职#diploma#degree
 
DBA Basics: Getting Started with Performance Tuning.pdf
DBA Basics: Getting Started with Performance Tuning.pdfDBA Basics: Getting Started with Performance Tuning.pdf
DBA Basics: Getting Started with Performance Tuning.pdf
 
Data Analysis Project : Targeting the Right Customers, Presentation on Bank M...
Data Analysis Project : Targeting the Right Customers, Presentation on Bank M...Data Analysis Project : Targeting the Right Customers, Presentation on Bank M...
Data Analysis Project : Targeting the Right Customers, Presentation on Bank M...
 
Biometric Authentication: The Evolution, Applications, Benefits and Challenge...
Biometric Authentication: The Evolution, Applications, Benefits and Challenge...Biometric Authentication: The Evolution, Applications, Benefits and Challenge...
Biometric Authentication: The Evolution, Applications, Benefits and Challenge...
 
Identifying Appropriate Test Statistics Involving Population Mean
Identifying Appropriate Test Statistics Involving Population MeanIdentifying Appropriate Test Statistics Involving Population Mean
Identifying Appropriate Test Statistics Involving Population Mean
 
Decoding the Heart: Student Presentation on Heart Attack Prediction with Data...
Decoding the Heart: Student Presentation on Heart Attack Prediction with Data...Decoding the Heart: Student Presentation on Heart Attack Prediction with Data...
Decoding the Heart: Student Presentation on Heart Attack Prediction with Data...
 
Predicting Salary Using Data Science: A Comprehensive Analysis.pdf
Predicting Salary Using Data Science: A Comprehensive Analysis.pdfPredicting Salary Using Data Science: A Comprehensive Analysis.pdf
Predicting Salary Using Data Science: A Comprehensive Analysis.pdf
 

A Pragmatic Approach to Product Costing Based on Standard Time Estimation

  • 1. IJOPM 19,7 738 International Journal of Operations & Production Management, Vol. 19 No. 7, 1999, pp. 738-755. # MCB University Press, 0144-3577 A pragmatic approach to product costing based on standard time estimation Jianxin Jiao and Mitchell M. Tseng The Hong Kong University of Science and Technology, Kowloon, Hong Kong Keywords Product costing, Cost estimating, Activity-based costing, Time Abstract Proposes a pragmatic approach to product costing. The approach involves two stages, namely the preparatory stage and the production stage. In the preparatory stage, standard routings are first extracted from existing products. A generic activity hierarchy is established according to the analysis of standard routings, where cost drivers for each activity are identified and summarized by appropriate Cost-related Design Features (CDFs). Then the Maynard Operation Sequence Technique (MOST) is employed to analyze each operation of standard routings to determine the associated standard time. Historical cost data are analyzed to induce the relationships between the CDFs and standard time, namely Time-Estimating Relationships (TERs). By allocating plant-wide overhead costs to standard routings, the unit price of standard time is established to indicate Cost-Estimating Relationships (CERs). A library of material costs is also summarized from existing products. In the production stage, CDFs are first induced from the schematic of a new design. Then a ``dummy process plan'' for this design can be inferred and used to retrieve the associated TERs to determine its time estimate. Once a standard time has been estimated, CERs can be applied to compile the total product cost by adding the estimated material costs. A case study conducted in an electronics enterprise is also reported. 1. Introduction Manufacturing is often viewed as the entire process of delivering an artifact in response to customer needs. Product design plays the central role within this broad view of manufacturing. It is well known that, particularly in discrete goods manufacturing, a predominant percentage (up to 85 percent) of the manufacturing cost of a product is established through decisions made during the product design stage (Whitney, 1987). This implies that the largest impact on product cost can be made in the design process. Therefore, the ability to make design decisions is dependent upon the availability of cost estimates for each alternative during the early development phase (Ostwald, 1992). Such a process of estimating the final cost of a product at the design stage is often referred to as product costing (Sheldon et al., 1991). Product costing supports the entire product realization in two aspects. First, they make designers aware of a product's suitability for production, thus indicating potential cost reduction areas (Keys et al., 1987). Second, production costs are an important The current issue and full text archive of this journal is available at http://www.emerald-library.com This research is partially supported by an electronics company in Hong Kong (CPI 95/96.EG01), the HKUST Research Infrastructure Grant (RI 93/94EG08), and Hong Kong Research Grant Council (HKUST 797/96E). The authors would like to express their sincere appreciation to Dr W.K. Lo and Mr Jonathan H.K. Tsui for their support.
  • 2. Product costing 739 part of the total product cost, hence estimation of these costs helps to determine appropriate sales prices (Ostwald, 1992). Resulting from its paramount importance, product costing has received enormous attention and popularity in industry and academia alike (Sheldon et al., 1991; Ostwald, 1992). Though a number of methods have been proposed and practiced, there is still much to be desired due to the hindrance inherent in the product costing process. Product costing involves quite a few instruments such as the description of the product (the technical system to be made), knowledge about the manufacturing systems and technologies, recognition of the markets regarding raw materials and semi-finished goods, application of cost calculation methods, and so on. The difficulties associated with product costing lie in several aspects including lack of manufacturing knowledge, dependence on detailed design description, no structured mapping between design and production, and contextual heterogeneity. First, cost estimation has traditionally been the province of manufacturing engineering. Typically, the product cost is derived from the summation of various cost components such as materials, machine hours, direct labor, administration, and engineering costs (Ostwald, 1992). However, cost accountants often do not have sufficient knowledge of manufacturing processes and the cost incurred therein (Sheldon et al., 1991). Second, a reliable cost estimation requires detailed knowledge of product design and process plans. Usually, a complete description of the product is not available at the conceptual phase (Hundal, 1993). Third, relationships between design attributes and their cost figures are often not clearly available in the early design stage. It is difficult, if not impossible, to establish accurate cost structures according to the sources from which they arise and approximate cost functions accurately according to actual cost data (Ulrich and Fine, 1990). Lastly, different departments within manufacturing organizations focus on different cost-carrying areas, thus employing different costing methods and using various sets of costing data for different purposes. Cost accountants are always under great pressure to produce a wide variety of cost information for various decision makers and to maintain the coherence of diverse cost structures so that a variety of costing methods can be supported (Sheldon et al., 1993). This is particularly important in the contemporary business environment where there is a growing emphasis on time-based competition as well as a greater degree of customization of products. The emerging paradigm of mass customization emphasizes the coordination among sales, marketing, design, and manufacturing, where cross-functional product costing plays an important role in matching a company's process capabilities with the window of market niches (Tseng and Jiao, 1996). To address the above issues, this paper proposes a pragmatic approach to product costing prior to the actual production run by adopting the ABC (Activity-Based Costing) concept and utilizing historical cost data. To allow the designers to make a good trade-off decision, this approach emphasizes modeling cost information and identifying the product cost during the early design stage where only a schematic design may be available, yet a large
  • 3. IJOPM 19,7 740 proportion of the manufacturing cost is still to be determined. The work reported in the paper is summarized from an industrial project with a local electronics enterprise. Its main products are power supplies that represent typical characteristics of electronic product design and manufacturing. The remainder of the paper proceeds as follows. In the next section, different existing approaches to product costing are summarized. Section 3 presents a Pragmatic Product Costing (PPC) approach along with its systematic framework. A case study of PPC implementation is described in Section 4. Testing results and discussions are also given in Section 4. Finally, conclusions are drawn in Section 5. 2. Literature review Although there is a considerable amount of literature available on product costing, the first comprehensive work was published by Ehrlenspiel (1985). The book provides guidelines and rules for lowering product costs, and methods for estimating these during the design process. A continual emphasis in the book is on the systematic design method (Pahl and Beitz, 1988). They pointed out that while products are influenced at all stages of their life-cycle ± from design order to sales ± the most important factors are the concept, size of the product, and number of parts. Ott and Hubka (1985) described a method for calculating the manufacturing cost of weldments based on weld dimensions. They calculated the time requirements for each welding operation. Ostwald (1992) provided a thorough treatment of cost estimating, including the pertinent topics of operation and product cost estimation. A discussion of practices in manufacturing, construction, as well as chemical, electronic and mechanical industries is given by Sheldon et al. (1991). Various costing methods can be classified in terms of categorization of manufacturing costs, cost structures, and cost models. Total manufacturing costs can be classified in several ways (Ostwald, 1992). For example, they may be divided into material and production costs. They may also be categorized as direct costs and overhead costs. Further, the costs may be divided into variable costs that consist of direct costs and variable overhead costs, and fixed costs that remain constant over a period of time. It is the variable costs that can be influenced most at the design stage (Hundal, 1993). The predominant approach conventionally employed in cost estimation is what is termed the ``burdened'' (Fritz and Kimbler, 1996) or ``volume-based'' (Fendrock, 1992) costing approach. It uses an allocation base such as direct labor dollars, machine hours, or material dollars to assign indirect costs to products. The assumption is based on the unit-level characteristics of the products where the allocation base is directly proportional to product volume (the number of product units) and resources are consumed in proportion to product volume. In many cases, however, high-volume products are over- costed while low-volume products are under-costed. As argued by Fritz and Kimbler (1996), this method can significantly distort product pricing in
  • 4. Product costing 741 operations that encounter fluctuations in production, volume, complexity, size, materials, and setup, where volume-based allocations are not directly proportional to production volume. A cost structure shows the breakdown of the product cost according to one of several criteria such as parts, types of cost, functions, production processes, etc. Sheldon et al. (1991) classify cost structures into four types: organizational breakdown based on departments and units, general breakdown based on elements and features of the products, functional breakdown based on functions of the products, and work breakdown based on activities. Ehrlenspiel (1985) used a magnitude-based costing analysis to categorize products according to particular properties, such as weight and costs. This approach highlights the more important aspects of the design according to the chosen category. Hundal (1993) emphasized the aid of value analysis to increase the value-to-cost ratio of a product. French (1990) advocated function-costing to provide designers with a technique for estimating costs directly from the specification of a product. Activity-based costing adopts the work (activity) breakdown structure to assign indirect costs more accurately and gives greater visibility to manufacturing activities for planning and control (Innes and Mitchell, 1990). Among many costing models in design, the most noteworthy are those based on operations, weight, material, throughput parameters, physical relationships, regression analysis, and similarity laws (Ostwald, 1992). The regression approach tries to find the dependence relationships between costs and product characteristics such as size and materials. The coefficients and exponents are derived through the regression analysis of historical cost data (Pscyna et al., 1982). The group technology based approach is based on the similarity principle. It typically uses a basic cost value while taking into account the effects of variable cost factors such as complexity and size. Linear relationships between the final costs and the variable cost factors are always assumed (Hundal, 1993). In summary, the majority of the literature addressing cost estimating techniques to date focuses primarily on the final production function, i.e. manufacturing. The problem lies in that complete product design information must be available before an estimate can be computed. Current trends towards compression of design to market times have impeded their use as the time required for gathering cost data and performing cost studies is eroded (Bush and Sheldon, 1995). In addition, many cost estimation techniques have been developed for different products based on various cost drivers. The explicit cost drivers, such as material cost, can be obtained directly while the implicit ones, such as design complexity-related costs, have to be derived through analysis of historical cost data. Therefore, the linchpin to product cost estimation is how to use historical cost data to understand the implicit cost drivers. Moreover, in today's manufacturing environment, direct labor costs are decreasing because of the application of advanced manufacturing technologies and management techniques, and costs are shifting from direct to indirect
  • 5. IJOPM 19,7 742 (Brismon, 1986). Accordingly, traditional costing, mainly using direct labor to allocate the indirect (overhead) costs to products, will distort product costing. In view of this deficiency, activity based costing (ABC) divides the overhead costs into several pools and has been recognized as a more rational approach to determining how and why the overhead costs arise (Innes and Mitchell, 1990). The main disadvantage of ABC is the difficulty in obtaining accurate information which would enable the proper allocations (Hundal, 1997), that is, it is difficult to obtain the cost per unit of the activity's output (unit price of a cost driver). It has also been argued that ABC requires detailed activity analysis, which implies significant changes in existing cost accounting systems (Sheldon et al., 1991). 3. A pragmatic product costing approach The standpoint of the PPC approach is to utilize historical costing data. The rationale manifests itself through the fact that most engineering designs involve modifying existing products instead of starting from scratch. Accordingly, patterns of cost estimation in existing products are applicable to a new design. For this type of variant design, where similar work has been done before, there is greater knowledge of costs that can be extrapolated to a new product with a higher degree of confidence. Although in the earlier stages of design the cost estimation can only be approximate, decisions made in its absence can be costly (Hundal, 1997). The PPC approach adopts the ABC concept to identify the underlying activities that drive costs. These activities are then used as building blocks to construct the costs of a given process or work center. However, the hindrance inherent in ABC lies in how to determine the resource consumption in terms of number of cost drivers for each activity and the unit price of each activity with respect to a particular cost driver. Instead of dealing with these trivia, the PPC approach determines resource consumption according to the estimated processing time for each activity timed by the unit price of standard time. This intermediate measurement provides a common, consistent metrology to approximate various cost functions for different activities and cost drivers. The feasibility is embodied by the large amount of effort devoted to standard time estimation from both research and practice, such as work measurement and time study (Hodson, 1992). Table I gives a comparison of ABC and PPC. Instead of reliance on detailed design information and manufacturing knowledge, the PPC approach aims at a rapid cost estimation without developing detailed process plans. Considering that a large majority of products follows a finite set of process routings, the PPC approach first extracts these standard routings generic to all the products according to historical production documents. Every standard routing is associated with a set of design characteristics that can be employed to determine the possible standard routings applied to manufacturing a given product. These characteristics are
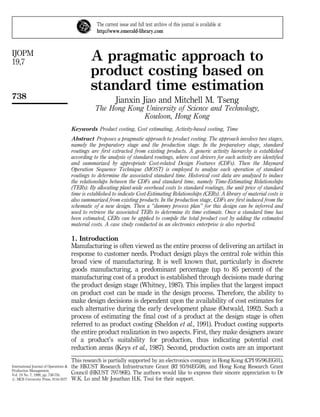
  • 6. Product costing 743 referred to as Cost-related Design Features (CDFs) and are treated as indexes to infer a ``dummy process plan'' for rapid cost estimation in PPC approach. Usually CDFs can be determined from a schematic in an early stage of design. The PPC approach involves two stages, namely the preparatory stage and the production stage (Figure 1). In the preparatory stage, standard routings are first extracted from existing products and depicted by a Process Flow Diagram (PFD). A generic activity hierarchy is established according to the analysis of standard routings, where cost drivers for each activity are identified and summarized by appropriate CDFs. Then the Maynard Operation Sequence Technique (MOST) is employed to analyze each operation of standard routings to determine the associated standard time. Historical cost data are analyzed to induce the relationships between the CDFs and standard time, namely Time- Estimating Relationships (TERs). By allocating plant-wide overhead costs to standard routings, the unit price of standard time is established to indicate Cost- Estimating Relationships (CERs). A library of material costs is also summarized from existing products. In the production stage, CDFs are first induced from the schematic of a new design. Then a ``dummy process plan'' for this design can be inferred and used to retrieve the associated TERs to determine its time estimate. Once standard time has been estimated, CERs can be applied to compile the total product cost by adding the estimated material costs. Table I. A comparison of ABC with PPC Typical activity-based costing (ABC) Operation A Cost drivers (CDs) Consumption (# of CDs) Unit price of cost drivers ($ per CD) Calculated costs for each activity Activity A1 CDA1 XA1 CIA1 CA1 ˆ …XA1†Ã C1A1 Activity A2 CDA2 XA2 CIA2 CA2 ˆ …Xà A2CIA2 Activity A3 CD1 A3 XA3 CI1 A3 C1 A3 ˆ …X1 A3†Ã CI1 A3 CD2 A3 X2 A3 CI2 A3 C2 A3†Ã CI2 A3 Ai CDAi XAi CIAi CAi ˆ …XAi†Ã CIAi Estimated cost of operation A € …CAi Pragmatic product costing (PPC) Operation A Cost-related design features Consumption (# of CDFs) Time-estimating relationships (TERs) (sec per activity) Cost-estimating relationships (CERs) ($ per hour) Activity 1 CDFA1 XA1 StdTA1 ˆ Kà A1XA1 y Activity A2 CDFA2 XA2 StdTA2 ˆ Kà A2XA2 Activity A3 CDF1 A3 X2 A3 StdTA3 ˆ K1 A3 à XA3 CDF2 A3 X2 A3 ‡K2 A3 à X2 A3 Ai CDFAi XAi SdtTAi ˆ € …KAij† Total estimated time of operation A SdtT ˆ € …StdTAi† Total estimated cost of operation A …StdTa60†Ã v
  • 7. IJOPM 19,7 744 3.1 Standard routing development The development of standard routings depends on both the knowledge of domain experts and the product history. An effective approach is first to analyze the product database for standard routings and then to use expert opinion on process plans and cost estimation to consolidate the results. A PreparatoryStageProductionStage PreparatoryPool Product Specifications Material CostLibrary PartType PartNumber PartPrice StandardRoutingIdentification Processflow Diagram(PFD) Activity Hierarchy CostDrivers (CDs) Cost-relatedDesign Features(CDFs) StandardTimeEstablishment Work Measurement (MOST) Time-Estimating Relationships(TERs) Over-Estimating Relationships(CERs) Plant-wideOverheadCostsAllocation NewProduct DesignSchematic Component List InferredRouting PFD CDFs Material Costs StandardTime Estimation TotalProductCostCompilation Figure 1. Two-stage methodology of PPC
  • 8. Product costing 745 Process Flow Diagram (PFD) is suggested to describe standard routings in a formal way. Figure 2 gives an example of such a PFD for the PCB assembly of encapsulated AC/DC converters. 3.2 Activity hierarchy formulation and CDF identification To establish the cost structure of ABC, each operation in a standard routing is treated as a cost center and analyzed to determine the activities that fulfill this operation. All activities associated with each cost center can be organized by an activity hierarchy. An activity hierarchy adopts a combined decomposition (``a_part_of'' link) and classification (``a_kind_of'' link) tree to represent various inter-relationships among activities. Figure 3 shows the activity hierarchy for the operation of a heat sink sub-assembly. The ramifications of an activity hierarchy depend on the identification of cost drivers for each activity. In the PPC approach, cost drivers associated with specific activities are identified according to whether the consumption of an activity can be appropriately expressed in terms of design features instead of adopting the process characteristics as most ABC efforts have practiced. In such a way, a set of Cost-related Design Features (CDFs) performs as the cost drivers to comprise a ``dummy process plan'' and to indicate the consumption of activities. Figure 3 illustrates the breakdown of an activity hierarchy in parallel to the identification of appropriate CDFs. 3.3 Standard time establishment and TER approximation The importance of establishing time standards for improving labor efficiency and organizational performance has been well recognized (Kilgore, 1997). In practice, most companies have laid the groundwork for predetermined time standards such as Motion Time Analysis (MTA), Work-Factor (WF), Basic Motion Time Study (BMT), and Methods of Time Measurement (MTM) (Hodson, 1992). The PPC approach aims at taking the advantages of standard data to alleviate difficulties in ABC implementation. A popular technique for work measurement, namely, the Maynard Operation Sequence Technique (MOST1 ) is adopted as the core in PPC to synthesize the standard time data associated with standard routings. MOST1 for WindowsTM (Maynard, 1997) is a Windows-based work measurement tool that enables analysts to create and maintain a database of work elements. The software automatically produces the time for each method step and sub- operation based on the keyword method description entered by analysts. Final time standards are developed by further considering the technological and managerial allowances, as shown in Figure 4. All standard time estimates obtained from MOST1 are validated according to the actual data of existing products. Accordingly, the Time-Estimating Relationships (TERs) for individual activities are induced in terms of the cost drivers (i.e. CDFs) associated with specific activities. Figure 3 illustrates how the TERs are derived. The derivation of TERs is based on the regression analysis that provides the formula for calculating the time for various elements
  • 9. IJOPM 19,7 746 MagbeticAssembly AutoInsertion Material Issue PinStakingMaterial Issue Sub-Assembly Material Issue ComponentPreparation MaterialIssue Stuffing Wave Soldering QC(Stuffing) (Sampling) QC(Slodering) (Sampling) Flux Cleaning Touch Up Lead Timing (Optional) Top Wire A Hipot& FunctionalTest Can Assembly A WorkmanshipRepair QC(Workmanship) CanIsolation Test(ForMetalCan) Potting& Curing Spray Painting &Curing Cover Resistance Soldering (Optional) Hipot& FunctionalTest Apply Product Label &DateCode Minor WorkmanshipRepair Burn-in Minor WorkmanshipRepair PackingQA FinalQC Minor Workmanship Deviation Store 100%Screening Repair CrossOutSafetyMarking QC(Visual B/IFailure) Key Input Operation Inspection Test Output Connection Flowdirection(compulsory) Flowdirection(operational) Figure 2. Process flow diagram (PFD) for the PCB assembly of ecapsulated AC/DC converters
  • 10. Product costing 747 Work Centers (Operations inStandard Routings) Activity Hierachy (Cost Allocation Pool) Cost- related Design Features (CDFs) Time Estimating Relation- ships (TERs) HeatSink(H/S) Sub-Assembly H/SSub-AssemblyPanelAssembly 1H/S+TransistorsH/S+Diode (BySpringClip)3H/S+4Diode1H/S+1Diode (Bydipsoldering) (ByScrewMounting)1H/S+NDiode (Byhandsoldering) Mountfuse socketbynut &insertfuse MountSocketManualsolder wiretosocket/ fuse/tab MountSocket byelect. screwdriver Plugwire intosocket MountSocket byplug-in Plugcrimp wiretoPCB M:ofH/S N:Totalof XSTR –//–N:ofH/S assembly –//–N:ofH/S assembly –//– –//– M:ofH/S N:Totalof XSTR –//– –//– M:ofH/S N:Totalof diodes –//– –//– N:offuse–//– M:Frequencyof PCBhandling N:ScrewQTY M:Frequencyof PCBhandling N:ofwires M:Frequencyof PCBhandling N:Numberof solderedjoints M:Frequencyof PCBhandling N:ofsocket –//– M:Frequencyof PCBhandling N:ofcrimpedends–//– 15.84M+23.04N 15.84M+32.40N19.80M+9.00N10.08M+6.84N10.08M+6.84N 10.08M+10.08N4.50M+3.24N10.08M+28.44N27.79N123.12N 75.96N A_kind_oflink A_part_oflink Key –//– Figure 3. An example of costing structure design in PPC
  • 11. IJOPM 19,7 748 contained in the study. The formula is as follows: StdTi ˆ Ki1 Ã CDFi1‡ Ki2 Ã CDFi2 ‡ XXX ‡ Bi, where StdTi is the time estimate for activity i, CDFij is the j-th cost driver associated with activity i, Kij is the coefficient of StdTi with respect to the CDFij, and Bi is the intercept. The determination of coefficients is based on the method of least squares, which basically tries to find the line where the sum of the squares of the deviation of each data point from the line is a minimum. Usually, a statistical package, such as Statistica or SAS, can be adopted to simplify this approximation process. More dedicated parametric estimation equations can also be derived by using statistical analysis methods, e.g. StdTi ˆ A Ã …CDFi†B , where A and B are empirically derived constants. 3.4 Overhead cost allocation and CER development The derivation of Cost-Estimating Relationships (CERs) is based on the allocation of overhead costs at different levels of a company. A good starting point is to use historical cost data along with the collective knowledge of experts from different divisions. The middle portion of Table II depicts a typical cost computation sheet for various cost centers of standard routings, i.e., the indirect cost pool. The right-hand column of Table II calculates the overhead costs at the plant level, such as selling, general and administration (SG&A), that are different from those of cost centers. Table II illustrates how plant-wide overhead costs are translated into the manufacturing cost pool via Basic Works Measurement Assembly & Testing QC Testing/Inspection Packing & Repairing “MOST” Basic Time for Work Content Technical Allowances Relaxation Allowance Contingence Allowance Special Allowance Effciency Factor Operator Efficiency Allowed (Target) Allowed Basic Time for Work Content Labor (NPDL) Allowance Technical Holding Start-up Time Service Holding etc. Supervision & Clerical Material Holding Training Allowed Basic Time for Work Content Non-Productive Direct Total Standard Time Allowed for Operator Standard Labor Cost Total Standard Time X Standard Labor Rate Figure 4. Standard time establishment
  • 12. Product costing 749 standard time estimation. In such a way, the overhead costs at different levels ranging from unit level, batch level, product level to plant wide, can be allocated to product activities that actually consume them. The employment of TERs enables the PPC approach to estimate the total product cost, not only the manufacturing cost. In traditional ABC practice, plant-wide activities have to be analyzed in terms of their cost drivers, the unit price of each activity, consumption of each cost driver, and so on. These efforts are deemed to be overwhelming, if not impossible. Motivated by current global manufacturing trends, most companies are establishing geographically distributed plants to take advantage of different manufacturing sites. In the company under our study, there are two plants, located in Hong Kong and Zhong Shan, respectively. This distributed manufacturing raises more difficulty in allocating overhead costs. The activities, associated with logistics, different plant settings, etc., are very difficult to analyze by following traditional ABC procedures. In the PPC approach, however, TERs play an important role in unifying various activities with respect to different cost drivers. Therefore, dealing with distributed plants Table II. Overhead cost allocation and CER derivation Period (96.6-96.12) Indirect cost pool Plant-wide overhead costs Indirect cost Work centers in std routings Selling, general and administration Account category Soldering Testing ... Planning Shipping ... Salaries and wages Indirect labor a1 b1 ... p1 s1 ... Premium a2 b2 ... p2 s2 ... Vacations a3 b3 ... p3 s3 ... Personnel expenses Travel b4 ... p4 s4 ... Training a4 b5 ... p5 s5 ... Recruiting b6 ... p6 s6 ... Relocation b7 ... p7 s7 ... Supplies/services Stationery b8 ... p8 s8 ... General operating a5 b9 ... p9 s9 ... Maintenance a6 ... p10 s10 ... Utilities a7 b10 ... p11 s11 ... Fixed charges Depreciation Equipment a8 b12 ... p12 ... Property a9 b13 ... p13 ... Equipment rental b14 ... ... Property taxes ... p14 ... Advertising ... p15 ... ...... ... ... ... ... ... ... Sub-total $a $b ... $p $s ... WCs ˆ a ‡ bXXX PW ˆ p ‡ s ‡ XXX Total indirect costs TIC ˆ WCs ‡ PW Total standard time StdT ˆ StdTProduct 1 ‡ StdTProduct 2 ‡ StdTProduct 3 ‡ XXX Cost per std time TICaStdT ($/hour)
  • 13. IJOPM 19,7 750 can be simply reflected by inducing the proportion of standard labor hours for each plant, as illustrated in Tables III and IV. Table III summarizes the CERs of our case study. In addition to facilitating the handling of distributed plants, the development of CERs possesses an advantage in considering various volume ranges which are emerging nowadays as one of the important characteristics of mass customization manufacturing. 3.5 Total product cost compilation The product costing worksheet in Table IV illustrates the procedure of total product cost compilation in the PPC approach. There are three parts of costing, i.e. material costing, direct labor costing, and indirect cost estimation. Material cost is determined by referring to the price library and the component list. Types and quantities of various components can be derived from a design schematic. The price library consists of historical information from suppliers and is established during the preparatory stage. Once the total standard time has been estimated according to CDFs and TERs, the direct labor cost and overhead cost can be derived using appropriate CERs. The equation of total cost compilation is described in Table IV. 4. Implementation and testing results By following the above procedures, the PPC approach has been implemented in the company under our study. Figure 2 shows the PFD for the PCB assembly of AC/DC converters. Figure 3 illustrates how the costing structure of PPC is developed. Figure 4 shows the considerations given to the establishment of standard time. Table III summarizes CERs for different volume ranges and plants. The Appendix gives an example of standard time calculation sheet. A worksheet of total product cost compilation is given in Table IV. Table III. CERs for the company Material overhead rate: MOH = 12.7 % (per standard unburden material cost) HK Labor rate: LR1 = 4.750 (per unit std labor in HK plant) ZS Labor rate: LR2 = 0.830 (per unit std labor hour in ZS plant) Indirect labor rate ($ per standard hour) Volume range (VR) HK (LOH1) ZS (LOH2) Mixed (LOH3) 1-1K 7.250 2.850 4.550 1K-10K 3.300 1.550 2.900 10K-20K 2.250 1.250 1.600 20K-50K 1.700 0.900 1.200 50K-100K 1.510 0.600 1.000 100K-200K 1.313 0.550 0.900 200K-300K 1.120 0.450 0.700 300K-400K 1.100 0.300 0.650 Over 400K 1 0.192 0.580
  • 14. Product costing 751 To test the potential of the PPC approach, 20 products have been selected as testing samples. The actual cost, estimated cost, and relative deviation for each sample product are shown in Table V. The relative deviation of cost estimation is calculated as: RD ˆ C…E† À C…A† C…A†  1007 where C…A† and C…E† denote the actual costs and the estimated costs, respectively. The average relative deviation of cost estimates is about 10 per cent. From Table V and Figure 5, it can be observed that the relative cost deviations of 19 samples (or 95 per cent of the total samples) are within ‹10 per cent. Cost estimation on 12 samples (or 60 per cent of the total samples) is even within the relative deviation of ‹5 per cent. The maximum cost relative deviation from the actual cost is about 12 per cent, which is still considered acceptable by the company. 5. Conclusions The major drawbacks of traditional approaches to product costing include lack of manufacturing knowledge, reliance on the detailed design description, poor cost function approximation, and inability to update estimation algorithms by using actual cost data. A pragmatic approach has been proposed by adopting the ABC concept and based on estimated processing time, which shows Table IV. Product costing worksheet Material costing ALP45-7608 Component list fCPiY i ˆ 2Y 2Y F F F Y mg where m = total types of components Schematic Direct material cost ($): CM ˆ € …CPià UPi† where UPi = unit price of CPi 14.106 Material overhead rate (%): MOH 12.7% Burdened material cost ($):CCM ˆ Cà M …1 ‡ MOH† 15.8975 Standard time estimation Activity hierarchy and TERs CDFs Total stand time (hour): StdT 0.5137 Direct labor costing HK standard hour percent (%) 100% ZS standard hour percent (%): 1 À 0 HK standard labor rate ($/hour): LR1à 4.750 ZS standard labor rate ($/hour): LR2 0.830 Direct labor cost ± HK ($): CDL1 ˆ StdTà à LR1 2.4401 Direct labor cost ± ZS ($): CDL2 ˆ StdTà …1 À †Ã LR2 0.000 Total direct labor cost ($): CCDL ˆ CDL1 ‡ CDL2 2.4401 Indirect cost estimation Volume range: VR 120K Burdened labor rate ± HK ($/hour): LOH1 1.313 Burdened labor rate ± ZS ($/hour): LOH2 0.550 Burdened labor rate ± HK/ZS ($/hour): LOH3 0.900 Total overhead cost ($): CCOH ˆ StdTà à LOH1 1.1368 ‡StdTà …1 À †Ã LOH2 ‡ StdTà LOH3 Total product costs ($) CP ˆ CCM ‡ CCDL ‡ CCOH 19.4744
  • 15. IJOPM 19,7 752 Table V. Testing results Product model C…A† ($) C…E† ($) RD (%) NFN40-7630E 14.71 13.72 ±6.7 NFN40-7632E 10.94 11.15 1.9 NFS40-7608 9.97 1.066 6.9 NFS85-7632 11.46 11.42 ±0.3 NFN25-7631E 8.43 8.84 4.9 NFS25-7629 24.01 24.22 0.9 NAN25-7610 7.69 7.73 0.5 NAL40-3215 6.16 6.37 3.4 NFS85-7630 7.45 7.37 ±1.1 NAL40-3245 6.50 6.07 ±6.6 NFN40-7643E 9.14 9.99 9.3 NAL40-7608D 9.18 8.95 ±2.5 NFN40-7636E 6.25 5.98 ±4.3 NFS45-7631 4.79 4.68 ±2.3 NFS25-7608 8.53 8.39 ±1.6 NFS110-7901P 9.00 9.80 8.9 NFS110-7902P 11.59 10.54 9.1 NFS110-7912 12.06 12.03 ±0.2 NFS110-7915 10.58 11.47 8.4 NFS40-7644 8.05 7.10 ±12 Average relative deviation ±9.35 10 5 0 –5 –10 –15 RelativeDeviation(%) NFN40-7630E NFS40-7644 NFN40-7632E NFS40-7608 NFS85-7632 NFN25-7631E NFS25-7629 NAN25-7610 NAL40-3215 NFS85-7630 NAL40-3245 NFN40-7643E NAL40-7608D NFN40-7636E NFS45-7631 NFS25-7608 NFS110-7901P NFS110-7902P NFS110-7912 NFS110-7915 Product Model Figure 5. Relative deviation of cost estimates
  • 16. Product costing 753 promise of reducing, if not eliminating, these drawbacks. Standard routings provide a basis for estimating time requirements based on historical data. The activity hierarchy helps to trace the underlying activities that drive costs and identify cost-related design features that enable rapid product costing. The allocation of plant-wide overhead costs to the manufacturing indirect cost pool facilitates total product cost estimation. The discrimination of TERs and CERs not only alleviates the difficulty in cost function approximation, but also simplifies the considerations of volume ranges, distributed manufacturing plants, and so on. References Brismson, J.A. (1986), ``How advanced manufacturing technologies are reshaping cost management'', Management Accounting, Vol. 67 No. 9, pp. 25-9. Bush, S.A. and Sheldon, D.F. (1995), ``Whole life costing: a business approach to product design'', Proceedings of International Conference on Engineering Design, Praha, pp. 987-94. Ehrlenspiel, K. (1985), Kostenguenstig Konstruieren, Springer Verlag, Berlin. Fendrock, J.J. (1992), ``Product costing for contract manufacturing'', Circuits Assembly, Vol. 3 No. 9, pp. 40-4. French, M.J. (1990), ``Function costing: a potential aid to designers'', Journal of Engineering Design, Vol. 1 No. 1, pp. 47-53. Fritz, R.D. and Kimbler, D.L. (1996), ``Traditional product cost estimation: problems and alternative'', Proceedings of the 5th Industrial Engineering Research Conference, Norcross, GA, pp. 375-80. Hodson, W.K. (1992), Maynard's Industrial Engineering Handbook, McGraw-Hill, New York, NY. Hundal, M.S. (1993), ``Design to cost'', in Parsaei, H.R. and Sullvian, W.G. (Eds), Concurrent Engineering: Contemporary Issues and Modern Design Tools, Chapman and Hall, pp. 330-51. Hundal, M.S. (1997), ``Product costing: a comparison of conventional and activity-based costing methods'', Journal of Engineering Design, Vol. 8 No. 1, pp. 91-103. Innes, J. and Mitchell, F. (1990), ``Activity based costing research'', Management Accounting, Vol. 68 No. 5, pp. 28-9. Keys, L.K., Balmer, J.R. and Creswell, R.A. (1987), ``Electronic manufacturing process systems cost modeling and simulation tools'', IEEE Transactions on Components, Hybrids, and Manufacturing Technology, Vol. 10 No. 3, pp. 401-10. Kilgore, J.T. (1997), ``Standard data: developing an effective predetermined time system'', IIE Solutions, June, pp. 40-2. Maynard (1997), ``MOST1 for WindowsTM '', http://www.hbmaynard.com. Ostwald, P.F. (1992), Engineering Cost Estimating, Prentice-Hall, Englewood Cliffs, NJ. Ott, H.H. and Hubka, V. (1985), ``Pre-determination of manufacturing costs of welded designs'', Proceedings of International Conference on Engineering Design, Heurista, Zurich, pp. 478-87. Pahl, G. and Beitz, W. (1988), Engineering Design: A Systematic Approach, Springer Verlag, London. Pscyna, H., Hillebrand, A. and Rutz, A. (1982), ``Early cost estimation for casting'', Designers Lower Manufacturing Costs, VDI Berichte No. 457, VDI Verlag. Sheldon, D.F., Huang, G.Q. and Perks, R. (1991), ``Design for cost: past experience and recent development'', Journal of Engineering Design, Vol. 2 No. 2, pp.127-39. Sheldon, D., Huang, G. and Perks, R. (1993), ``Specification and development of cost-estimating database for engineering design'', Design for Manufacturability, DE-Vol. 52, ASME, pp. 91-6.
  • 17. IJOPM 19,7 754 Tseng, M.M. and Jiao, J. (1996), ``Design for mass customization'', CIRP Annals, Vol. 45 No. 1, pp. 153-6. Ulrich, K.T. and Fine, C.H. (1990), ``Cost estimation tools to support product design'', Proceedings of Manufacturing International '90, ASME, Atlanta, GA. Whitney, D.E. (1987), ``Manufacturing by design: a symbiosis'', IEEE Spectrum, Vol. 24 No. 5, pp. 47-54. Appendix: Standard time calculation sheet