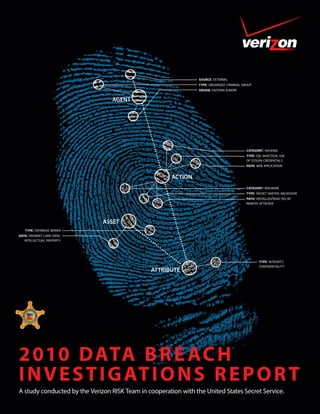
SlideShare a Scribd company logo
1 of 66
Download to read offline
source: external
                                                                 type: organized criminal group
                                                                 origin: eastern europe


                                 AGENT


                                                                                            category: hacking
                                                                                            type: sql injection; use
                                                                                            of stolen credentials
                                                                                            path: web application


                                                       ACTION
                                                                                            category: malware
                                                                                            type: packet sniffer; backdoor
                                                                                            path: installed/injected by
                                                                                            remote attacker


                              ASSET
   type: database server
data: payment card data;
   intellectual property


                                                                                                   type: integrity;
                                                                                                   confidentiality
                                               ATTRIBUTE


2 010 DATA B R E AC H
I N V E S T I G AT I O N S R E P O R T
A study conducted by the Verizon RISK Team in cooperation with the United States Secret Service.
2010 Data Breach Investigations Report
AUTHORS:                       TABLE OF CONTENTS
Wade Baker                     Executive Summary  .  .  .  .  .  .  .  .  .  .  .  .  .  .  .  .  .  .  .  .  .  .  .  .  .  .  .  .  .  .  .  .  .  .  .  .  .  .  .  .  .  .  .  .  .  .  .  .  .  .  .  .  .  .  .  .  .  .  .  .  .  .  . 2
Mark Goudie                    Methodology  .  .  .  .  .  .  .  .  .  .  .  .  .  .  .  .  .  .  .  .  .  .  .  .  .  .  .  .  .  .  .  .  .  .  .  .  .  .  .  .  .  .  .  .  .  .  .  .  .  .  .  .  .  .  .  .  .  .  .  .  .  .  .  .  .  .  .  .  . 4
Alexander Hutton                      Verizon Data Collection Methodology  .  .  .  .  .  .  .  .  .  .  .  .  .  .  .  .  .  .  .  .  .  .  .  .  .  .  .  .  .  .  .  .  .  .  .  .  .  .  .  .  .  .  . 4
C. David Hylender                     USSS Data Collection Methodology  .  .  .  .  .  .  .  .  .  .  .  .  .  .  .  .  .  .  .  .  .  .  .  .  .  .  .  .  .  .  .  .  .  .  .  .  .  .  .  .  .  .  .  .  . 5
Jelle Niemantsverdriet         Cybercrime Year in Review, 2009  .  .  .  .  .  .  .  .  .  .  .  .  .  .  .  .  .  .  .  .  .  .  .  .  .  .  .  .  .  .  .  .  .  .  .  .  .  .  .  .  .  .  .  .  .  .  .  .  .  .  . 6
Christopher Novak              Results and Analysis  .  .  .  .  .  .  .  .  .  .  .  .  .  .  .  .  .  .  .  .  .  .  .  .  .  .  .  .  .  .  .  .  .  .  .  .  .  .  .  .  .  .  .  .  .  .  .  .  .  .  .  .  .  .  .  .  .  .  .  .  .  .  . 7
David Ostertag                        Demographics  .  .  .  .  .  .  .  .  .  .  .  .  .  .  .  .  .  .  .  .  .  .  .  .  .  .  .  .  .  .  .  .  .  .  .  .  .  .  .  .  .  .  .  .  .  .  .  .  .  .  .  .  .  .  .  .  .  .  .  .  .  .  .  .  . 8
Christopher Porter                    Threat Agents  .  .  .  .  .  .  .  .  .  .  .  .  .  .  .  .  .  .  .  .  .  .  .  .  .  .  .  .  .  .  .  .  .  .  .  .  .  .  .  .  .  .  .  .  .  .  .  .  .  .  .  .  .  .  .  .  .  .  .  .  .  .  .  .  . 11
Mike Rosen                                         Breach Size by Threat Agents  .  .  .  .  .  .  .  .  .  .  .  .  .  .  .  .  .  .  .  .  .  .  .  .  .  .  .  .  .  .  .  .  .  .  .  .  .  .  .  .  .  .  .  .  .  . 14
Bryan Sartin                                       External Agents .  .  .  .  .  .  .  .  .  .  .  .  .  .  .  .  .  .  .  .  .  .  .  .  .  .  .  .  .  .  .  .  .  .  .  .  .  .  .  .  .  .  .  .  .  .  .  .  .  .  .  .  .  .  .  .  .  .  . 15
Peter Tippett, M.D., Ph.D                          Internal Agents  .  .  .  .  .  .  .  .  .  .  .  .  .  .  .  .  .  .  .  .  .  .  .  .  .  .  .  .  .  .  .  .  .  .  .  .  .  .  .  .  .  .  .  .  .  .  .  .  .  .  .  .  .  .  .  .  .  .  . 17
Men and women of the                               Partner Agents  .  .  .  .  .  .  .  .  .  .  .  .  .  .  .  .  .  .  .  .  .  .  .  .  .  .  .  .  .  .  .  .  .  .  .  .  .  .  .  .  .  .  .  .  .  .  .  .  .  .  .  .  .  .  .  .  .  .  . 19
United States Secret Service          Threat Actions .  .  .  .  .  .  .  .  .  .  .  .  .  .  .  .  .  .  .  .  .  .  .  .  .  .  .  .  .  .  .  .  .  .  .  .  .  .  .  .  .  .  .  .  .  .  .  .  .  .  .  .  .  .  .  .  .  .  .  .  .  .  .  .  . 20
                                                   Malware  .  .  .  .  .  .  .  .  .  .  .  .  .  .  .  .  .  .  .  .  .  .  .  .  .  .  .  .  .  .  .  .  .  .  .  .  .  .  .  .  .  .  .  .  .  .  .  .  .  .  .  .  .  .  .  .  .  .  .  .  .  .  .  .  . 22
CONTRIBUTORS:                                      Hacking  .  .  .  .  .  .  .  .  .  .  .  .  .  .  .  .  .  .  .  .  .  .  .  .  .  .  .  .  .  .  .  .  .  .  .  .  .  .  .  .  .  .  .  .  .  .  .  .  .  .  .  .  .  .  .  .  .  .  .  .  .  .  .  .  .  . 27
                                                   Social  .  .  .  .  .  .  .  .  .  .  .  .  .  .  .  .  .  .  .  .  .  .  .  .  .  .  .  .  .  .  .  .  .  .  .  .  .  .  .  .  .  .  .  .  .  .  .  .  .  .  .  .  .  .  .  .  .  .  .  .  .  .  .  .  .  .  .  . 31
Thijs Bosschert
                                                   Misuse  .  .  .  .  .  .  .  .  .  .  .  .  .  .  .  .  .  .  .  .  .  .  .  .  .  .  .  .  .  .  .  .  .  .  .  .  .  .  .  .  .  .  .  .  .  .  .  .  .  .  .  .  .  .  .  .  .  .  .  .  .  .  .  .  .  .  . 33
Eric Brohm
                                                   Physical  .  .  .  .  .  .  .  .  .  .  .  .  .  .  .  .  .  .  .  .  .  .  .  .  .  .  .  .  .  .  .  .  .  .  .  .  .  .  .  .  .  .  .  .  .  .  .  .  .  .  .  .  .  .  .  .  .  .  .  .  .  .  .  .  .  . 35
Calvin Chang
                                                   Error  .  .  .  .  .  .  .  .  .  .  .  .  .  .  .  .  .  .  .  .  .  .  .  .  .  .  .  .  .  .  .  .  .  .  .  .  .  .  .  .  .  .  .  .  .  .  .  .  .  .  .  .  .  .  .  .  .  .  .  .  .  .  .  .  .  .  .  .  . 36
Michael Dahn
                                                   Environmental .  .  .  .  .  .  .  .  .  .  .  .  .  .  .  .  .  .  .  .  .  .  .  .  .  .  .  .  .  .  .  .  .  .  .  .  .  .  .  .  .  .  .  .  .  .  .  .  .  .  .  .  .  .  .  .  .  .  .  . 37
Ron Dormido
                                      Compromised Assets  .  .  .  .  .  .  .  .  .  .  .  .  .  .  .  .  .  .  .  .  .  .  .  .  .  .  .  .  .  .  .  .  .  .  .  .  .  .  .  .  .  .  .  .  .  .  .  .  .  .  .  .  .  .  .  .  .  . 37
Ben van Erck
                                      Compromised Data .  .  .  .  .  .  .  .  .  .  .  .  .  .  .  .  .  .  .  .  .  .  .  .  .  .  .  .  .  .  .  .  .  .  .  .  .  .  .  .  .  .  .  .  .  .  .  .  .  .  .  .  .  .  .  .  .  .  .  . 39
Kylee Evans
                                      Attack Difficulty  .  .  .  .  .  .  .  .  .  .  .  .  .  .  .  .  .  .  .  .  .  .  .  .  .  .  .  .  .  .  .  .  .  .  .  .  .  .  .  .  .  .  .  .  .  .  .  .  .  .  .  .  .  .  .  .  .  .  .  .  .  .  . 42
Eric Gentry
                                      Attack Targeting  .  .  .  .  .  .  .  .  .  .  .  .  .  .  .  .  .  .  .  .  .  .  .  .  .  .  .  .  .  .  .  .  .  .  .  .  .  .  .  .  .  .  .  .  .  .  .  .  .  .  .  .  .  .  .  .  .  .  .  .  .  .  . 43
John Grim
                                      Unknown Unknowns  .  .  .  .  .  .  .  .  .  .  .  .  .  .  .  .  .  .  .  .  .  .  .  .  .  .  .  .  .  .  .  .  .  .  .  .  .  .  .  .  .  .  .  .  .  .  .  .  .  .  .  .  .  .  .  .  .  . 44
Clarence Hill
                                      Timespan of Breach Events .  .  .  .  .  .  .  .  .  .  .  .  .  .  .  .  .  .  .  .  .  .  .  .  .  .  .  .  .  .  .  .  .  .  .  .  .  .  .  .  .  .  .  .  .  .  .  .  .  .  .  .  . 46
Adam Kunsemiller
                                      Breach Discovery Methods .  .  .  .  .  .  .  .  .  .  .  .  .  .  .  .  .  .  .  .  .  .  .  .  .  .  .  .  .  .  .  .  .  .  .  .  .  .  .  .  .  .  .  .  .  .  .  .  .  .  .  .  . 48
Kenny Lee
                                      Anti-Forensics  .  .  .  .  .  .  .  .  .  .  .  .  .  .  .  .  .  .  .  .  .  .  .  .  .  .  .  .  .  .  .  .  .  .  .  .  .  .  .  .  .  .  .  .  .  .  .  .  .  .  .  .  .  .  .  .  .  .  .  .  .  .  .  .  . 52
Wayne Lee
                                      PCI DSS Compliance  .  .  .  .  .  .  .  .  .  .  .  .  .  .  .  .  .  .  .  .  .  .  .  .  .  .  .  .  .  .  .  .  .  .  .  .  .  .  .  .  .  .  .  .  .  .  .  .  .  .  .  .  .  .  .  .  .  .  . 53
Kevin Long
                               Conclusions and Recommendations  .  .  .  .  .  .  .  .  .  .  .  .  .  .  .  .  .  .  .  .  .  .  .  .  .  .  .  .  .  .  .  .  .  .  .  .  .  .  .  .  .  .  .  .  .  . 56
Raphael Perelstein
                               Appendices from the United States Secret Service  .  .  .  .  .  .  .  .  .  .  .  .  .  .  .  .  .  .  .  .  .  .  .  .  .  .  .  .  .  .  .  .  . 58
Enrico Telemaque
                                      Appendix A: Online Criminal Communities  .  .  .  .  .  .  .  .  .  .  .  .  .  .  .  .  .  .  .  .  .  .  .  .  .  .  .  .  .  .  .  .  .  .  .  .  . 58
Denson Todd
                                      Appendix B: Prosecuting Cybercrime—The Albert Gonzalez story  .  .  .  .  .  .  .  .  .  .  .  .  .  .  . 62
Yuichi Uzawa
                               About Verizon Investigative Response .  .  .  .  .  .  .  .  .  .  .  .  .  .  .  .  .  .  .  .  .  .  .  .  .  .  .  .  .  .  .  .  .  .  .  .  .  .  .  .  .  .  .  .  . 63
J. Andrew Valentine
                               About the United States Secret Service  .  .  .  .  .  .  .  .  .  .  .  .  .  .  .  .  .  .  .  .  .  .  .  .  .  .  .  .  .  .  .  .  .  .  .  .  .  .  .  .  .  .  .  . 63
Nicolas Villatte
Matthijs van der Wel
Paul Wright                    For additional updates and commentary, please visit
                               http://securityblog .verizonbusiness .com .
SPECIAL THANKS TO:             For inquiries directed to the United States Secret Service, contact
                               databreachstudy@usss .dhs .gov .
Tracey Beeferman
Carl Dismukes
Paul Goulding
Carole Neal
2010 Data Breach Investigations Report
A study conducted by the Verizon Business RISK team
in cooperation with the United States Secret Service.
Executive Summary
In some ways, data breaches have a lot in common with fingerprints. Each is unique and we learn a great deal by analyzing the
various patterns, lines, and contours that comprise each one. The main value of fingerprints, however, lies in their ability to identify
a particular individual in particular circumstances. In this sense, studying them in bulk offers little additional benefit. On the other
hand, the analysis of breaches in aggregate can be of great benefit; the more we study, the more prepared we are to stop them.

Not surprisingly, the United States Secret Service (USSS) is also interested in studying and stopping data breaches. This was a
driving force in their decision to join us in this 2010 Data Breach Investigations Report. They’ve increased the scope of what
we’re able to study dramatically by including a few hundred of their own cases to the mix. Also included are two appendices
from the USSS. One delves into online criminal communities and the other focuses on prosecuting cybercrime. We’re grateful
for their contributions and believe organizations and individuals around the world will benefit from their efforts.

With the addition of Verizon’s 2009 caseload and data contributed from the USSS, the DBIR series now spans six years, 900+
breaches, and over 900 million compromised records. We’ve learned a great deal from this journey and we’re glad to have the
opportunity to share these findings with you. As always, our goal is that the data and analysis presented in this report proves
helpful to the planning and security efforts of our readers. We begin with a few highlights below.


  WHO IS BEHIND DATA BREACHES?

 70% resulted from external agents (-9%)                                      Including the USSS cases in this year’s report shook things up a
                                                                              bit but didn’t shake our worldview . Driven largely by organized
                                                                              groups, the majority of breaches and almost all data stolen
 48% were caused by insiders (+26%)                                           (98%) in 2009 was still the work of criminals outside the victim
                                                                              organization . Insiders, however, were more common in cases
 11% implicated business partners (-23%)                                      worked by the USSS, which boosted this figure in the joint
                                                                              dataset considerably . This year’s study has by far improved our

 27% involved multiple parties (-12%)                                         visibility into internal crime over any other year . Breaches
                                                                              linked to business partners continued the decline observed
                                                                              in our last report and reached the lowest level since 2004 .


                                                                              HOW DO BREACHES OCCUR?

 Related to the larger proportion of insiders, Misuse sits atop the
 list of threat actions leading to breaches in 2009 . That’s not to say
                                                                              48% involved privilege misuse (+26%)
 that Hacking and Malware have gone the way of the dinosaurs;
 they ranked #2 and #3 and were responsible for over 95% of all               40% resulted from hacking (-24%)
                                                                              38% utilized malware (<>)
 data comprised . Weak or stolen credentials, SQL injection, and
 data-capturing, customized malware continue to plague
 organizations trying to protect information assets . Cases
 involving the use of social tactics more than doubled and
 physical attacks like theft, tampering, and surveillance ticked up
                                                                              28% employed social tactics (+16%)
 several notches .
                                                                              15% comprised physical attacks (+6%)
                                                                          2
WHAT COMMONALITIES EXIST?

98% of all data breached came from servers (-1%)                         As in previous years, nearly all data were breached from servers
                                                                         and applications . This continues to be a defining characteristic

85% of attacks were not considered highly difficult (+2%)                between data-at-risk incidents and those involving actual
                                                                         compromise . The proportion of breaches stemming from
                                                                         highly sophisticated attacks remained rather low yet once
61% were discovered by a third party (-8%)                               again accounted for roughly nine out of ten records lost . In
                                                                         keeping with this finding, we assessed that most breaches

86% of victims had evidence of the breach in their log files             could have been avoided without difficult or expensive
                                                                         controls . Yes, hindsight is 20/20 but the lesson holds true; the
                                                                         criminals are not hopelessly ahead in this game . The more we

96% intermediatewere avoidable through simple or
    of breaches
                 controls (+9%)
                                                                         know, the better we can prepare . Speaking of being prepared,
                                                                         organizations remain sluggish in detecting and responding to
                                                                         incidents . Most breaches are discovered by external parties and
                                                                         only then after a considerable amount of time .
79% compliance to PCI DSS had not achieved
    of victims subject


                                                                         WHERE SHOULD MITIGATION EFFORTS BE FOCUSED?

While we’ve added some new suggestions to the Conclusions
and Recommendations section of this report, what you see to
the right is similar to the message we’ve been preaching from
the beginning . That’s not because we don’t feel like writing
another sermon; it’s simply that, based on the data before us,
all the points in this one still apply .
This study always reminds us that our profession has the
necessary tools to get the job done . The challenge for us lies          Eliminate unnecessary data; keep tabs on what’s left
in selecting the right tools for the job at hand and then not
letting them get dull and rusty over time . Evidence shows
when that happens, our adversaries are quick to take
                                                                         Ensure essential controls are met
advantage of it .
                                                                         Check the above again
The amount of breaches that exploit authentication in
some manner is a problem . In our last report it was default
credentials; this year it’s stolen and/or weak credentials .
                                                                         Test and review web applications
Perhaps this is because attackers know most users are
over-privileged . Perhaps it’s because they know we don’t
                                                                         Audit user accounts and monitor privileged activity
monitor user activity very well . Perhaps it’s just the easiest
way in the door . Whatever the reason, we have some work to
                                                                         Filter outbound traffic
do here . It doesn’t matter how hardened our defenses are if
we can’t distinguish the good guys from the bad guys .                   Monitor and mine event logs
Malware gets increasingly difficult to detect and prevent
(especially once the attacker owns the system) . Therefore,
protect against the damage malware does after infection,
much of which can be mitigated if outbound traffic is restricted .
Finally, the value of monitoring (perhaps we should say
“mining”) logs cannot be overstated . The signs are there; we
just need to get better at recognizing them .


                                                                     3
Methodology
It is often said that the role of science is to explain the “how” of things in the natural world. We find it a fitting description and
applaud all who study the intricacies of our field in pursuit of greater understanding. In that vein, the 2010 Data Breach
Investigations Report (DBIR) marks the third installment (fifth if you count supplemental reports) in our continuing effort to
shed light on the “how” of things in the world of computer crime.

The collection of data through rigorous observation is, of course, one of the cornerstones of any scientific endeavor. While
we like to think our methodology has been rigorous, it cannot be said that it has been entirely consistent. The 2008 DBIR was
a retrospective covering four years (2004-2007) of Verizon’s caseload in one massive data collection effort. The scope was
large but the level of analysis was somewhat limited due to the passage of time. The shift from historic to ongoing collection
for the 2009 DBIR opened the door to more active
observation, greater detail, and new areas of study. This                  Not only does this increase the size of the
approach certainly would have worked again for this year’s
                                                                         window of visibility we have into the world
report and would have maintained a state of consistency,
which is a good trait to have in a methodology. Our ultimate                 of data breaches but also grants a new
goal, however, is not a state of consistency; our ultimate               perspective into that world. As will be seen,
goal is a state of knowledge. It is to understand and explain
                                                                          our caseloads share many similarities, but
the “how.”
                                                                              there are some key differences as well.
For this reason, we are shaking things up again by including
a completely foreign and very different (yet still very reliable)
dataset in the 2010 DBIR. We’re thrilled to welcome the contributions (in data and expertise) of the United States Secret
Service (USSS) to this year’s report. Not only does this increase the size of the window of visibility we have into the world of
data breaches but also grants a new perspective into that world. As will be seen, our caseloads share many similarities, but
there are some key differences as well. Both are instructive and we firmly believe this joint effort will lead us closer to the goal
described above.

Pulling the two datasets together was quite an undertaking for both parties and the rest of this section will explain how it
was accomplished.


Verizon Data Collection Methodology
The underlying methodology used by Verizon remains unchanged from that of previous years. All results are based on
firsthand evidence collected during paid forensic investigations conducted by Verizon from 2004 to 2009. The 2009 caseload
is the primary analytical focus of the report, but the entire range of data is referenced extensively throughout. Though the
Investigative Response (IR) team works a variety of engagements, only those involving a confirmed breach are included in
this data set. To help ensure reliable and consistent input, all investigators use the Verizon Enterprise Risk and Incident Sharing
(VERIS) framework to record case data and other relevant details. The information collected using VERIS is then submitted to
members of the RISK Intelligence team for further validation and analysis. The aggregate repository of case data is sanitized
and contains no information that would enable one to ascertain a client’s identity.


                                                                    4
USSS Data Collection Methodology
With all the talk of “shaking things up” above, one might conclude that consistency was tossed out the window in this year’s
report. This is not the case. In terms of data collection, the USSS methodology differs little from that of Verizon. For the
purposes of this study, the USSS created an internal application based on the VERIS framework. From the thousands of cases
                                                                  1
worked by the USSS during 2008 and 2009 , the scope was narrowed to only those involving confirmed organizational data
             2
breaches in alignment with the focus of the DBIR. The scope was further narrowed to include only cases for which Verizon
                                                              3
did not conduct the forensic investigation . Of these cases, a sample was taken and requests to input data were sent to USSS
agents who worked each case. In doing so, these agents utilized investigative notes, reports provided by the victim or other
forensic firms, and their own experience gained in handling the case. This yielded 257 qualifying cases for which data were
collected within the time frame set for this report. The resulting dataset was purged of any information that might identify
organizations or individuals involved in the case and then provided to Verizon’s RISK Intelligence team for analysis.

In conclusion, we would like to reiterate that we make no claim that the findings of this report are representative of all data
breaches in all organizations at all times. Even though the merged Verizon-USSS dataset (presumably) more closely reflects
reality than either in isolation, it is still a sample. Although we believe many of the findings presented in this report to be
appropriate for generalization (and our confidence in this grows over time), bias undoubtedly exists. Even so, there is a wealth
of information here and no shortage of valid and clear takeaways. As with any study, readers will ultimately decide which
findings are applicable within their organization.


A BRIEF PRIMER ON VERIS
VERIS is a framework designed to provide a common language for describing security incidents in a structured and
repeatable manner . It takes the narrative of “who did what to what or whom with what result” and translates it into the
kind of data you see presented in this report . Because many readers asked about the methodology behind the DBIR
and because we hope to facilitate more information sharing on security incidents, we released VERIS earlier this year for
free public use . A brief overview of VERIS is available on our website4 and the complete framework can be obtained from the
VERIS community wiki5 . Both are good companion references to this report for understanding terminology and context .


1 The scope of data collection for the USSS was 2008 and 2009. However, over 70 cases worked in 2008 pertained to breaches that occurred in 2007. Because this is a large
  enough sample and allows for three-year trend analysis, we show them separate from 2008 breaches.
2 The USSS works many cases related to theft and fraud that are not included in this report. For instance, crimes committed against consumers that do not involve an organization
  or its assets are not included. Criminal activities that occur after data are stolen (i.e., “white plastic fraud” and identity theft) are also not within the scope of this study.
3 The USSS is often involved in one manner or another with cases worked by Verizon (especially the larger ones). To eliminate redundancy, these cases were removed from the
  USSS sample. Where both Verizon and the USSS worked a case, Verizon-contributed data were used.
4 http://www .verizonbusiness .com/resources/whitepapers/wp_verizon-incident-sharing-metrics-framework_en_xg .pdf
5 https://verisframework .wiki .zoho .com/


                                                                                          5
Cybercrime Year in Review, 2009
 2009 was, in many ways, a transformational year in the trenches. As attackers and defenders vied for advantage, there were
 numerous developments on many fronts around the world. It’s difficult to measure who’s winning with any certainty but
 there are, at least, some measurements available. One of them, public breach disclosures, fell noticeably in 2009. Organizations
                                              6                                      7
 that track disclosed breaches like DataLossDB and the Identity Theft Resource Center reported figures that were well off
 2008 totals. Private presentations and hallway conversations with many in the know suggested similar findings. Our own
 caseload reveals this as well. In a report dedicated to the analysis of annual breach trends, it seems wholly appropriate to
 reflect on why. It also provides a fitting backdrop for discussing some key 2009 milestones.

 In our last report, we observed that massive exposures of payment card data in recent years have effectively flooded the
 market and driven down the prices criminals can get for their stolen wares. 2009, then, may simply be the trough in a natural
                                                supply and demand cycle. If supply has outpaced demand, why release more product?
               Perhaps                          Perhaps cybercriminals are directing their resources elsewhere until market conditions
                                                improve. It is also possible that breaches are occurring at the same rate but the criminals are
       cybercriminals                           sitting on stolen data until demand picks up. Because fraud alerts are the leading method of
  are directing their                           discovering breaches, it stands to reason that many breaches could occur without anyone
resources elsewhere                             being the wiser if the criminal decided it was in his best interest to be patient.

          until market                          Another possible reason for this decline is law enforcement’s effectiveness in capturing the
                                                criminals. The prosecution of Albert Gonzalez was a major event in 2009. He and his
conditions improve.                             accomplices were responsible for some of the largest data breaches ever reported. Taking
    It is also possible                         them off the streets, so to speak, may have caused a temporary (but we can hope for
                                                permanent) dip in breaches. It is also possible that their prosecution made other
   that breaches are
                                                cybercriminals take some time off to reevaluate their priorities in life.
     occurring at the
                                                2009 witnessed much discussion and consideration around the world about breach
  same rate but the                             disclosure laws. As seen in the U.S., the creation of these laws can have a huge effect on
criminals are sitting                           breach statistics. So can the administration of them. Depending on how the legal
                                                environment evolves in this area, it could have a significant impact on the number of
on stolen data until
                                                known breaches worldwide.
  demand picks up.
                                                While it’s highly unlikely that cloud computing or virtualization had anything to do with breach
                                                disclosure rates, they were no doubt hot topics in 2009. We continue to search for a link between
 data breaches and cloud-based or virtualized infrastructure but continue to find none.

 Finally, we would be remiss if we did not touch on the subject of the hour, Advanced Persistent Threats (APTs). Yes, APTs are
 real but they are not new. Although the hype has grown exponentially, the post-2010 threat of APTs to your organization is
 more or less the same as pre-2010 levels. While we do appreciate the business, we would like to save you some expense and
 heartache: APTs are not the source of all malware infections and suspicious traffic on your network. Don’t get caught up in
 the hype. Manage your defenses based on reality, not on publicity. We hope this report helps with that.


 6 http://datalossdb .org/
 7 http://www .idtheftcenter .org/index .html


                                                                               6
Results and Analysis
The Verizon IR team worked over 100 cases in 2009; 57 of them were confirmed breaches. While lower than typical for our
caseload, many of these breaches were quite large and complex, often involving numerous parties, interrelated incidents,
                                                                                         8
multiple countries, and many affected assets. The 257 qualified cases in the USSS dataset included 84 cases from 2009, 102
from 2008, and 71 from 2007.

The primary dataset analyzed in this report contains the 141 (57 + 84) confirmed breach cases worked by Verizon and the
USSS in 2009. The total number of data records compromised across these cases exceeds 143 million. In several places
throughout the text, we show and discuss the entire range of data for both organizations (2004-2009 for Verizon, 2007-2009
for the USSS). No small amount of internal discussion took place regarding how best to present statistics on the combined
Verizon-USSS dataset. In the end, we decided that its most compelling feature was not simply the ability to compare and
contrast Verizon’s cases with those of the USSS but rather the opportunity to study a more representative sample. Therefore,
the chosen approach is to present the combined dataset intact and highlight interesting differences (or similarities) within
the text where appropriate. There are, however, certain data points that were collected by Verizon but not the USSS; these are
identified in the text/figures.

As was the case in our last report, about two-thirds of the breaches covered herein have either not yet been disclosed or
never will be. Many were related in some manner (i.e., same perpetrators or source IP). So far, almost 15% of Verizon’s 2009
cases led to known arrests while 66% of USSS cases resulted in the arrest of a suspect. Even more impressive is that most of
those ended in a conviction.


                                                                With the addition of Verizon’s 2009 caseload and data
                                                        contributed from the USSS, the DBIR series now spans six years,
                                                           900+ breaches, and over 900 million compromised records.

The figures in this report utilize a consistent format. Values shown in dark gray pertain to breaches while values in red pertain
to data records. The “breach” is the incident under investigation in a case and “records” refer to the amount of data units (files,
card numbers, etc.) compromised in the breach. Figures and tables do not always contain all possible options but only those
having a value greater than 0. If you are interested in seeing all options for any particular figure, these can be found in the
VERIS framework.

Without further delay, we present the investigative findings and analysis of Verizon and the USSS.


8 Refer to the Methodology section for an explanation of the qualification process.


                                                                                      7
Demographics
Of all sections in this report, demographics always present the greatest challenge for drawing out deeper meaning behind
the numbers. While attack trends, incident response metrics, and other results are certainly dependent upon a given year’s
caseload, demographic data seem particularly so. Does the fact that we have more/less of a particular industry or region
mean it is under increased attack? Is it more vulnerable? Did laws or other environmental factors change? Sheer coincidence?
Obviously, it’s difficult to know for certain. Demographic information is helpful, though, in establishing the context for other
results. Thus, in this section we will relay the statistics, infer what we can, and let you do the rest.


Figure 1 . Industry groups represented by percent of breaches
      33%               23%              15%                6%                5%               4%                4%                4%               3%                4%


   Financial        Hospitality         Retail       Manufacturing Tech Services            Business       Government            Media         Healthcare           Other
   Services                                                                                 Services


Data breaches continue to occur (in our caseload and elsewhere) within all types of organizations. These are categorized as
                                                                                                                                    9
they have been in previous reports according to the industry groups represented in Figure 1 . Financial Services, Hospitality,
and Retail still comprise the “Big Three” of industries affected (33%, 23%, and 15% respectively) in the merged Verizon-USSS
dataset, though Tech Services edged out Retail in Verizon’s caseload. That this is consistently true of both the Verizon and
USSS caseloads does seem to carry some significance.

The targeting of financial organizations is hardly shocking; stealing digital money from information systems rather than
vaults is basically just a less primitive form of bank robbery. It represents the nearest approximation to actual cash for the
criminal. Also, and perhaps more importantly, financial firms hold large volumes of sensitive consumer data for long periods
of time. For this reason (and others), they fall under more stringent regulation and reporting requirements. This, in turn,
increases the likelihood that breaches will require criminal and/or forensic investigation. In short, where other industries
might be able to “sweep it under the rug,” financial institutions are finding it increasingly difficult to do so. Regardless of the
root cause(s), a growing percentage of cases and an astounding 94% of all compromised records in 2009 were attributed to
Financial Services.


9 There are some changes in the way we categorize industries in this report. Most notably, “Food and Beverage” has been folded into the “Hospitality” group as this seems to be
  standard convention. A complete list of industries can be found in the VERIS framework.


                                                                                       8
The Hospitality and Retail industries exhibit similar trends when it comes to data            Figure 2 . Compromised records
                                                                                                 by industry group
   breaches, which has a lot to do with their acceptance of payment cards and use
                                                                                                 6% Other Industries
   of Point of Sale (POS) systems. This tends to draw a certain breed of criminal who
   favors certain ways and means of attack. There were quite a few public breach
   disclosures within the Hospitality industry in the last year or so and this spilled
   over into investigations conducted by Verizon and the USSS. Not surprisingly,
   restaurants and hotels comprise the bulk of cases in this industry group. Retail,
   which ranked first in total breaches in our last two reports, has fallen to third place                         94%
   and now accounts for less than half of its former glory (31% in ‘08 down to 14% in                        Financial Services
   ‘09). This is not simply a by-product of incorporating USSS data (our own
   percentage for Retail was an even lower 9%) but we find it hard to attribute much
   more to these numbers than their face value.

   For regional trends, it’s worth making a distinction between the USSS and Verizon
   datasets. The USSS caseload, as one might suspect, is comprised of nearly all breaches that occurred in the United States
   (though investigating and prosecuting these crimes takes them all around the world). On the other hand, over half of the
   breaches investigated by Verizon in 2009 occurred outside the U.S. (the “North America” region includes cases from Canada
   and the Dominican Republic). Countries in which Verizon investigated confirmed and suspected breaches are highlighted in
   Figure 3. Over the past two years our caseload has consistently grown in Asia-Pacific and Western European countries. It is
   unclear as to whether our expanded international IR team or changes in global incident trends are most responsible for this
   but other sources suggest growth in these regions as well.

                                                                       The apparent disparity between the number of known
The targeting of financial organizations                               data breaches in the United States and other parts of the
is hardly shocking; stealing digital money                             globe has led some to conclude that other parts of the
                                                                       world are safer environments for electronic business. We
from information systems rather than
                                                                       do not believe this to be the case. The same basic
vaults is basically just a less primitive form                         information and communication technologies are present
of bank robbery. It represents the nearest                             in homes, businesses, and governments all around the
                                                                       world. Admittedly, there are some differences that have an
approximation to actual cash for the criminal.                         impact on cybercrime (the Chip and PIN payment
                                                                       infrastructure is a good example) but these differences are
   not enough to explain the disparity. The primary reason we hear more about data breaches in the U.S. (and in the report)
   stems from mandatory disclosure laws. Outside the U.S., breach disclosure differs significantly. Some countries are silent on
   the matter, others encourage it but don’t require, and some even discourage disclosure.


                                                                   9
Figure 3 . Countries represented


Countries in which a
breach was confirmed
Australia          Greece
Austria            Japan
Belgium            Luxembourg
Canada             Netherlands
China (mainland    Poland
and Hong Kong)
                   Spain
Dominican
                   Switzerland
Republic
                   United Kingdom
France
                   United States
Germany
Countries in which a breach was
investigated but not confirmed
Bulgaria         Singapore
Egypt            Sweden
Italy


         The bottom line is that where disclosures occur, they often require investigations, which sometimes require external
         investigators, which, in turn, means breaches are more likely to show up in this study. As in previous years, the majority of
         cases investigated by Verizon in 2009 have not yet been disclosed and may never be. Only a handful of breaches outside the
         U.S. were publicly reported. Of those, two did so because they were regional facilities of U.S.-based organizations.

         Figure 4 shows that, once again, a breakdown of organizational size follows a rather normal-looking distribution. It’s quite
         possible (and perhaps logical) that an organization’s size matters little in terms of its chances of suffering a data breach. One
         might speculate that smaller budgets mean less security spending but it probably also means fewer assets to protect and a
         lower profile. Thieves are more likely to select targets based on the perceived value of the data and cost of attack than victim
         characteristics such as size.

                                                                       Over half of the breaches investigated by Verizon in
                                                                                                   2009 occurred outside the U.S.


                                                                        10
Figure 4 . Organizational size by percent of breaches (number of employees)


          Over 100,000           2%


      10,001 to 100,000                                                                             20%


        1,001 to 10,000                                                                             20%                   26%


           101 to 1,000                                                                                     23%


              11 to 100                                                                      18%


                1 to 10                                    9%


Many of our customers express concern about the security ramifications of mergers, acquisitions, and other major
organizational changes (perhaps even more so than normal given economic conditions in recent years). This is understandable
as these changes bring together not only the people and products of separate organizations but their technology
environments as well. Seamless integration of technology, process, and mind-set certainly has its fair share of challenges. Last
year, we reported that 13% of our caseload involved organizations that had recently been involved in a merger or acquisition.
In 2009 that figure was 9% and another 9% had restructured in some significant way. While nothing can be claimed or
inferred directly from these findings, we believe it is well worth watching this metric over time.


Threat Agents                                                                                             VERIS Classification Note: If the
                                                                                                          agent’s role in the breach is limited to
Threat agents refer to entities that cause or contribute to an incident. There can be more than           a contributory error (see note in the
                                                                                                          Threat Actions section under Error),
one agent involved in any incident and their involvement can be malicious or non-malicious,               they would not be included here. For
intentional or accidental, direct or indirect. Identifying those responsible for a breach is critical     example, if an insider’s unintentional
                                                                                                          misconfiguration of an application
to any forensic investigation, not only for purposes of response and containment, but also for            left it vulnerable to attack, the insider
                                                                                                          would not be considered an agent if
creating current and future defensive strategies. Verizon recognizes three primary categories
                                                                                                          the application were successfully
of threat agents—External, Internal, and Partner.                                                         breached by another agent. An
                                                                                                          insider who deliberately steals data
External: External threats originate from sources outside the organization and its                        or whose inappropriate behavior
                                                                                                          (i.e., policy violations) facilitated the
network of partners. Examples include hackers, organized crime groups, and government                     breach would be considered an
                                                                                                          agent in the breach.
entities, as well as environmental events such as weather and earthquakes. Typically, no
trust or privilege is implied for external entities.

Internal: Internal threats are those originating from within the organization. This encompasses company executives,
employees, independent contractors (i.e., 1099 staff ), and interns, etc., as well as internal infrastructure. Insiders are trusted
and privileged (some more than others).

Partners: Partners include any third party sharing a business relationship with the organization. This includes suppliers, vendors,
hosting providers, outsourced IT support, etc. Some level of trust and privilege is usually implied between business partners.


                                                                     11
Figure 5 . Threat agents (inclusive) by percent of breaches                        Figure 5 records the distribution of threat agents among breach

              70%
                                                                                   cases worked by Verizon and the USSS in 2009. Immediately
                                                                                   noticeable is a substantial change in the composition of threat
                                                                                   agents from previous DBIRs. While these results don’t go so far
              62%                                                                                             10
                                                                                   as to justify the “80% Myth ” they certainly don’t fall in line with
                                48%
                                                                                   the 80/20 external vs. internal ratio that has been a staple of
                                46%                                                Verizon’s caseload. The percentage of breaches attributed to
                                                                                   external agents slid 9% (though 70% is not an historical outlier),
                                                                                   insiders more than doubled, and partners represent a mere
                                                                                   third of their 2008 level. That’s a lot of change to digest but this
                                                  11%                              section is dedicated to sorting it all out.
                                                  10%                              Essentially, there are three possible explanations for these results:

            External          Internal           Partner                           1. They reflect changes in Verizon’s caseload

                                                      Suspected                    2. They reflect the addition of USSS caseload

                                                                                   3. They are a product of both 1 & 2

                                                                                   We will start with option 1. Figure 6 shows the distribution of
threat agents for breaches worked by Verizon over the last five years. From this, it is clear that the lower proportion of
external agents is not due to Verizon’s caseload, as this statistic hit its highest mark ever in 2009. Neither can it explain
the rise for insiders in the merged dataset. The percent of breaches involving partners, however, did drop substantially
and for the second year in a row. It is unclear whether this is due to increased awareness of third-party security threats,
regulatory guidance focusing on vendor management, a shift in criminal strategy, a change in Verizon’s IR clients, all of
the above, or none of the above. Whatever the reason(s), we view it as a positive outcome and hope this problem is
being reigned in.


                                                           The changes evident for threat agents in 2009 stem partially
                                                           from a drop in partners within Verizon’s caseload but mostly
                                                               from the addition of a materially different USSS dataset.


10 http://taosecurity .blogspot .com/2009/05/insider-threat-myth-documentation .html


                                                                                   12
Figure 6 . Threat agents over time by percent of breaches

 100%

  90%

  80%

  70%

  60%
                                                                                                                      VZ External
  50%
                                                                                                                      VZ Internal
  40%
                                                                                                                      VZ Partner
  30%
                                                                                                                      USSS External
  20%

  10%                                                                                                                 USSS Internal

   0%                                                                                                                 USSS Partner

           2005                  2006                  2007                 2008                 2009


Figure 6 also shows the same information discussed in the preceding paragraph for USSS cases (see dashed lines). Undoubtedly,
the changes in Figure 5 are largely due to the inclusion of the USSS caseload, as their results show a strong representation of
internal threat agents, comparatively fewer outsiders, and a very low percentage of partner-related breaches. As a law
enforcement agency, it would follow that the USSS would have a different perspective on the broader security incident
population. For example, an organization suffering a data breach due to the actions of an insider (especially if that insider is part
of an easily-identified list of suspects or used simple methods to perpetrate the crime) is more likely to call law enforcement
directly. If true, this would reinforce the assertions and findings of some, especially law enforcement agencies, that insiders are a
more frequent source of incidents than stats released by external parties like Verizon often show. In addition, it’s also important
to consider the impact of disclosure laws on the proportions represented in the various datasets.

So, if #1 has some truth to it and #2 is wholly true, then #3 must be the best option. The changes evident for threat agents in
2009 stem partially from a drop in partners within Verizon’s caseload but mostly from the addition of a materially different USSS
dataset. As stated in the beginning of this report, our motivation in studying a larger sample is to better understand the biases
of our own and to gain a more complete and accurate representation of the entire population of breaches. These results are
clearly the product of that larger perspective.


                                                                 13
Figure 7 . Threat agents (exclusive) by percent of breaches                           Following this discussion, there are a few observations to
                                                                                      note regarding Figure 7 which contrasts single and multi-
       45%                27%                 1%                  27%
                                                                                      agent breaches. The 27% of cases involving more than
                                                                                      one agent is well below the 2008 level of 39%. Though not
                                                                                      apparent from the figure itself, most multi-agent breaches
                                                                                      worked       by   Verizon       exhibit    an       external-partner
  External only       Internal only      Partner only      Multiple agents
                                                                                      combination. In most of these, partner assets are
                                                                                      compromised by an external agent and used to attack the
victim. On the other hand, external-internal is far more common in USSS cases. As will be discussed later in this report, this
scenario often involves an outsider soliciting or bribing an employee to embezzle or skim data and/or funds. Partner-internal
pairings are rare within both caseloads.

Breach Size by Threat Agents
Though we do not assert that the full impact of a breach                              Figure 8 . Compromised records by threat agent, 2009

is limited to the number of records compromised, it is a                                 138,566,355      2,640,240             130            2,436,297
measurable indicator of it. Analysis around financial losses
incurred by breach victims is probably the most requested
                                         11
addition to the DBIR. For various reasons , forensic
investigators do not have nearly as much visibility into                                External only   Internal only      Partner only     Multiple agents

this as they have into the immediate details surrounding
a breach. We do, however, include metrics for collecting
impact data within VERIS and refer interested readers
                                                                                      Figure 9 . Compromised records by threat agent, 2004-2009
there for more information.
                                                                                        800,720,651     28,853,827         43,744,573         46,451,904
Figure 8 records the distribution of the 143+ million
records compromised across the merged 2009 dataset
among threat agents. It looks a great deal like it did in our
last DBIR. There is not a linear relationship between
                                                                                        External only   Internal only     Partner only      Multiple agents
frequency and impact; harm done by external agents far
outweighs that done by insiders and partners. This is true
for Verizon and for the USSS and true for this year and in
years past. To illustrate this point, we present Figure 9 showing the distribution of the over 900 million compromised records
in the merged dataset between 2004 and 2009.

We could provide commentary to Figure 9, but what could it possibly add? If a chart in this report speaks with more clarity
and finality we aren’t sure what it is.


                      We could provide commentary to Figure 9, but what could it possibly add? If a
                    chart in this report speaks with more clarity and finality we aren’t sure what it is.


11 http://securityblog .verizonbusiness .com/2009/04/16/to-dbir-show-me-the-money/


                                                                                 14
External Agents (70% of breaches, 98% of records)                                Table 1 . Types of external agents by percent
                                                                                 of breaches within External
Table 1 presents a comparison of the various types of external threat
agents identified during 2009 by Verizon and the USSS. The merged                 Organized criminal group          24%
results continue to show that external breaches are largely the work of
organized criminals. Banding together allows them to pool resources,              Unaffiliated person(s)            21%

specialize skills, and distribute the work effort, among other advantages.
                                                                                  External system(s) or site         3%
Figure 10 demonstrates the effectiveness of this approach. Crime has
been a business for a very long time. This is just the same old story played      Activist group                     2%
out on a different (digital) stage. We refer readers to Appendix A for more
                                                                                  Former employee                    2%
information on organized criminal communities.                                    (no longer had access)


The large proportion of “unknown” in Table 1 is the result of several factors.    Another organization               1%
                                                                                  (not partner or competitor)
Sometimes the particular type of agent cannot be determined.
Sometimes the victim does not wish to spend time or money toward                  Competitor                         1%
making this determination. The USSS contains far fewer “unknown” agents
                                                                                  Customer                           1%
due to their role in identifying and prosecuting suspects.                        (B2C)


In terms of the role external agents played in 2009 breaches, 84%                 Unknown                           45%
participated directly in the attack. The rest solicited another agent to
perpetrate the attack or supported it in some other manner. Scenarios of
this are discussed elsewhere in this report.


Figure 10 . Percent of compromised
records attributed to organized crime

                                                       Banding together allows criminal groups to pool
             15%
           Other
                                                      resources, specialize skills, and distribute the work
           agents
                                                     effort, among other advantages. Crime has been a
                                                      business for a very long time. This is just the same
                    85%
                Organized
                                                       old story played out on a different (digital) stage.
             criminal groups


                                                                15
Figure 11 . Origin of external agents by percent of breaches within External     Pinpointing the geographic origin of these
                                                                                  attacks can be problematic, especially when it
             Europe-East                                 21%                      hinges mainly on source IP addresses.
                 (incl. Russia)

        Americas-North                               19%                          Fortunately,     forensic      investigators—and
                                                                                  especially law enforcement agencies—often
                 Asia-East                         18%
            Europe-West                                                           have much more to go on than that. Even if we
(incl. Northern and Southern)               10%
                                                                                  accept that the IP address that shows up in log
             Middle East               5%
                                                                                  files does not belong to the actual machine of
                      Africa      2%
                                                                                  the actual threat agent (i.e., it is a bot controlled
Asia-South/Southeast              2%                                              by the agent), it is still informative and
                  Oceania         2%                                              potentially useful for defensive purposes.
(Australia, New Zealand, etc.)

                Unknown                                                31%        Figure 11 shows the regional origin of relevant
                                                                                  external attacks.

                                                                                  Once again, more breaches originate from East
                                                                                  Europe than any other region (although North
 America and East Asia remain a close #2 and #3). Comparing “type” and “origin” reveals some interesting findings. For instance,
 most organized criminal groups hail from East Europe, while unidentified and unaffiliated persons often come from East Asia.
 Finally, it is worthy of mention that within Verizon’s caseload, East Asia rose to the top spot for the first time in 2009.


 THERE MUST BE SOME MISTAKE—WHERE’S APT?
 Despite the huge amount of buzz around Advanced Persistent Threats (APT) this year, neither the term nor the
 concept is new . Due to this attention, we imagine more than one pair of eyes scanned the list of external agent types
 in search of “APT .” One of the difficulties with APT is that, though it may have an official definition, its use in everyday
 practice varies widely . By it, some refer strictly to nation-states, some to any highly skilled attacker, some to
 particularly difficult methods of attacks or their unrelenting nature . We’re not interested in arguing about the
 definition . We simply want to explain why it is not listed in any figure or table in this report . Rather than identifying an
 “APT attack,” VERIS classifies threat agents and their actions in a descriptive manner . If interested, you can see glimpses
 of “APT-ish elements” throughout this report . Look at the types and origins of external agents (note the absence of the
 “government” category that is an available option in VERIS), examine the types and vectors of threat actions, read our
 assessments of attack difficulty, notice the length of time that passes from compromise to discovery, and check out
 the anti-forensics section . These areas might not be stamped with the acronym “APT” but we do believe them to
 “apt-ly” describe breaches investigated by Verizon and the USSS in 2009 .


                                                                     16
Internal Agents (48% of breaches, 3% of records)                                                  Figure 12 . Role of internal
                                                                                                    agents by percent of breaches
  Of cases involving internal threat agents in 2009, investigators determined 90% were              within Internal
  the result of deliberate and malicious activity. This finding does not mean that insiders                4%     Unintentional
  never unintentionally contribute to breaches; they very often do. As discussed earlier,                  6%     Inappropriate

  our method of classification does not consider insiders to be an active part of the
  event chain if their role is limited to contributory error. Inappropriate actions include
  policy violations and other questionable behavior that, while not overtly malicious,
  can still result in harm to information assets. Not only can inappropriate behavior
  contribute directly to a breach, but it may also be an ill omen of what’s to come. Over
  time investigators have noticed that employees who commit data theft were often
  cited in the past for other “minor” forms of misuse (or evidence of it was found and
                                                                                                           90%    Deliberate
  brought to light during the investigation).

  Recently, many have hypothesized that insider crime would rise due to financial strain
  imposed by global economic conditions. Hard times breed hard crimes as they say. It
  is entirely possible that this is occurring, but neither the Verizon nor USSS caseload
  show evidence of it. As seen back in Figure 6, Verizon shows a flat trend for insiders
  and the USSS shows a downward trend over the last three years. Nevertheless, it is a
  logical hypothesis and worthy of further study.

  Analyzing the types of insiders behind breaches yields a great deal of practical
  information. Each of the types listed in Table 2 represent a certain inherent mix of
                                                  skills, duties, privileges, etc., all of
Recently, many have                               which speak to the capabilities and
hypothesized that insider crime                   resources of that agent and the safeguards most relevant to them.
                                                  Traditionally, we have seen a large and fairly even proportion of system/
would rise due to financial                       network administrators to regular users with a few other types mixed in
strain imposed by global                          occasionally. 2009 results are substantially different and, no surprise, this is
                                                  largely due to USSS data. Specifically, it is related to the types of internal
economic conditions. Hard
                                                  crime investigated by the USSS (see the Misuse section under Threat
times breed hard crimes as they                   Actions for a more detailed discussion). As a result, regular employees
say. It is entirely possible that                 were responsible for a much larger share (51%) of breaches. These cases
                                                  typically involved bank tellers, retail cashiers, and other similar personnel
this is occurring, but neither
                                                  taking advantage of their everyday job duties to skim, embezzle, or
the Verizon nor USSS caseload                     otherwise steal data from their employers.
show evidence of it.


                                                                 17
Finance and accounting staff are similar to regular employees in terms           Table 2 . Types of internal agents by percent
                                                                                 of breaches within Internal
of IT privileges but we differentiate them due to the higher privileges
of another sort. Their oversight and management of accounts, records,             Regular employee/end-user             51%
and finances affords them great propensity for harm. Executives are in
a similar position. Though outside the scope of this study, devious acts          Finance/accounting staff              12%
committed by such employees have caused far more damage to
                                                                                  System/network administrator          12%
businesses than IT-related incidents.

While it is clear that pulling off an inside job doesn’t require elevated         Executive/upper management             7%
privileges, evidence consistently supports that they do facilitate the
                                                                                  Helpdesk staff                         4%
bigger ones. Overall, insiders were not responsible for a large share of
compromised records but system and network administrators nabbed
                                                                                  Software developer                     3%
most of those that were. This finding is not surprising since higher
privileges offer greater opportunity for abuse. In general, we find that          Auditor                                1%
employees are granted more privileges than they need to perform
their job duties and the activities of those that do require higher               Unknown                                9%

privileges are usually not monitored in any real way.

It is worth noting that while executives and upper management were
not responsible for many breaches, IP and other sensitive corporate information was usually the intended target when they
were. These acts were often committed after their resignation or termination.

Speaking of that, across all types of internal agents and crimes, we found that 24% was perpetrated by employees who
recently underwent some kind of job change. Half of those had been fired, some had resigned, some were newly hired, and
a few changed roles within the organization. With respect to breaches caused by recently terminated employees, we
observed the same scenarios we have in the past: 1) the employee’s accounts were not disabled in a timely manner, and
2) the employee was allowed to “finish the day” as usual after being notified of termination. This obviously speaks to the need
for termination plans that are timely and encompass all areas of access (decommissioning accounts, disabling privileges,
escorting terminated employees, forensic analysis of systems, etc.).


THE SLIPPERY SLOPE OF INSIDER MISCONDUCT
Verizon investigated a case in which a recently terminated system administrator stole sensitive data from his former
employer as well as personal information belonging to its customers . He then attempted to blackmail the organization
and threatened to go public with the information if they did not meet his demands . Obviously, not a good situation but
what makes it worse is that it might have been avoided with a few changes in policy and practice . On several occasions in
the past, this employee had been cited for IT policy violations and inappropriate behavior . There were harassment
complaints against him filed by other employees . Finally, when he stole a co-worker’s password for a popular social
networking site and modified it with slanderous content, he was let go . Unfortunately, his generic administrative account
was given to his successor with a minor password change (i .e ., “Password2” instead of “Password1”) and we’ve already
covered what happened after that .


                                                              18
Partner Agents (11% of breaches, 1% of records)                                                     Figure 13 . Role of partner
                                                                                                    agents by number of breaches
As discussed already, partner-related breaches are down in comparison to previous years.            within Partner
When partners are a factor, the Verizon and USSS cases have differing perspectives as to
                                                                                                            1     Unintentional
their role. Verizon’s findings continue to show that the majority of breaches involving
partners are the result of third-party information assets and accounts being “hijacked” by
another agent and then used to attack victims. This frequently involves a remote access
connection into the victim’s systems. If compromised, the malicious agent’s actions                         6     Deliberate
would appear to come from a trusted source and therefore be even more difficult to
detect and prevent. Poor partner security practices usually allow or worsen these attacks.


    Organizations that outsource their IT management
    and support also outsource a great deal of trust to
    these partners. In the end, what we said last year
                                                                                                            8
    remains true; poor governance, lax security, and too                                                          Another agent
                                                                                                                  via partner

    much trust is often the rule of the day. Outsourcing
    should not mean “Out of sight, out of mind.”

                                                        The USSS caseload, on the other
Table 3 . Types of partner agents by number             hand,    shows    most    partner
of breaches within Partner                              breaches     stem     from     the
                                                        deliberate and malicious actions of that partner. An example of this
 Remote IT management/support           7
                                                        might be a third-party system administrator who maliciously misuses
 Data processing and analysis           1               her access to steal data from the victim. We believe that the merged
                                                        data set balances these two extremes to arrive at the ratio shown here.
 Hosting provider                       1
                                                        The types of partners in each dataset parallel the differences described
 Onsite IT management/support           1               above. Partners that manage systems are by far the most common
                                                        offenders, whether their role is accidental or deliberate. Assets often
 Security services/consulting           1               involved in these breaches are point-of-sale systems within the hospitality
                                                        and retail industries. Organizations that outsource their IT management
 Shipping/logistics provider            1
                                                        and support also outsource a great deal of trust to these partners. In the
                                                        end, what we said last year remains true; poor governance, lax security,
 Unknown                                3
                                                        and too much trust is often the rule of the day. Outsourcing should not
                                                        mean “Out of sight, out of mind.”


                                                                19
Threat Actions
Threat actions describe what the threat agent did to cause or contribute to the breach. There are usually multiple actions
across multiple categories during a breach scenario. Verizon uses seven primary categories of threat actions, which are
depicted in Figure 14 along with the percent of breaches and compromised records associated with each.


Figure 14 . Threat action categories by percent of breaches and records


        Malware                                                                                    38% / 94%

        Hacking                                                                                        40% / 96%

           Social                                                            28% / 3%

          Misuse                                                                                                        48% / 3%

         Physical                                   15% / 1%

            Error        2% / 0%

   Environmental    0% / 0%


As with the findings for threat agents, we imagine Figure 14 raises some eyebrows among those familiar with previous
versions of this report. Before going any further, we’d like to direct attention to Figure 15 to see if we can turn some of those
raised eyebrows into head nods and an “ah-ha” or two. In the 2008 Supplemental DBIR, we presented all the same basic
statistics as in the original report except sliced up by industry. Figure 15 shows the prevalence of threat actions in Financial
Services from that report. Though by no means a mirror image of Figure 14, it does demonstrate that a dataset containing a
large proportion of financial organizations will exhibit a more “balanced” mix of threat actions and higher values in the Misuse
and Social categories. On the other hand, the Retail and Hospitality industries are very lopsided toward Hacking and Malware.
Therefore, Figure 14 is not a new trend or sudden change in the threat environment. It aligns perfectly well with what we
would expect of a merged Verizon-USSS dataset that contains a higher-than-normal proportion of financial organizations.


                              This is quite a sobering statistic but one that adds yet another chapter to
                              a story we already know: In the big breaches, the attacker hacks into the
                                victim’s network (usually by exploiting some mistake or weakness) and
                              installs malware on systems to collect (lots of) data. That the USSS cases
                                         tell the same story certainly makes it more compelling though.


                                                                 20
Figure 15 . Flashback: Threat action categories by percent of breaches in Financial Services as shown in the 2008 Supplemental DBIR


        Malware                                                        23%

         Hacking                                                              26%


    2008 Supplemental DBIR
           Social

          Misuse                                                                         32%
                                                                                                               42%


         Physical                                      16%

            Error                6%

   Environmental    0%


Though less prevalent than in previous reports, Hacking and Malware are even more dominant than normal with respect
to compromised records. This is quite a sobering statistic but one that adds yet another chapter to a story we already
know: In the big breaches, the attacker hacks into the victim’s network (usually by exploiting some mistake or weakness)
and installs malware on systems to collect (lots of ) data. That the USSS cases tell the same story certainly makes it more
compelling though.


Figure 16 . Threat action categories over time by percent of breaches (Verizon cases)


  80%

  70%
                                                                                                                  Malware
  60%
                                                                                                                  Hacking
  50%
                                                                                                                  Social
  40%
                                                                                                                  Misuse
  30%
                                                                                                                  Physical
  20%

  10%                                                                                                             Error

   0%                                                                                                             Environmental

           2005                   2006                  2007                  2008                2009


                                                                  21
Those wishing to compare 2009                   Figure 17 . Threat actions over time by percent of breaches (USSS cases)
results   to    previous     years   for
                                                 100%
Verizon’s caseload can do so in
Figure 16. Another version of the                 90%

same chart is provided for the three              80%
years for which we have data from                 70%                                                                Malware
the USSS (Figure 17). The most
                                                  60%
noticeable change in 2009 among                                                                                      Hacking

breaches worked by Verizon was a                  50%
                                                                                                                     Social
substantial upswing in malware. For               40%
                                                                                                                     Misuse
the most part, USSS trends held                   30%
steady, with Social and Misuse                                                                                       Physical
                                                  20%
showing        some    growth    while
                                                  10%                                                                Error
Hacking and Malware declined
slightly. The following sections                   0%                                                                Environmental

provide a more in-depth analysis of                        2007                  2008                  2009
each threat action category.


Malware (38% of breaches, 94% of records)
Malware is any software or code developed for the purpose of compromising or harming information assets without the
owner’s informed consent. It factored into 38% of 2009 cases and 94% of all data lost. When malware is discovered during an
investigation, the IR team often works with ICSA Labs, an independent division of Verizon, to conduct the analysis. Through
this collaboration, investigators are able to better help the customer with containment, removal, and recovery. Malware can
be classified in many ways but we utilize a two-dimensional approach that identifies how it was distributed (infection vector)
and what the malware did (functionality). These characteristics have a direct bearing on preventive measures.

Infection Vectors

Per Figure 18, the most frequent malware infection vector is once again installation or injection by a remote attacker. This is
often accomplished through SQL injection or after the attacker has root access to a system. Both have the troublesome
ability to evade antivirus (AV) software and other traditional detection methods, which has a lot to do with their consistent
place at the top of this list.


                                                              22
Figure 18 . Malware infection vectors by percent of breaches within Malware
      51%                    19%                    9%                     8%                   6%     4%          2%         19%


Installed/Injected     Web/Internet           Web/Internet        Coded into existing  Installed by   E-mail     Network     Unknown
    by remote        (auto-executed/”drive-   (user-executed or     program/script    other malware            propagation
                          by” infection)        downloaded)         (i.e., a logic bomb)
     attacker


The web continues to be a common path of infection. Among web-based malware, we distinguish auto-executed “drive-by
downloads” from those involving user interaction. Many of the latter incorporate a social engineering aspect (“click to clean
your system”). The web installation vector is more opportunistic in nature than the “installed by attacker” variety that usually
targets a pre-selected victim. Once the system is infected, the malware alerts an external agent who will then initiate further
attacks. The web is a popular vector for the simple reason of that’s where the users are. Overly-trusting browsers and users
operating with administrative privileges only add to this popularity.

While not extremely common, we did observe several cases in which malware was coded directly into an existing program
or script. This, of course, requires access to the system but also knowledge of how the code works. Not surprisingly, these
often involve malicious insiders who developed the code or administer the system on which it runs. However, a few very
interesting cases of this type were committed by outsiders. One of these involved an external agent that had access to the
system for over six months. During this time, he studied the input/output process and developed a custom script to siphon
data when new accounts were created.

The rather high percentage of “unknown” in Figure 18 is attributable to many factors. Many times there were no logs,
corrupted evidence, and/or users were unavailable for interview. Occasionally, we see some of the “old school” infections
vectors like e-mail and network propagation. Outside the world of data breaches, these are still alive and well but when
stealth is critical and persistence is the goal, these vectors have less merit.

Malware Functionality

To better capture the intricacies of modern malware, we have defined a more detailed set of functions in the VERIS framework
than in previous years. At a broad level though, malware still serves three basic purposes in data breach scenarios: enable or
prolong access, capture data, or further the attack in some manner.


                                                                                           23
Figure 19 . Malware functionality by percent of breaches within Malware and percent of records


                                      Backdoor
                    (allows remote access/control)                                                            36% / 85%

                       Keylogger / Spyware                                                                    36% / 1%
                   (capture data from user activity)

          Send data to external site/entity                                                           32% / 81%

     Download/Install additional malware                                             15% / <1%

                  Initiate client-side attack                                        15% / 2%
                                     (i.e., XSS, MitB)

          Capture data resident on system                                        13% / 84%
                                   (i.e., cache, disk)

                                  RAM scraper
              (captures data from volatile memory)                               13% / <1%

                       Command & Control                                   11% / <1%
              (listens for and executes commands)

Destroy or corrupt data resident on system                                 11% / <1%

                     Capture data from an
                                                                       9% / 2%
               application/system process
                  System/network utilities                             9% / 83%
                                   (PsTools, Netcat)


          Redirect to another site/address                          8% / <1%

                                 Packet sniffer                 6% / 80%
                      (capture data from network)


           Brute force or dictionary attack                 4% / <1%

                 Infect other systems via
            network propagation (nw worm)                   4% / <1%

  Encrypt or seize data resident on system               2% / <1%

                                        Uknown                         9% / 1%


In terms of enabling access, backdoors were logically atop the list again in 2009 (tied with keyloggers). Backdoors allow
attackers to come and go as they please, install additional malware, wreak havoc on the system, retrieve captured data, and
much more. Their effectiveness is evidenced by the large percentage of data loss involving backdoors.

Criminals are also getting more proficient and prolific in developing methods to capture data. This can be seen in Figure 19,
where many of the functions listed focus on this. Keyloggers and spyware that record user activity were frequent but not
involved in some of the larger cases in 2009. This is quite a change from 2008 where they were associated with over 80% of
data compromised. “Associated” is the operative word here as keyloggers don’t usually steal the bulk of data themselves but
instead are used to gain access to install other types of malware for that purpose (i.e., packet sniffers). When malware captures


                                                                             24
data on the system (13% of cases), it often does so from forms that cache credentials and other sensitive info. Though only
used in some of the smaller cases in 2009, the use of “RAM scrapers” to capture data from a system’s volatile memory,
continues to increase (13%). We refer the reader to our 2009 Supplemental DBIR for more information on this type of
malware. Packet sniffers, while not as common as other varieties of malware, continue to compromise large numbers of
records and are usually a factor in the bigger breaches. Malware that “Captures data from an application/system process” (9%)
is often associated with the “Coded into existing program/script” infection vector discussed above.

The last major grouping of malware encompasses functions that facilitate the attack in some manner. As is evident, malware
often sends data to an external entity (32%). This is sometimes stolen data (like credentials) but is also used to let an attacker
know that a system is compromised. We also observed several cases in which malware was used to perform client-side
attacks such as man-in-the-browser and cross-site scripting. When malware downloads additional code (15%), it is often in
the form of updates or capability extensions. Attackers seem to have an affinity for system and network utilities like PsTools
and Netcat. Though these tools are not inherently malicious, criminals are deploying and using them in that way. To clarify, if
utilities were added to the system by an attacker, they are listed here under malware. If they were already on the system and
were abused as a part of the attack, this would show up under Hacking (i.e., via OS Commanding). It is very interesting to note
that there were no confirmed cases in which malware exploited a system or software vulnerability in 2009 (though it was
suspected based on partial samples that three may have done so).

In terms of malware furthering the attack, our investigations continue to highlight the importance of detecting and responding
to malware quickly. In some incidents, the affected company missed an opportunity to lessen the aftermath of infection by
ignoring or not adequately investigating initial antivirus alerts. Regrettably, those alerts sound less often these days.


HOW DO THEY GET MY DATA OUT?
When malware captures sensitive information, it must then be exfiltrated from (or taken out of) the victim’s environment .
There are two basic ways this happens: either the malware sends it out of the organization or the attacker re-enters the
network to retrieve it . The general rule of thumb is that smaller packets are sent out (i .e ., credentials captured by
keyloggers) while larger hauls of data are retrieved (i .e ., data collected by a packet sniffer) . While any amount of data
leaving the owner’s possession is never a good thing, the act does (or at least can) provide evidence of foul play . It’s a
matter of looking for the right indicators in the right places . We advocate paying attention to what goes out of your
network and what changes take place within your systems . Don’t have any customers or partners in Eastern Europe yet
periodic bursts of traffic are sent there from your networks? What about those ZIP or RAR files that showed up last week
and have been growing steadily ever since? Maybe there’s a perfectly good explanation for these things…but you’ll
never know unless you take steps to identify and verify them .


                                                                 25
Figure 20 . Malware customization over time                                                 Level of malware customization by
by percent of breaches within Malware*                                                      percent of breaches within Malware*
 60%                                                        59%


 50%                                                                        54%
                                                                                                      46%   No customization

 40%


 30%       28%                                                                                        6%    Repacked

                                                                                                      20%   Code modification
 20%                                          24%
                           21%


 10%
                                                                                                      29%   Custom-created

  0%
          2005             2006               2007          2008            2009
                                                                                                               * Verizon caseload only


Malware Customization

We are not so happy to say that the increase in customized malware we reported last year appears not to be a fluke limited
to 2008. 2009 revealed a similar proportion of breaches (54% of those involving malware) and an incredible 97% of the 140+
million records were compromised through customized malware across the Verizon-USSS caseload.

The level of customization apparent in malware varies substantially. Some are simply repackaged versions of existing malware
in order to avoid AV detection. From Figure 20, it is evident that many attackers do not stop there. More often than not in
2009, they altered the code of existing malware or created something entirely new. As an example of modified code, we
observed several instances of RAM scrapers that were
“last year’s models” with a few tweaks like the added               An incredible 97% of the 140+ million records
ability to hide and/or encrypt the output file of
captured data. Over the last two years, custom-created
                                                                         were compromised through customized
code was more prevalent and far more damaging than                   malware across the Verizon-USSS caseload.
lesser forms of customization.

As a defender, it’s hard not to get a little discouraged when examining data about malware. The attackers seem to be
improving in all areas: getting it on the system, making it do what they want, remaining undetected, continually adapting
and evolving, and scoring big for all the above. We are not, however, totally devoid of hope. A major improvement would be
to keep attackers from ever gaining access to the system before they are able to install malware. This, of course, is not without
its own challenges as will be discussed next.


                                                               26
Rp 2010 data-breach-report-en_xg

More Related Content

Similar to Rp 2010 data-breach-report-en_xg

2011 Data Breach Investigations[1]
2011 Data Breach Investigations[1]2011 Data Breach Investigations[1]
2011 Data Breach Investigations[1]ianweed
 
Nominum 2017 Spring Data Revelations Security Report
Nominum 2017 Spring Data Revelations Security ReportNominum 2017 Spring Data Revelations Security Report
Nominum 2017 Spring Data Revelations Security ReportYuriy Yuzifovich
 
Kindsight security labs malware report - Q4 2013
Kindsight security labs malware report - Q4 2013Kindsight security labs malware report - Q4 2013
Kindsight security labs malware report - Q4 2013Bee_Ware
 
Verizon Databreach Report 2009
Verizon Databreach Report 2009Verizon Databreach Report 2009
Verizon Databreach Report 2009Kim Jensen
 
What Every CISO Needs to Know About Cyber Insurance
What Every CISO Needs to Know About Cyber InsuranceWhat Every CISO Needs to Know About Cyber Insurance
What Every CISO Needs to Know About Cyber InsuranceSymantec
 
Feedback Assignment Set 4Great job on this assignment. I know yo.docx
Feedback Assignment Set 4Great job on this assignment. I know yo.docxFeedback Assignment Set 4Great job on this assignment. I know yo.docx
Feedback Assignment Set 4Great job on this assignment. I know yo.docxmglenn3
 
2020-trustwave-global-security-report.pdf
2020-trustwave-global-security-report.pdf2020-trustwave-global-security-report.pdf
2020-trustwave-global-security-report.pdfOscarMauricioHernand9
 
Asymmetric threat 4_paper (1)
Asymmetric threat 4_paper (1)Asymmetric threat 4_paper (1)
Asymmetric threat 4_paper (1)MarioEliseo3
 
Compstat challenges and opportunities
Compstat challenges and opportunitiesCompstat challenges and opportunities
Compstat challenges and opportunitiesFrank Smilda
 
Identifying Special Needs Populations in Hazard Zones
Identifying Special Needs Populations in Hazard ZonesIdentifying Special Needs Populations in Hazard Zones
Identifying Special Needs Populations in Hazard ZonesEsri
 
Identifying Special Needs Populations in Hazard Zones: How to Use Tapestry™ S...
Identifying Special Needs Populations in Hazard Zones: How to Use Tapestry™ S...Identifying Special Needs Populations in Hazard Zones: How to Use Tapestry™ S...
Identifying Special Needs Populations in Hazard Zones: How to Use Tapestry™ S...Esri
 
Motive_Security_Labs_Malware_Report_1H2015
Motive_Security_Labs_Malware_Report_1H2015Motive_Security_Labs_Malware_Report_1H2015
Motive_Security_Labs_Malware_Report_1H2015Gordon Henderson
 
2600 v24 n1 (spring 2007)
2600 v24 n1 (spring 2007)2600 v24 n1 (spring 2007)
2600 v24 n1 (spring 2007)Felipe Prado
 
pentesting
pentestingpentesting
pentestingBobzyn
 
Final 2016 cyber captive survey
Final 2016 cyber captive surveyFinal 2016 cyber captive survey
Final 2016 cyber captive surveyGraeme Cross
 
Fireeye definitive-guide-next-gen-threat-protection-2
Fireeye definitive-guide-next-gen-threat-protection-2Fireeye definitive-guide-next-gen-threat-protection-2
Fireeye definitive-guide-next-gen-threat-protection-2drewz lin
 
Fireeye definitive-guide-next-gen-threat-protection
Fireeye definitive-guide-next-gen-threat-protectionFireeye definitive-guide-next-gen-threat-protection
Fireeye definitive-guide-next-gen-threat-protectionAlex Lim
 

Similar to Rp 2010 data-breach-report-en_xg (20)

2011 Data Breach Investigations[1]
2011 Data Breach Investigations[1]2011 Data Breach Investigations[1]
2011 Data Breach Investigations[1]
 
Nominum 2017 Spring Data Revelations Security Report
Nominum 2017 Spring Data Revelations Security ReportNominum 2017 Spring Data Revelations Security Report
Nominum 2017 Spring Data Revelations Security Report
 
Kindsight security labs malware report - Q4 2013
Kindsight security labs malware report - Q4 2013Kindsight security labs malware report - Q4 2013
Kindsight security labs malware report - Q4 2013
 
Verizon Databreach Report 2009
Verizon Databreach Report 2009Verizon Databreach Report 2009
Verizon Databreach Report 2009
 
2009 Databreach Report
2009 Databreach Report2009 Databreach Report
2009 Databreach Report
 
What Every CISO Needs to Know About Cyber Insurance
What Every CISO Needs to Know About Cyber InsuranceWhat Every CISO Needs to Know About Cyber Insurance
What Every CISO Needs to Know About Cyber Insurance
 
Wisr2011 en
Wisr2011 enWisr2011 en
Wisr2011 en
 
Feedback Assignment Set 4Great job on this assignment. I know yo.docx
Feedback Assignment Set 4Great job on this assignment. I know yo.docxFeedback Assignment Set 4Great job on this assignment. I know yo.docx
Feedback Assignment Set 4Great job on this assignment. I know yo.docx
 
2020-trustwave-global-security-report.pdf
2020-trustwave-global-security-report.pdf2020-trustwave-global-security-report.pdf
2020-trustwave-global-security-report.pdf
 
Asymmetric threat 4_paper (1)
Asymmetric threat 4_paper (1)Asymmetric threat 4_paper (1)
Asymmetric threat 4_paper (1)
 
Compstat challenges and opportunities
Compstat challenges and opportunitiesCompstat challenges and opportunities
Compstat challenges and opportunities
 
Identifying Special Needs Populations in Hazard Zones
Identifying Special Needs Populations in Hazard ZonesIdentifying Special Needs Populations in Hazard Zones
Identifying Special Needs Populations in Hazard Zones
 
Identifying Special Needs Populations in Hazard Zones: How to Use Tapestry™ S...
Identifying Special Needs Populations in Hazard Zones: How to Use Tapestry™ S...Identifying Special Needs Populations in Hazard Zones: How to Use Tapestry™ S...
Identifying Special Needs Populations in Hazard Zones: How to Use Tapestry™ S...
 
Motive_Security_Labs_Malware_Report_1H2015
Motive_Security_Labs_Malware_Report_1H2015Motive_Security_Labs_Malware_Report_1H2015
Motive_Security_Labs_Malware_Report_1H2015
 
2600 v24 n1 (spring 2007)
2600 v24 n1 (spring 2007)2600 v24 n1 (spring 2007)
2600 v24 n1 (spring 2007)
 
pentesting
pentestingpentesting
pentesting
 
Final 2016 cyber captive survey
Final 2016 cyber captive surveyFinal 2016 cyber captive survey
Final 2016 cyber captive survey
 
Rand rr1751
Rand rr1751Rand rr1751
Rand rr1751
 
Fireeye definitive-guide-next-gen-threat-protection-2
Fireeye definitive-guide-next-gen-threat-protection-2Fireeye definitive-guide-next-gen-threat-protection-2
Fireeye definitive-guide-next-gen-threat-protection-2
 
Fireeye definitive-guide-next-gen-threat-protection
Fireeye definitive-guide-next-gen-threat-protectionFireeye definitive-guide-next-gen-threat-protection
Fireeye definitive-guide-next-gen-threat-protection
 

More from GuardEra Access Solutions, Inc.

Valiente Balancing It SecurityCompliance, Complexity & Cost
Valiente Balancing It SecurityCompliance, Complexity & CostValiente Balancing It SecurityCompliance, Complexity & Cost
Valiente Balancing It SecurityCompliance, Complexity & CostGuardEra Access Solutions, Inc.
 

More from GuardEra Access Solutions, Inc. (20)

HIPAA Regs
HIPAA RegsHIPAA Regs
HIPAA Regs
 
HITECH Modifications to HIPAA
HITECH Modifications to HIPAAHITECH Modifications to HIPAA
HITECH Modifications to HIPAA
 
Patrick Notley1
Patrick Notley1Patrick Notley1
Patrick Notley1
 
Awarenesstechnologies Intro Document
Awarenesstechnologies Intro DocumentAwarenesstechnologies Intro Document
Awarenesstechnologies Intro Document
 
Mx Pb En 100929
Mx Pb En 100929Mx Pb En 100929
Mx Pb En 100929
 
Deepwater Horizon
Deepwater HorizonDeepwater Horizon
Deepwater Horizon
 
Cloud Computing Payback
Cloud Computing PaybackCloud Computing Payback
Cloud Computing Payback
 
10844 5415 The Value Of Corporate Secrets
10844 5415 The Value Of Corporate Secrets10844 5415 The Value Of Corporate Secrets
10844 5415 The Value Of Corporate Secrets
 
Security Breach Laws
Security Breach LawsSecurity Breach Laws
Security Breach Laws
 
2010 New Guidelines Hipaa Checklist V1
2010 New Guidelines Hipaa Checklist V12010 New Guidelines Hipaa Checklist V1
2010 New Guidelines Hipaa Checklist V1
 
2010 Hipaa Rules 011310
2010 Hipaa Rules 0113102010 Hipaa Rules 011310
2010 Hipaa Rules 011310
 
Og Disparate It Mgmt Tool Impact Report
Og Disparate It Mgmt Tool Impact ReportOg Disparate It Mgmt Tool Impact Report
Og Disparate It Mgmt Tool Impact Report
 
Accel Ops Brochure0609
Accel Ops Brochure0609Accel Ops Brochure0609
Accel Ops Brochure0609
 
Healthcare Data Security Update
Healthcare Data Security UpdateHealthcare Data Security Update
Healthcare Data Security Update
 
HITECH Act
HITECH ActHITECH Act
HITECH Act
 
EMR Yes- No
EMR Yes- NoEMR Yes- No
EMR Yes- No
 
SourceFire IPS Overview
SourceFire IPS OverviewSourceFire IPS Overview
SourceFire IPS Overview
 
Closing the Clinical IT Chasm
Closing the Clinical IT ChasmClosing the Clinical IT Chasm
Closing the Clinical IT Chasm
 
Valiente Balancing It SecurityCompliance, Complexity & Cost
Valiente Balancing It SecurityCompliance, Complexity & CostValiente Balancing It SecurityCompliance, Complexity & Cost
Valiente Balancing It SecurityCompliance, Complexity & Cost
 
Forrester Healthcare
Forrester HealthcareForrester Healthcare
Forrester Healthcare
 

Rp 2010 data-breach-report-en_xg

  • 1. source: external type: organized criminal group origin: eastern europe AGENT category: hacking type: sql injection; use of stolen credentials path: web application ACTION category: malware type: packet sniffer; backdoor path: installed/injected by remote attacker ASSET type: database server data: payment card data; intellectual property type: integrity; confidentiality ATTRIBUTE 2 010 DATA B R E AC H I N V E S T I G AT I O N S R E P O R T A study conducted by the Verizon RISK Team in cooperation with the United States Secret Service.
  • 2. 2010 Data Breach Investigations Report AUTHORS: TABLE OF CONTENTS Wade Baker Executive Summary . . . . . . . . . . . . . . . . . . . . . . . . . . . . . . . . . . . . . . . . . . . . . . . . . . . . . . . . . . . . . . . 2 Mark Goudie Methodology . . . . . . . . . . . . . . . . . . . . . . . . . . . . . . . . . . . . . . . . . . . . . . . . . . . . . . . . . . . . . . . . . . . . . 4 Alexander Hutton Verizon Data Collection Methodology . . . . . . . . . . . . . . . . . . . . . . . . . . . . . . . . . . . . . . . . . . . 4 C. David Hylender USSS Data Collection Methodology . . . . . . . . . . . . . . . . . . . . . . . . . . . . . . . . . . . . . . . . . . . . . 5 Jelle Niemantsverdriet Cybercrime Year in Review, 2009 . . . . . . . . . . . . . . . . . . . . . . . . . . . . . . . . . . . . . . . . . . . . . . . . . . . 6 Christopher Novak Results and Analysis . . . . . . . . . . . . . . . . . . . . . . . . . . . . . . . . . . . . . . . . . . . . . . . . . . . . . . . . . . . . . . . 7 David Ostertag Demographics . . . . . . . . . . . . . . . . . . . . . . . . . . . . . . . . . . . . . . . . . . . . . . . . . . . . . . . . . . . . . . . . . 8 Christopher Porter Threat Agents . . . . . . . . . . . . . . . . . . . . . . . . . . . . . . . . . . . . . . . . . . . . . . . . . . . . . . . . . . . . . . . . . 11 Mike Rosen Breach Size by Threat Agents . . . . . . . . . . . . . . . . . . . . . . . . . . . . . . . . . . . . . . . . . . . . . . 14 Bryan Sartin External Agents . . . . . . . . . . . . . . . . . . . . . . . . . . . . . . . . . . . . . . . . . . . . . . . . . . . . . . . . . . . 15 Peter Tippett, M.D., Ph.D Internal Agents . . . . . . . . . . . . . . . . . . . . . . . . . . . . . . . . . . . . . . . . . . . . . . . . . . . . . . . . . . . 17 Men and women of the Partner Agents . . . . . . . . . . . . . . . . . . . . . . . . . . . . . . . . . . . . . . . . . . . . . . . . . . . . . . . . . . . 19 United States Secret Service Threat Actions . . . . . . . . . . . . . . . . . . . . . . . . . . . . . . . . . . . . . . . . . . . . . . . . . . . . . . . . . . . . . . . . . 20 Malware . . . . . . . . . . . . . . . . . . . . . . . . . . . . . . . . . . . . . . . . . . . . . . . . . . . . . . . . . . . . . . . . . 22 CONTRIBUTORS: Hacking . . . . . . . . . . . . . . . . . . . . . . . . . . . . . . . . . . . . . . . . . . . . . . . . . . . . . . . . . . . . . . . . . . 27 Social . . . . . . . . . . . . . . . . . . . . . . . . . . . . . . . . . . . . . . . . . . . . . . . . . . . . . . . . . . . . . . . . . . . . 31 Thijs Bosschert Misuse . . . . . . . . . . . . . . . . . . . . . . . . . . . . . . . . . . . . . . . . . . . . . . . . . . . . . . . . . . . . . . . . . . . 33 Eric Brohm Physical . . . . . . . . . . . . . . . . . . . . . . . . . . . . . . . . . . . . . . . . . . . . . . . . . . . . . . . . . . . . . . . . . . 35 Calvin Chang Error . . . . . . . . . . . . . . . . . . . . . . . . . . . . . . . . . . . . . . . . . . . . . . . . . . . . . . . . . . . . . . . . . . . . . 36 Michael Dahn Environmental . . . . . . . . . . . . . . . . . . . . . . . . . . . . . . . . . . . . . . . . . . . . . . . . . . . . . . . . . . . . 37 Ron Dormido Compromised Assets . . . . . . . . . . . . . . . . . . . . . . . . . . . . . . . . . . . . . . . . . . . . . . . . . . . . . . . . . . 37 Ben van Erck Compromised Data . . . . . . . . . . . . . . . . . . . . . . . . . . . . . . . . . . . . . . . . . . . . . . . . . . . . . . . . . . . . 39 Kylee Evans Attack Difficulty . . . . . . . . . . . . . . . . . . . . . . . . . . . . . . . . . . . . . . . . . . . . . . . . . . . . . . . . . . . . . . . 42 Eric Gentry Attack Targeting . . . . . . . . . . . . . . . . . . . . . . . . . . . . . . . . . . . . . . . . . . . . . . . . . . . . . . . . . . . . . . . 43 John Grim Unknown Unknowns . . . . . . . . . . . . . . . . . . . . . . . . . . . . . . . . . . . . . . . . . . . . . . . . . . . . . . . . . . 44 Clarence Hill Timespan of Breach Events . . . . . . . . . . . . . . . . . . . . . . . . . . . . . . . . . . . . . . . . . . . . . . . . . . . . . 46 Adam Kunsemiller Breach Discovery Methods . . . . . . . . . . . . . . . . . . . . . . . . . . . . . . . . . . . . . . . . . . . . . . . . . . . . . 48 Kenny Lee Anti-Forensics . . . . . . . . . . . . . . . . . . . . . . . . . . . . . . . . . . . . . . . . . . . . . . . . . . . . . . . . . . . . . . . . . 52 Wayne Lee PCI DSS Compliance . . . . . . . . . . . . . . . . . . . . . . . . . . . . . . . . . . . . . . . . . . . . . . . . . . . . . . . . . . . 53 Kevin Long Conclusions and Recommendations . . . . . . . . . . . . . . . . . . . . . . . . . . . . . . . . . . . . . . . . . . . . . . 56 Raphael Perelstein Appendices from the United States Secret Service . . . . . . . . . . . . . . . . . . . . . . . . . . . . . . . . . 58 Enrico Telemaque Appendix A: Online Criminal Communities . . . . . . . . . . . . . . . . . . . . . . . . . . . . . . . . . . . . . 58 Denson Todd Appendix B: Prosecuting Cybercrime—The Albert Gonzalez story . . . . . . . . . . . . . . . 62 Yuichi Uzawa About Verizon Investigative Response . . . . . . . . . . . . . . . . . . . . . . . . . . . . . . . . . . . . . . . . . . . . . 63 J. Andrew Valentine About the United States Secret Service . . . . . . . . . . . . . . . . . . . . . . . . . . . . . . . . . . . . . . . . . . . . 63 Nicolas Villatte Matthijs van der Wel Paul Wright For additional updates and commentary, please visit http://securityblog .verizonbusiness .com . SPECIAL THANKS TO: For inquiries directed to the United States Secret Service, contact databreachstudy@usss .dhs .gov . Tracey Beeferman Carl Dismukes Paul Goulding Carole Neal
  • 3. 2010 Data Breach Investigations Report A study conducted by the Verizon Business RISK team in cooperation with the United States Secret Service. Executive Summary In some ways, data breaches have a lot in common with fingerprints. Each is unique and we learn a great deal by analyzing the various patterns, lines, and contours that comprise each one. The main value of fingerprints, however, lies in their ability to identify a particular individual in particular circumstances. In this sense, studying them in bulk offers little additional benefit. On the other hand, the analysis of breaches in aggregate can be of great benefit; the more we study, the more prepared we are to stop them. Not surprisingly, the United States Secret Service (USSS) is also interested in studying and stopping data breaches. This was a driving force in their decision to join us in this 2010 Data Breach Investigations Report. They’ve increased the scope of what we’re able to study dramatically by including a few hundred of their own cases to the mix. Also included are two appendices from the USSS. One delves into online criminal communities and the other focuses on prosecuting cybercrime. We’re grateful for their contributions and believe organizations and individuals around the world will benefit from their efforts. With the addition of Verizon’s 2009 caseload and data contributed from the USSS, the DBIR series now spans six years, 900+ breaches, and over 900 million compromised records. We’ve learned a great deal from this journey and we’re glad to have the opportunity to share these findings with you. As always, our goal is that the data and analysis presented in this report proves helpful to the planning and security efforts of our readers. We begin with a few highlights below. WHO IS BEHIND DATA BREACHES? 70% resulted from external agents (-9%) Including the USSS cases in this year’s report shook things up a bit but didn’t shake our worldview . Driven largely by organized groups, the majority of breaches and almost all data stolen 48% were caused by insiders (+26%) (98%) in 2009 was still the work of criminals outside the victim organization . Insiders, however, were more common in cases 11% implicated business partners (-23%) worked by the USSS, which boosted this figure in the joint dataset considerably . This year’s study has by far improved our 27% involved multiple parties (-12%) visibility into internal crime over any other year . Breaches linked to business partners continued the decline observed in our last report and reached the lowest level since 2004 . HOW DO BREACHES OCCUR? Related to the larger proportion of insiders, Misuse sits atop the list of threat actions leading to breaches in 2009 . That’s not to say 48% involved privilege misuse (+26%) that Hacking and Malware have gone the way of the dinosaurs; they ranked #2 and #3 and were responsible for over 95% of all 40% resulted from hacking (-24%) 38% utilized malware (<>) data comprised . Weak or stolen credentials, SQL injection, and data-capturing, customized malware continue to plague organizations trying to protect information assets . Cases involving the use of social tactics more than doubled and physical attacks like theft, tampering, and surveillance ticked up 28% employed social tactics (+16%) several notches . 15% comprised physical attacks (+6%) 2
  • 4. WHAT COMMONALITIES EXIST? 98% of all data breached came from servers (-1%) As in previous years, nearly all data were breached from servers and applications . This continues to be a defining characteristic 85% of attacks were not considered highly difficult (+2%) between data-at-risk incidents and those involving actual compromise . The proportion of breaches stemming from highly sophisticated attacks remained rather low yet once 61% were discovered by a third party (-8%) again accounted for roughly nine out of ten records lost . In keeping with this finding, we assessed that most breaches 86% of victims had evidence of the breach in their log files could have been avoided without difficult or expensive controls . Yes, hindsight is 20/20 but the lesson holds true; the criminals are not hopelessly ahead in this game . The more we 96% intermediatewere avoidable through simple or of breaches controls (+9%) know, the better we can prepare . Speaking of being prepared, organizations remain sluggish in detecting and responding to incidents . Most breaches are discovered by external parties and only then after a considerable amount of time . 79% compliance to PCI DSS had not achieved of victims subject WHERE SHOULD MITIGATION EFFORTS BE FOCUSED? While we’ve added some new suggestions to the Conclusions and Recommendations section of this report, what you see to the right is similar to the message we’ve been preaching from the beginning . That’s not because we don’t feel like writing another sermon; it’s simply that, based on the data before us, all the points in this one still apply . This study always reminds us that our profession has the necessary tools to get the job done . The challenge for us lies Eliminate unnecessary data; keep tabs on what’s left in selecting the right tools for the job at hand and then not letting them get dull and rusty over time . Evidence shows when that happens, our adversaries are quick to take Ensure essential controls are met advantage of it . Check the above again The amount of breaches that exploit authentication in some manner is a problem . In our last report it was default credentials; this year it’s stolen and/or weak credentials . Test and review web applications Perhaps this is because attackers know most users are over-privileged . Perhaps it’s because they know we don’t Audit user accounts and monitor privileged activity monitor user activity very well . Perhaps it’s just the easiest way in the door . Whatever the reason, we have some work to Filter outbound traffic do here . It doesn’t matter how hardened our defenses are if we can’t distinguish the good guys from the bad guys . Monitor and mine event logs Malware gets increasingly difficult to detect and prevent (especially once the attacker owns the system) . Therefore, protect against the damage malware does after infection, much of which can be mitigated if outbound traffic is restricted . Finally, the value of monitoring (perhaps we should say “mining”) logs cannot be overstated . The signs are there; we just need to get better at recognizing them . 3
  • 5. Methodology It is often said that the role of science is to explain the “how” of things in the natural world. We find it a fitting description and applaud all who study the intricacies of our field in pursuit of greater understanding. In that vein, the 2010 Data Breach Investigations Report (DBIR) marks the third installment (fifth if you count supplemental reports) in our continuing effort to shed light on the “how” of things in the world of computer crime. The collection of data through rigorous observation is, of course, one of the cornerstones of any scientific endeavor. While we like to think our methodology has been rigorous, it cannot be said that it has been entirely consistent. The 2008 DBIR was a retrospective covering four years (2004-2007) of Verizon’s caseload in one massive data collection effort. The scope was large but the level of analysis was somewhat limited due to the passage of time. The shift from historic to ongoing collection for the 2009 DBIR opened the door to more active observation, greater detail, and new areas of study. This Not only does this increase the size of the approach certainly would have worked again for this year’s window of visibility we have into the world report and would have maintained a state of consistency, which is a good trait to have in a methodology. Our ultimate of data breaches but also grants a new goal, however, is not a state of consistency; our ultimate perspective into that world. As will be seen, goal is a state of knowledge. It is to understand and explain our caseloads share many similarities, but the “how.” there are some key differences as well. For this reason, we are shaking things up again by including a completely foreign and very different (yet still very reliable) dataset in the 2010 DBIR. We’re thrilled to welcome the contributions (in data and expertise) of the United States Secret Service (USSS) to this year’s report. Not only does this increase the size of the window of visibility we have into the world of data breaches but also grants a new perspective into that world. As will be seen, our caseloads share many similarities, but there are some key differences as well. Both are instructive and we firmly believe this joint effort will lead us closer to the goal described above. Pulling the two datasets together was quite an undertaking for both parties and the rest of this section will explain how it was accomplished. Verizon Data Collection Methodology The underlying methodology used by Verizon remains unchanged from that of previous years. All results are based on firsthand evidence collected during paid forensic investigations conducted by Verizon from 2004 to 2009. The 2009 caseload is the primary analytical focus of the report, but the entire range of data is referenced extensively throughout. Though the Investigative Response (IR) team works a variety of engagements, only those involving a confirmed breach are included in this data set. To help ensure reliable and consistent input, all investigators use the Verizon Enterprise Risk and Incident Sharing (VERIS) framework to record case data and other relevant details. The information collected using VERIS is then submitted to members of the RISK Intelligence team for further validation and analysis. The aggregate repository of case data is sanitized and contains no information that would enable one to ascertain a client’s identity. 4
  • 6. USSS Data Collection Methodology With all the talk of “shaking things up” above, one might conclude that consistency was tossed out the window in this year’s report. This is not the case. In terms of data collection, the USSS methodology differs little from that of Verizon. For the purposes of this study, the USSS created an internal application based on the VERIS framework. From the thousands of cases 1 worked by the USSS during 2008 and 2009 , the scope was narrowed to only those involving confirmed organizational data 2 breaches in alignment with the focus of the DBIR. The scope was further narrowed to include only cases for which Verizon 3 did not conduct the forensic investigation . Of these cases, a sample was taken and requests to input data were sent to USSS agents who worked each case. In doing so, these agents utilized investigative notes, reports provided by the victim or other forensic firms, and their own experience gained in handling the case. This yielded 257 qualifying cases for which data were collected within the time frame set for this report. The resulting dataset was purged of any information that might identify organizations or individuals involved in the case and then provided to Verizon’s RISK Intelligence team for analysis. In conclusion, we would like to reiterate that we make no claim that the findings of this report are representative of all data breaches in all organizations at all times. Even though the merged Verizon-USSS dataset (presumably) more closely reflects reality than either in isolation, it is still a sample. Although we believe many of the findings presented in this report to be appropriate for generalization (and our confidence in this grows over time), bias undoubtedly exists. Even so, there is a wealth of information here and no shortage of valid and clear takeaways. As with any study, readers will ultimately decide which findings are applicable within their organization. A BRIEF PRIMER ON VERIS VERIS is a framework designed to provide a common language for describing security incidents in a structured and repeatable manner . It takes the narrative of “who did what to what or whom with what result” and translates it into the kind of data you see presented in this report . Because many readers asked about the methodology behind the DBIR and because we hope to facilitate more information sharing on security incidents, we released VERIS earlier this year for free public use . A brief overview of VERIS is available on our website4 and the complete framework can be obtained from the VERIS community wiki5 . Both are good companion references to this report for understanding terminology and context . 1 The scope of data collection for the USSS was 2008 and 2009. However, over 70 cases worked in 2008 pertained to breaches that occurred in 2007. Because this is a large enough sample and allows for three-year trend analysis, we show them separate from 2008 breaches. 2 The USSS works many cases related to theft and fraud that are not included in this report. For instance, crimes committed against consumers that do not involve an organization or its assets are not included. Criminal activities that occur after data are stolen (i.e., “white plastic fraud” and identity theft) are also not within the scope of this study. 3 The USSS is often involved in one manner or another with cases worked by Verizon (especially the larger ones). To eliminate redundancy, these cases were removed from the USSS sample. Where both Verizon and the USSS worked a case, Verizon-contributed data were used. 4 http://www .verizonbusiness .com/resources/whitepapers/wp_verizon-incident-sharing-metrics-framework_en_xg .pdf 5 https://verisframework .wiki .zoho .com/ 5
  • 7. Cybercrime Year in Review, 2009 2009 was, in many ways, a transformational year in the trenches. As attackers and defenders vied for advantage, there were numerous developments on many fronts around the world. It’s difficult to measure who’s winning with any certainty but there are, at least, some measurements available. One of them, public breach disclosures, fell noticeably in 2009. Organizations 6 7 that track disclosed breaches like DataLossDB and the Identity Theft Resource Center reported figures that were well off 2008 totals. Private presentations and hallway conversations with many in the know suggested similar findings. Our own caseload reveals this as well. In a report dedicated to the analysis of annual breach trends, it seems wholly appropriate to reflect on why. It also provides a fitting backdrop for discussing some key 2009 milestones. In our last report, we observed that massive exposures of payment card data in recent years have effectively flooded the market and driven down the prices criminals can get for their stolen wares. 2009, then, may simply be the trough in a natural supply and demand cycle. If supply has outpaced demand, why release more product? Perhaps Perhaps cybercriminals are directing their resources elsewhere until market conditions improve. It is also possible that breaches are occurring at the same rate but the criminals are cybercriminals sitting on stolen data until demand picks up. Because fraud alerts are the leading method of are directing their discovering breaches, it stands to reason that many breaches could occur without anyone resources elsewhere being the wiser if the criminal decided it was in his best interest to be patient. until market Another possible reason for this decline is law enforcement’s effectiveness in capturing the criminals. The prosecution of Albert Gonzalez was a major event in 2009. He and his conditions improve. accomplices were responsible for some of the largest data breaches ever reported. Taking It is also possible them off the streets, so to speak, may have caused a temporary (but we can hope for permanent) dip in breaches. It is also possible that their prosecution made other that breaches are cybercriminals take some time off to reevaluate their priorities in life. occurring at the 2009 witnessed much discussion and consideration around the world about breach same rate but the disclosure laws. As seen in the U.S., the creation of these laws can have a huge effect on criminals are sitting breach statistics. So can the administration of them. Depending on how the legal environment evolves in this area, it could have a significant impact on the number of on stolen data until known breaches worldwide. demand picks up. While it’s highly unlikely that cloud computing or virtualization had anything to do with breach disclosure rates, they were no doubt hot topics in 2009. We continue to search for a link between data breaches and cloud-based or virtualized infrastructure but continue to find none. Finally, we would be remiss if we did not touch on the subject of the hour, Advanced Persistent Threats (APTs). Yes, APTs are real but they are not new. Although the hype has grown exponentially, the post-2010 threat of APTs to your organization is more or less the same as pre-2010 levels. While we do appreciate the business, we would like to save you some expense and heartache: APTs are not the source of all malware infections and suspicious traffic on your network. Don’t get caught up in the hype. Manage your defenses based on reality, not on publicity. We hope this report helps with that. 6 http://datalossdb .org/ 7 http://www .idtheftcenter .org/index .html 6
  • 8. Results and Analysis The Verizon IR team worked over 100 cases in 2009; 57 of them were confirmed breaches. While lower than typical for our caseload, many of these breaches were quite large and complex, often involving numerous parties, interrelated incidents, 8 multiple countries, and many affected assets. The 257 qualified cases in the USSS dataset included 84 cases from 2009, 102 from 2008, and 71 from 2007. The primary dataset analyzed in this report contains the 141 (57 + 84) confirmed breach cases worked by Verizon and the USSS in 2009. The total number of data records compromised across these cases exceeds 143 million. In several places throughout the text, we show and discuss the entire range of data for both organizations (2004-2009 for Verizon, 2007-2009 for the USSS). No small amount of internal discussion took place regarding how best to present statistics on the combined Verizon-USSS dataset. In the end, we decided that its most compelling feature was not simply the ability to compare and contrast Verizon’s cases with those of the USSS but rather the opportunity to study a more representative sample. Therefore, the chosen approach is to present the combined dataset intact and highlight interesting differences (or similarities) within the text where appropriate. There are, however, certain data points that were collected by Verizon but not the USSS; these are identified in the text/figures. As was the case in our last report, about two-thirds of the breaches covered herein have either not yet been disclosed or never will be. Many were related in some manner (i.e., same perpetrators or source IP). So far, almost 15% of Verizon’s 2009 cases led to known arrests while 66% of USSS cases resulted in the arrest of a suspect. Even more impressive is that most of those ended in a conviction. With the addition of Verizon’s 2009 caseload and data contributed from the USSS, the DBIR series now spans six years, 900+ breaches, and over 900 million compromised records. The figures in this report utilize a consistent format. Values shown in dark gray pertain to breaches while values in red pertain to data records. The “breach” is the incident under investigation in a case and “records” refer to the amount of data units (files, card numbers, etc.) compromised in the breach. Figures and tables do not always contain all possible options but only those having a value greater than 0. If you are interested in seeing all options for any particular figure, these can be found in the VERIS framework. Without further delay, we present the investigative findings and analysis of Verizon and the USSS. 8 Refer to the Methodology section for an explanation of the qualification process. 7
  • 9. Demographics Of all sections in this report, demographics always present the greatest challenge for drawing out deeper meaning behind the numbers. While attack trends, incident response metrics, and other results are certainly dependent upon a given year’s caseload, demographic data seem particularly so. Does the fact that we have more/less of a particular industry or region mean it is under increased attack? Is it more vulnerable? Did laws or other environmental factors change? Sheer coincidence? Obviously, it’s difficult to know for certain. Demographic information is helpful, though, in establishing the context for other results. Thus, in this section we will relay the statistics, infer what we can, and let you do the rest. Figure 1 . Industry groups represented by percent of breaches 33% 23% 15% 6% 5% 4% 4% 4% 3% 4% Financial Hospitality Retail Manufacturing Tech Services Business Government Media Healthcare Other Services Services Data breaches continue to occur (in our caseload and elsewhere) within all types of organizations. These are categorized as 9 they have been in previous reports according to the industry groups represented in Figure 1 . Financial Services, Hospitality, and Retail still comprise the “Big Three” of industries affected (33%, 23%, and 15% respectively) in the merged Verizon-USSS dataset, though Tech Services edged out Retail in Verizon’s caseload. That this is consistently true of both the Verizon and USSS caseloads does seem to carry some significance. The targeting of financial organizations is hardly shocking; stealing digital money from information systems rather than vaults is basically just a less primitive form of bank robbery. It represents the nearest approximation to actual cash for the criminal. Also, and perhaps more importantly, financial firms hold large volumes of sensitive consumer data for long periods of time. For this reason (and others), they fall under more stringent regulation and reporting requirements. This, in turn, increases the likelihood that breaches will require criminal and/or forensic investigation. In short, where other industries might be able to “sweep it under the rug,” financial institutions are finding it increasingly difficult to do so. Regardless of the root cause(s), a growing percentage of cases and an astounding 94% of all compromised records in 2009 were attributed to Financial Services. 9 There are some changes in the way we categorize industries in this report. Most notably, “Food and Beverage” has been folded into the “Hospitality” group as this seems to be standard convention. A complete list of industries can be found in the VERIS framework. 8
  • 10. The Hospitality and Retail industries exhibit similar trends when it comes to data Figure 2 . Compromised records by industry group breaches, which has a lot to do with their acceptance of payment cards and use 6% Other Industries of Point of Sale (POS) systems. This tends to draw a certain breed of criminal who favors certain ways and means of attack. There were quite a few public breach disclosures within the Hospitality industry in the last year or so and this spilled over into investigations conducted by Verizon and the USSS. Not surprisingly, restaurants and hotels comprise the bulk of cases in this industry group. Retail, which ranked first in total breaches in our last two reports, has fallen to third place 94% and now accounts for less than half of its former glory (31% in ‘08 down to 14% in Financial Services ‘09). This is not simply a by-product of incorporating USSS data (our own percentage for Retail was an even lower 9%) but we find it hard to attribute much more to these numbers than their face value. For regional trends, it’s worth making a distinction between the USSS and Verizon datasets. The USSS caseload, as one might suspect, is comprised of nearly all breaches that occurred in the United States (though investigating and prosecuting these crimes takes them all around the world). On the other hand, over half of the breaches investigated by Verizon in 2009 occurred outside the U.S. (the “North America” region includes cases from Canada and the Dominican Republic). Countries in which Verizon investigated confirmed and suspected breaches are highlighted in Figure 3. Over the past two years our caseload has consistently grown in Asia-Pacific and Western European countries. It is unclear as to whether our expanded international IR team or changes in global incident trends are most responsible for this but other sources suggest growth in these regions as well. The apparent disparity between the number of known The targeting of financial organizations data breaches in the United States and other parts of the is hardly shocking; stealing digital money globe has led some to conclude that other parts of the world are safer environments for electronic business. We from information systems rather than do not believe this to be the case. The same basic vaults is basically just a less primitive form information and communication technologies are present of bank robbery. It represents the nearest in homes, businesses, and governments all around the world. Admittedly, there are some differences that have an approximation to actual cash for the criminal. impact on cybercrime (the Chip and PIN payment infrastructure is a good example) but these differences are not enough to explain the disparity. The primary reason we hear more about data breaches in the U.S. (and in the report) stems from mandatory disclosure laws. Outside the U.S., breach disclosure differs significantly. Some countries are silent on the matter, others encourage it but don’t require, and some even discourage disclosure. 9
  • 11. Figure 3 . Countries represented Countries in which a breach was confirmed Australia Greece Austria Japan Belgium Luxembourg Canada Netherlands China (mainland Poland and Hong Kong) Spain Dominican Switzerland Republic United Kingdom France United States Germany Countries in which a breach was investigated but not confirmed Bulgaria Singapore Egypt Sweden Italy The bottom line is that where disclosures occur, they often require investigations, which sometimes require external investigators, which, in turn, means breaches are more likely to show up in this study. As in previous years, the majority of cases investigated by Verizon in 2009 have not yet been disclosed and may never be. Only a handful of breaches outside the U.S. were publicly reported. Of those, two did so because they were regional facilities of U.S.-based organizations. Figure 4 shows that, once again, a breakdown of organizational size follows a rather normal-looking distribution. It’s quite possible (and perhaps logical) that an organization’s size matters little in terms of its chances of suffering a data breach. One might speculate that smaller budgets mean less security spending but it probably also means fewer assets to protect and a lower profile. Thieves are more likely to select targets based on the perceived value of the data and cost of attack than victim characteristics such as size. Over half of the breaches investigated by Verizon in 2009 occurred outside the U.S. 10
  • 12. Figure 4 . Organizational size by percent of breaches (number of employees) Over 100,000 2% 10,001 to 100,000 20% 1,001 to 10,000 20% 26% 101 to 1,000 23% 11 to 100 18% 1 to 10 9% Many of our customers express concern about the security ramifications of mergers, acquisitions, and other major organizational changes (perhaps even more so than normal given economic conditions in recent years). This is understandable as these changes bring together not only the people and products of separate organizations but their technology environments as well. Seamless integration of technology, process, and mind-set certainly has its fair share of challenges. Last year, we reported that 13% of our caseload involved organizations that had recently been involved in a merger or acquisition. In 2009 that figure was 9% and another 9% had restructured in some significant way. While nothing can be claimed or inferred directly from these findings, we believe it is well worth watching this metric over time. Threat Agents VERIS Classification Note: If the agent’s role in the breach is limited to Threat agents refer to entities that cause or contribute to an incident. There can be more than a contributory error (see note in the Threat Actions section under Error), one agent involved in any incident and their involvement can be malicious or non-malicious, they would not be included here. For intentional or accidental, direct or indirect. Identifying those responsible for a breach is critical example, if an insider’s unintentional misconfiguration of an application to any forensic investigation, not only for purposes of response and containment, but also for left it vulnerable to attack, the insider would not be considered an agent if creating current and future defensive strategies. Verizon recognizes three primary categories the application were successfully of threat agents—External, Internal, and Partner. breached by another agent. An insider who deliberately steals data External: External threats originate from sources outside the organization and its or whose inappropriate behavior (i.e., policy violations) facilitated the network of partners. Examples include hackers, organized crime groups, and government breach would be considered an agent in the breach. entities, as well as environmental events such as weather and earthquakes. Typically, no trust or privilege is implied for external entities. Internal: Internal threats are those originating from within the organization. This encompasses company executives, employees, independent contractors (i.e., 1099 staff ), and interns, etc., as well as internal infrastructure. Insiders are trusted and privileged (some more than others). Partners: Partners include any third party sharing a business relationship with the organization. This includes suppliers, vendors, hosting providers, outsourced IT support, etc. Some level of trust and privilege is usually implied between business partners. 11
  • 13. Figure 5 . Threat agents (inclusive) by percent of breaches Figure 5 records the distribution of threat agents among breach 70% cases worked by Verizon and the USSS in 2009. Immediately noticeable is a substantial change in the composition of threat agents from previous DBIRs. While these results don’t go so far 62% 10 as to justify the “80% Myth ” they certainly don’t fall in line with 48% the 80/20 external vs. internal ratio that has been a staple of 46% Verizon’s caseload. The percentage of breaches attributed to external agents slid 9% (though 70% is not an historical outlier), insiders more than doubled, and partners represent a mere third of their 2008 level. That’s a lot of change to digest but this 11% section is dedicated to sorting it all out. 10% Essentially, there are three possible explanations for these results: External Internal Partner 1. They reflect changes in Verizon’s caseload Suspected 2. They reflect the addition of USSS caseload 3. They are a product of both 1 & 2 We will start with option 1. Figure 6 shows the distribution of threat agents for breaches worked by Verizon over the last five years. From this, it is clear that the lower proportion of external agents is not due to Verizon’s caseload, as this statistic hit its highest mark ever in 2009. Neither can it explain the rise for insiders in the merged dataset. The percent of breaches involving partners, however, did drop substantially and for the second year in a row. It is unclear whether this is due to increased awareness of third-party security threats, regulatory guidance focusing on vendor management, a shift in criminal strategy, a change in Verizon’s IR clients, all of the above, or none of the above. Whatever the reason(s), we view it as a positive outcome and hope this problem is being reigned in. The changes evident for threat agents in 2009 stem partially from a drop in partners within Verizon’s caseload but mostly from the addition of a materially different USSS dataset. 10 http://taosecurity .blogspot .com/2009/05/insider-threat-myth-documentation .html 12
  • 14. Figure 6 . Threat agents over time by percent of breaches 100% 90% 80% 70% 60% VZ External 50% VZ Internal 40% VZ Partner 30% USSS External 20% 10% USSS Internal 0% USSS Partner 2005 2006 2007 2008 2009 Figure 6 also shows the same information discussed in the preceding paragraph for USSS cases (see dashed lines). Undoubtedly, the changes in Figure 5 are largely due to the inclusion of the USSS caseload, as their results show a strong representation of internal threat agents, comparatively fewer outsiders, and a very low percentage of partner-related breaches. As a law enforcement agency, it would follow that the USSS would have a different perspective on the broader security incident population. For example, an organization suffering a data breach due to the actions of an insider (especially if that insider is part of an easily-identified list of suspects or used simple methods to perpetrate the crime) is more likely to call law enforcement directly. If true, this would reinforce the assertions and findings of some, especially law enforcement agencies, that insiders are a more frequent source of incidents than stats released by external parties like Verizon often show. In addition, it’s also important to consider the impact of disclosure laws on the proportions represented in the various datasets. So, if #1 has some truth to it and #2 is wholly true, then #3 must be the best option. The changes evident for threat agents in 2009 stem partially from a drop in partners within Verizon’s caseload but mostly from the addition of a materially different USSS dataset. As stated in the beginning of this report, our motivation in studying a larger sample is to better understand the biases of our own and to gain a more complete and accurate representation of the entire population of breaches. These results are clearly the product of that larger perspective. 13
  • 15. Figure 7 . Threat agents (exclusive) by percent of breaches Following this discussion, there are a few observations to note regarding Figure 7 which contrasts single and multi- 45% 27% 1% 27% agent breaches. The 27% of cases involving more than one agent is well below the 2008 level of 39%. Though not apparent from the figure itself, most multi-agent breaches worked by Verizon exhibit an external-partner External only Internal only Partner only Multiple agents combination. In most of these, partner assets are compromised by an external agent and used to attack the victim. On the other hand, external-internal is far more common in USSS cases. As will be discussed later in this report, this scenario often involves an outsider soliciting or bribing an employee to embezzle or skim data and/or funds. Partner-internal pairings are rare within both caseloads. Breach Size by Threat Agents Though we do not assert that the full impact of a breach Figure 8 . Compromised records by threat agent, 2009 is limited to the number of records compromised, it is a 138,566,355 2,640,240 130 2,436,297 measurable indicator of it. Analysis around financial losses incurred by breach victims is probably the most requested 11 addition to the DBIR. For various reasons , forensic investigators do not have nearly as much visibility into External only Internal only Partner only Multiple agents this as they have into the immediate details surrounding a breach. We do, however, include metrics for collecting impact data within VERIS and refer interested readers Figure 9 . Compromised records by threat agent, 2004-2009 there for more information. 800,720,651 28,853,827 43,744,573 46,451,904 Figure 8 records the distribution of the 143+ million records compromised across the merged 2009 dataset among threat agents. It looks a great deal like it did in our last DBIR. There is not a linear relationship between External only Internal only Partner only Multiple agents frequency and impact; harm done by external agents far outweighs that done by insiders and partners. This is true for Verizon and for the USSS and true for this year and in years past. To illustrate this point, we present Figure 9 showing the distribution of the over 900 million compromised records in the merged dataset between 2004 and 2009. We could provide commentary to Figure 9, but what could it possibly add? If a chart in this report speaks with more clarity and finality we aren’t sure what it is. We could provide commentary to Figure 9, but what could it possibly add? If a chart in this report speaks with more clarity and finality we aren’t sure what it is. 11 http://securityblog .verizonbusiness .com/2009/04/16/to-dbir-show-me-the-money/ 14
  • 16. External Agents (70% of breaches, 98% of records) Table 1 . Types of external agents by percent of breaches within External Table 1 presents a comparison of the various types of external threat agents identified during 2009 by Verizon and the USSS. The merged Organized criminal group 24% results continue to show that external breaches are largely the work of organized criminals. Banding together allows them to pool resources, Unaffiliated person(s) 21% specialize skills, and distribute the work effort, among other advantages. External system(s) or site 3% Figure 10 demonstrates the effectiveness of this approach. Crime has been a business for a very long time. This is just the same old story played Activist group 2% out on a different (digital) stage. We refer readers to Appendix A for more Former employee 2% information on organized criminal communities. (no longer had access) The large proportion of “unknown” in Table 1 is the result of several factors. Another organization 1% (not partner or competitor) Sometimes the particular type of agent cannot be determined. Sometimes the victim does not wish to spend time or money toward Competitor 1% making this determination. The USSS contains far fewer “unknown” agents Customer 1% due to their role in identifying and prosecuting suspects. (B2C) In terms of the role external agents played in 2009 breaches, 84% Unknown 45% participated directly in the attack. The rest solicited another agent to perpetrate the attack or supported it in some other manner. Scenarios of this are discussed elsewhere in this report. Figure 10 . Percent of compromised records attributed to organized crime Banding together allows criminal groups to pool 15% Other resources, specialize skills, and distribute the work agents effort, among other advantages. Crime has been a business for a very long time. This is just the same 85% Organized old story played out on a different (digital) stage. criminal groups 15
  • 17. Figure 11 . Origin of external agents by percent of breaches within External Pinpointing the geographic origin of these attacks can be problematic, especially when it Europe-East 21% hinges mainly on source IP addresses. (incl. Russia) Americas-North 19% Fortunately, forensic investigators—and especially law enforcement agencies—often Asia-East 18% Europe-West have much more to go on than that. Even if we (incl. Northern and Southern) 10% accept that the IP address that shows up in log Middle East 5% files does not belong to the actual machine of Africa 2% the actual threat agent (i.e., it is a bot controlled Asia-South/Southeast 2% by the agent), it is still informative and Oceania 2% potentially useful for defensive purposes. (Australia, New Zealand, etc.) Unknown 31% Figure 11 shows the regional origin of relevant external attacks. Once again, more breaches originate from East Europe than any other region (although North America and East Asia remain a close #2 and #3). Comparing “type” and “origin” reveals some interesting findings. For instance, most organized criminal groups hail from East Europe, while unidentified and unaffiliated persons often come from East Asia. Finally, it is worthy of mention that within Verizon’s caseload, East Asia rose to the top spot for the first time in 2009. THERE MUST BE SOME MISTAKE—WHERE’S APT? Despite the huge amount of buzz around Advanced Persistent Threats (APT) this year, neither the term nor the concept is new . Due to this attention, we imagine more than one pair of eyes scanned the list of external agent types in search of “APT .” One of the difficulties with APT is that, though it may have an official definition, its use in everyday practice varies widely . By it, some refer strictly to nation-states, some to any highly skilled attacker, some to particularly difficult methods of attacks or their unrelenting nature . We’re not interested in arguing about the definition . We simply want to explain why it is not listed in any figure or table in this report . Rather than identifying an “APT attack,” VERIS classifies threat agents and their actions in a descriptive manner . If interested, you can see glimpses of “APT-ish elements” throughout this report . Look at the types and origins of external agents (note the absence of the “government” category that is an available option in VERIS), examine the types and vectors of threat actions, read our assessments of attack difficulty, notice the length of time that passes from compromise to discovery, and check out the anti-forensics section . These areas might not be stamped with the acronym “APT” but we do believe them to “apt-ly” describe breaches investigated by Verizon and the USSS in 2009 . 16
  • 18. Internal Agents (48% of breaches, 3% of records) Figure 12 . Role of internal agents by percent of breaches Of cases involving internal threat agents in 2009, investigators determined 90% were within Internal the result of deliberate and malicious activity. This finding does not mean that insiders 4% Unintentional never unintentionally contribute to breaches; they very often do. As discussed earlier, 6% Inappropriate our method of classification does not consider insiders to be an active part of the event chain if their role is limited to contributory error. Inappropriate actions include policy violations and other questionable behavior that, while not overtly malicious, can still result in harm to information assets. Not only can inappropriate behavior contribute directly to a breach, but it may also be an ill omen of what’s to come. Over time investigators have noticed that employees who commit data theft were often cited in the past for other “minor” forms of misuse (or evidence of it was found and 90% Deliberate brought to light during the investigation). Recently, many have hypothesized that insider crime would rise due to financial strain imposed by global economic conditions. Hard times breed hard crimes as they say. It is entirely possible that this is occurring, but neither the Verizon nor USSS caseload show evidence of it. As seen back in Figure 6, Verizon shows a flat trend for insiders and the USSS shows a downward trend over the last three years. Nevertheless, it is a logical hypothesis and worthy of further study. Analyzing the types of insiders behind breaches yields a great deal of practical information. Each of the types listed in Table 2 represent a certain inherent mix of skills, duties, privileges, etc., all of Recently, many have which speak to the capabilities and hypothesized that insider crime resources of that agent and the safeguards most relevant to them. Traditionally, we have seen a large and fairly even proportion of system/ would rise due to financial network administrators to regular users with a few other types mixed in strain imposed by global occasionally. 2009 results are substantially different and, no surprise, this is largely due to USSS data. Specifically, it is related to the types of internal economic conditions. Hard crime investigated by the USSS (see the Misuse section under Threat times breed hard crimes as they Actions for a more detailed discussion). As a result, regular employees say. It is entirely possible that were responsible for a much larger share (51%) of breaches. These cases typically involved bank tellers, retail cashiers, and other similar personnel this is occurring, but neither taking advantage of their everyday job duties to skim, embezzle, or the Verizon nor USSS caseload otherwise steal data from their employers. show evidence of it. 17
  • 19. Finance and accounting staff are similar to regular employees in terms Table 2 . Types of internal agents by percent of breaches within Internal of IT privileges but we differentiate them due to the higher privileges of another sort. Their oversight and management of accounts, records, Regular employee/end-user 51% and finances affords them great propensity for harm. Executives are in a similar position. Though outside the scope of this study, devious acts Finance/accounting staff 12% committed by such employees have caused far more damage to System/network administrator 12% businesses than IT-related incidents. While it is clear that pulling off an inside job doesn’t require elevated Executive/upper management 7% privileges, evidence consistently supports that they do facilitate the Helpdesk staff 4% bigger ones. Overall, insiders were not responsible for a large share of compromised records but system and network administrators nabbed Software developer 3% most of those that were. This finding is not surprising since higher privileges offer greater opportunity for abuse. In general, we find that Auditor 1% employees are granted more privileges than they need to perform their job duties and the activities of those that do require higher Unknown 9% privileges are usually not monitored in any real way. It is worth noting that while executives and upper management were not responsible for many breaches, IP and other sensitive corporate information was usually the intended target when they were. These acts were often committed after their resignation or termination. Speaking of that, across all types of internal agents and crimes, we found that 24% was perpetrated by employees who recently underwent some kind of job change. Half of those had been fired, some had resigned, some were newly hired, and a few changed roles within the organization. With respect to breaches caused by recently terminated employees, we observed the same scenarios we have in the past: 1) the employee’s accounts were not disabled in a timely manner, and 2) the employee was allowed to “finish the day” as usual after being notified of termination. This obviously speaks to the need for termination plans that are timely and encompass all areas of access (decommissioning accounts, disabling privileges, escorting terminated employees, forensic analysis of systems, etc.). THE SLIPPERY SLOPE OF INSIDER MISCONDUCT Verizon investigated a case in which a recently terminated system administrator stole sensitive data from his former employer as well as personal information belonging to its customers . He then attempted to blackmail the organization and threatened to go public with the information if they did not meet his demands . Obviously, not a good situation but what makes it worse is that it might have been avoided with a few changes in policy and practice . On several occasions in the past, this employee had been cited for IT policy violations and inappropriate behavior . There were harassment complaints against him filed by other employees . Finally, when he stole a co-worker’s password for a popular social networking site and modified it with slanderous content, he was let go . Unfortunately, his generic administrative account was given to his successor with a minor password change (i .e ., “Password2” instead of “Password1”) and we’ve already covered what happened after that . 18
  • 20. Partner Agents (11% of breaches, 1% of records) Figure 13 . Role of partner agents by number of breaches As discussed already, partner-related breaches are down in comparison to previous years. within Partner When partners are a factor, the Verizon and USSS cases have differing perspectives as to 1 Unintentional their role. Verizon’s findings continue to show that the majority of breaches involving partners are the result of third-party information assets and accounts being “hijacked” by another agent and then used to attack victims. This frequently involves a remote access connection into the victim’s systems. If compromised, the malicious agent’s actions 6 Deliberate would appear to come from a trusted source and therefore be even more difficult to detect and prevent. Poor partner security practices usually allow or worsen these attacks. Organizations that outsource their IT management and support also outsource a great deal of trust to these partners. In the end, what we said last year 8 remains true; poor governance, lax security, and too Another agent via partner much trust is often the rule of the day. Outsourcing should not mean “Out of sight, out of mind.” The USSS caseload, on the other Table 3 . Types of partner agents by number hand, shows most partner of breaches within Partner breaches stem from the deliberate and malicious actions of that partner. An example of this Remote IT management/support 7 might be a third-party system administrator who maliciously misuses Data processing and analysis 1 her access to steal data from the victim. We believe that the merged data set balances these two extremes to arrive at the ratio shown here. Hosting provider 1 The types of partners in each dataset parallel the differences described Onsite IT management/support 1 above. Partners that manage systems are by far the most common offenders, whether their role is accidental or deliberate. Assets often Security services/consulting 1 involved in these breaches are point-of-sale systems within the hospitality and retail industries. Organizations that outsource their IT management Shipping/logistics provider 1 and support also outsource a great deal of trust to these partners. In the end, what we said last year remains true; poor governance, lax security, Unknown 3 and too much trust is often the rule of the day. Outsourcing should not mean “Out of sight, out of mind.” 19
  • 21. Threat Actions Threat actions describe what the threat agent did to cause or contribute to the breach. There are usually multiple actions across multiple categories during a breach scenario. Verizon uses seven primary categories of threat actions, which are depicted in Figure 14 along with the percent of breaches and compromised records associated with each. Figure 14 . Threat action categories by percent of breaches and records Malware 38% / 94% Hacking 40% / 96% Social 28% / 3% Misuse 48% / 3% Physical 15% / 1% Error 2% / 0% Environmental 0% / 0% As with the findings for threat agents, we imagine Figure 14 raises some eyebrows among those familiar with previous versions of this report. Before going any further, we’d like to direct attention to Figure 15 to see if we can turn some of those raised eyebrows into head nods and an “ah-ha” or two. In the 2008 Supplemental DBIR, we presented all the same basic statistics as in the original report except sliced up by industry. Figure 15 shows the prevalence of threat actions in Financial Services from that report. Though by no means a mirror image of Figure 14, it does demonstrate that a dataset containing a large proportion of financial organizations will exhibit a more “balanced” mix of threat actions and higher values in the Misuse and Social categories. On the other hand, the Retail and Hospitality industries are very lopsided toward Hacking and Malware. Therefore, Figure 14 is not a new trend or sudden change in the threat environment. It aligns perfectly well with what we would expect of a merged Verizon-USSS dataset that contains a higher-than-normal proportion of financial organizations. This is quite a sobering statistic but one that adds yet another chapter to a story we already know: In the big breaches, the attacker hacks into the victim’s network (usually by exploiting some mistake or weakness) and installs malware on systems to collect (lots of) data. That the USSS cases tell the same story certainly makes it more compelling though. 20
  • 22. Figure 15 . Flashback: Threat action categories by percent of breaches in Financial Services as shown in the 2008 Supplemental DBIR Malware 23% Hacking 26% 2008 Supplemental DBIR Social Misuse 32% 42% Physical 16% Error 6% Environmental 0% Though less prevalent than in previous reports, Hacking and Malware are even more dominant than normal with respect to compromised records. This is quite a sobering statistic but one that adds yet another chapter to a story we already know: In the big breaches, the attacker hacks into the victim’s network (usually by exploiting some mistake or weakness) and installs malware on systems to collect (lots of ) data. That the USSS cases tell the same story certainly makes it more compelling though. Figure 16 . Threat action categories over time by percent of breaches (Verizon cases) 80% 70% Malware 60% Hacking 50% Social 40% Misuse 30% Physical 20% 10% Error 0% Environmental 2005 2006 2007 2008 2009 21
  • 23. Those wishing to compare 2009 Figure 17 . Threat actions over time by percent of breaches (USSS cases) results to previous years for 100% Verizon’s caseload can do so in Figure 16. Another version of the 90% same chart is provided for the three 80% years for which we have data from 70% Malware the USSS (Figure 17). The most 60% noticeable change in 2009 among Hacking breaches worked by Verizon was a 50% Social substantial upswing in malware. For 40% Misuse the most part, USSS trends held 30% steady, with Social and Misuse Physical 20% showing some growth while 10% Error Hacking and Malware declined slightly. The following sections 0% Environmental provide a more in-depth analysis of 2007 2008 2009 each threat action category. Malware (38% of breaches, 94% of records) Malware is any software or code developed for the purpose of compromising or harming information assets without the owner’s informed consent. It factored into 38% of 2009 cases and 94% of all data lost. When malware is discovered during an investigation, the IR team often works with ICSA Labs, an independent division of Verizon, to conduct the analysis. Through this collaboration, investigators are able to better help the customer with containment, removal, and recovery. Malware can be classified in many ways but we utilize a two-dimensional approach that identifies how it was distributed (infection vector) and what the malware did (functionality). These characteristics have a direct bearing on preventive measures. Infection Vectors Per Figure 18, the most frequent malware infection vector is once again installation or injection by a remote attacker. This is often accomplished through SQL injection or after the attacker has root access to a system. Both have the troublesome ability to evade antivirus (AV) software and other traditional detection methods, which has a lot to do with their consistent place at the top of this list. 22
  • 24. Figure 18 . Malware infection vectors by percent of breaches within Malware 51% 19% 9% 8% 6% 4% 2% 19% Installed/Injected Web/Internet Web/Internet Coded into existing Installed by E-mail Network Unknown by remote (auto-executed/”drive- (user-executed or program/script other malware propagation by” infection) downloaded) (i.e., a logic bomb) attacker The web continues to be a common path of infection. Among web-based malware, we distinguish auto-executed “drive-by downloads” from those involving user interaction. Many of the latter incorporate a social engineering aspect (“click to clean your system”). The web installation vector is more opportunistic in nature than the “installed by attacker” variety that usually targets a pre-selected victim. Once the system is infected, the malware alerts an external agent who will then initiate further attacks. The web is a popular vector for the simple reason of that’s where the users are. Overly-trusting browsers and users operating with administrative privileges only add to this popularity. While not extremely common, we did observe several cases in which malware was coded directly into an existing program or script. This, of course, requires access to the system but also knowledge of how the code works. Not surprisingly, these often involve malicious insiders who developed the code or administer the system on which it runs. However, a few very interesting cases of this type were committed by outsiders. One of these involved an external agent that had access to the system for over six months. During this time, he studied the input/output process and developed a custom script to siphon data when new accounts were created. The rather high percentage of “unknown” in Figure 18 is attributable to many factors. Many times there were no logs, corrupted evidence, and/or users were unavailable for interview. Occasionally, we see some of the “old school” infections vectors like e-mail and network propagation. Outside the world of data breaches, these are still alive and well but when stealth is critical and persistence is the goal, these vectors have less merit. Malware Functionality To better capture the intricacies of modern malware, we have defined a more detailed set of functions in the VERIS framework than in previous years. At a broad level though, malware still serves three basic purposes in data breach scenarios: enable or prolong access, capture data, or further the attack in some manner. 23
  • 25. Figure 19 . Malware functionality by percent of breaches within Malware and percent of records Backdoor (allows remote access/control) 36% / 85% Keylogger / Spyware 36% / 1% (capture data from user activity) Send data to external site/entity 32% / 81% Download/Install additional malware 15% / <1% Initiate client-side attack 15% / 2% (i.e., XSS, MitB) Capture data resident on system 13% / 84% (i.e., cache, disk) RAM scraper (captures data from volatile memory) 13% / <1% Command & Control 11% / <1% (listens for and executes commands) Destroy or corrupt data resident on system 11% / <1% Capture data from an 9% / 2% application/system process System/network utilities 9% / 83% (PsTools, Netcat) Redirect to another site/address 8% / <1% Packet sniffer 6% / 80% (capture data from network) Brute force or dictionary attack 4% / <1% Infect other systems via network propagation (nw worm) 4% / <1% Encrypt or seize data resident on system 2% / <1% Uknown 9% / 1% In terms of enabling access, backdoors were logically atop the list again in 2009 (tied with keyloggers). Backdoors allow attackers to come and go as they please, install additional malware, wreak havoc on the system, retrieve captured data, and much more. Their effectiveness is evidenced by the large percentage of data loss involving backdoors. Criminals are also getting more proficient and prolific in developing methods to capture data. This can be seen in Figure 19, where many of the functions listed focus on this. Keyloggers and spyware that record user activity were frequent but not involved in some of the larger cases in 2009. This is quite a change from 2008 where they were associated with over 80% of data compromised. “Associated” is the operative word here as keyloggers don’t usually steal the bulk of data themselves but instead are used to gain access to install other types of malware for that purpose (i.e., packet sniffers). When malware captures 24
  • 26. data on the system (13% of cases), it often does so from forms that cache credentials and other sensitive info. Though only used in some of the smaller cases in 2009, the use of “RAM scrapers” to capture data from a system’s volatile memory, continues to increase (13%). We refer the reader to our 2009 Supplemental DBIR for more information on this type of malware. Packet sniffers, while not as common as other varieties of malware, continue to compromise large numbers of records and are usually a factor in the bigger breaches. Malware that “Captures data from an application/system process” (9%) is often associated with the “Coded into existing program/script” infection vector discussed above. The last major grouping of malware encompasses functions that facilitate the attack in some manner. As is evident, malware often sends data to an external entity (32%). This is sometimes stolen data (like credentials) but is also used to let an attacker know that a system is compromised. We also observed several cases in which malware was used to perform client-side attacks such as man-in-the-browser and cross-site scripting. When malware downloads additional code (15%), it is often in the form of updates or capability extensions. Attackers seem to have an affinity for system and network utilities like PsTools and Netcat. Though these tools are not inherently malicious, criminals are deploying and using them in that way. To clarify, if utilities were added to the system by an attacker, they are listed here under malware. If they were already on the system and were abused as a part of the attack, this would show up under Hacking (i.e., via OS Commanding). It is very interesting to note that there were no confirmed cases in which malware exploited a system or software vulnerability in 2009 (though it was suspected based on partial samples that three may have done so). In terms of malware furthering the attack, our investigations continue to highlight the importance of detecting and responding to malware quickly. In some incidents, the affected company missed an opportunity to lessen the aftermath of infection by ignoring or not adequately investigating initial antivirus alerts. Regrettably, those alerts sound less often these days. HOW DO THEY GET MY DATA OUT? When malware captures sensitive information, it must then be exfiltrated from (or taken out of) the victim’s environment . There are two basic ways this happens: either the malware sends it out of the organization or the attacker re-enters the network to retrieve it . The general rule of thumb is that smaller packets are sent out (i .e ., credentials captured by keyloggers) while larger hauls of data are retrieved (i .e ., data collected by a packet sniffer) . While any amount of data leaving the owner’s possession is never a good thing, the act does (or at least can) provide evidence of foul play . It’s a matter of looking for the right indicators in the right places . We advocate paying attention to what goes out of your network and what changes take place within your systems . Don’t have any customers or partners in Eastern Europe yet periodic bursts of traffic are sent there from your networks? What about those ZIP or RAR files that showed up last week and have been growing steadily ever since? Maybe there’s a perfectly good explanation for these things…but you’ll never know unless you take steps to identify and verify them . 25
  • 27. Figure 20 . Malware customization over time Level of malware customization by by percent of breaches within Malware* percent of breaches within Malware* 60% 59% 50% 54% 46% No customization 40% 30% 28% 6% Repacked 20% Code modification 20% 24% 21% 10% 29% Custom-created 0% 2005 2006 2007 2008 2009 * Verizon caseload only Malware Customization We are not so happy to say that the increase in customized malware we reported last year appears not to be a fluke limited to 2008. 2009 revealed a similar proportion of breaches (54% of those involving malware) and an incredible 97% of the 140+ million records were compromised through customized malware across the Verizon-USSS caseload. The level of customization apparent in malware varies substantially. Some are simply repackaged versions of existing malware in order to avoid AV detection. From Figure 20, it is evident that many attackers do not stop there. More often than not in 2009, they altered the code of existing malware or created something entirely new. As an example of modified code, we observed several instances of RAM scrapers that were “last year’s models” with a few tweaks like the added An incredible 97% of the 140+ million records ability to hide and/or encrypt the output file of captured data. Over the last two years, custom-created were compromised through customized code was more prevalent and far more damaging than malware across the Verizon-USSS caseload. lesser forms of customization. As a defender, it’s hard not to get a little discouraged when examining data about malware. The attackers seem to be improving in all areas: getting it on the system, making it do what they want, remaining undetected, continually adapting and evolving, and scoring big for all the above. We are not, however, totally devoid of hope. A major improvement would be to keep attackers from ever gaining access to the system before they are able to install malware. This, of course, is not without its own challenges as will be discussed next. 26