SlideShare ist ein Scribd-Unternehmen logo
1 von 4
Name _______________________________              Date ____________________
Mrs. Labuski & Mrs. Rooney Period ____            Lesson 6-5 Frequency Tables &
                                                       Histograms


VOCABULARY              DEFINITION                       EXAMPLE
                        Tells the
                    number of times                    TYPES OF FRUIT
 FREQUENCY
   TABLE                an event,              Fruit      Frequency
                                                                      Cumulative
                      category, or                                    Frequency

                      group occurs             apple           5             5
                      This column             banana           4             9
CUMULATIVE          shows a running
FREQUENCY              total of all         strawberry         2         11
                      frequencies.
Mr. Allen said that his students could choose one day a week to not have homework
assigned. He recorded their votes in the box below.


Make a tally table to organize         Use your tally table from Exercise 1 to
the data.                              make a cumulative frequency table.
                                                                   Cumulative
Tally Table for Homework Votes             Day         Frequency
                                                                    Frequency
Monday                             Monday               4            4
Tuesday                               Tuesday            2             6
Wednesday                             Wednesday          2             8
Thursday                               Thursday           1             9
Friday                             Friday          6              15
Which day got the most votes?              How many students voted in all?
_____Friday________________                ___________15_____________
Students listed the number of days they spent on vacation in one year.
Make a tally table with intervals of 5.

                           2, 18, 5, 15, 7, 10, 1, 10, 4, 16,
                              7, 11, 17, 3, 8, 14, 13, 10

                            Number of Vacation Days
                               1-5     
                              6-10      
                             11-15     
                             16-20     


                    A bar graph that
                       shows the                 1. Choose an appropriate scale and
                    number of data                             interval.
 HISTOGRAM                                      2. Draw a bar for the number of days
                    itmes that occur                       in each interval.
                      within each               3. Title the graph and label the axes.
                        interval

                   Number of Days spent on Vacation in one Year
               7
               6
               5
               4
               3
               2
               1
               0
                         1-5      6-10     11-15    16-20
                               Number of Vacation Days
Name _______________________________              Date ____________________
Mrs. Labuski & Mrs. Rooney Period ____            Lesson 6-5 Frequency Tables &
                                                       Histograms


VOCABULARY              DEFINITION                       EXAMPLE

                                                       TYPES OF FRUIT
 FREQUENCY
   TABLE                                                             Cumulative
                                               Fruit     Frequency
                                                                     Frequency


CUMULATIVE
FREQUENCY


Mr. Allen said that his students could choose one day a week to not have homework
assigned. He recorded their votes in the box below.


Make a tally table to organize         Use your tally table from Exercise 1 to
the data.                              make a cumulative frequency table.
                                                                   Cumulative
Tally Table for Homework Votes             Day         Frequency
                                                                    Frequency
Monday                                 Monday
Tuesday                                 Tuesday
Wednesday                               Wednesday
Thursday                                Thursday
Friday                                  Friday
Which day got the most votes?              How many students voted in all?
________________________                   ________________________
Students listed the number of days they spent on vacation in one year.
Make a tally table with intervals of 5.

                          2, 18, 5, 15, 7, 10, 1, 10, 4, 16,
                             7, 11, 17, 3, 8, 14, 13, 10


                                                 1. Choose an appropriate scale and
                                                               interval.
 HISTOGRAM                                      2. Draw a bar for the number of days
                                                           in each interval.
                                                3. Title the graph and label the axes.

Weitere ähnliche Inhalte

Ähnlich wie Lesson 6 5 frequency tables & histograms

Unit 12 lesson 3 frequency tables & histograms
Unit 12 lesson 3 frequency tables & histogramsUnit 12 lesson 3 frequency tables & histograms
Unit 12 lesson 3 frequency tables & histogramsmlabuski
 
6th Grade Independent Reading Sheet
6th Grade Independent Reading Sheet6th Grade Independent Reading Sheet
6th Grade Independent Reading Sheetepfund
 
Me write an exam ucr-wb
Me write an exam ucr-wbMe write an exam ucr-wb
Me write an exam ucr-wbJoAnn MIller
 
5th Grade Independent Reading Sheet
5th Grade Independent Reading Sheet5th Grade Independent Reading Sheet
5th Grade Independent Reading Sheetepfund
 
G6 m1-b-lesson 9-t
G6 m1-b-lesson 9-tG6 m1-b-lesson 9-t
G6 m1-b-lesson 9-tmlabuski
 
(7) Lesson 4.3 - Add and Subtract Like Fractions
(7) Lesson 4.3 - Add and Subtract Like Fractions(7) Lesson 4.3 - Add and Subtract Like Fractions
(7) Lesson 4.3 - Add and Subtract Like Fractionswzuri
 
Modulo octavo ingles 8
Modulo octavo ingles 8Modulo octavo ingles 8
Modulo octavo ingles 8raphot
 

Ähnlich wie Lesson 6 5 frequency tables & histograms (10)

Unit 12 lesson 3 frequency tables & histograms
Unit 12 lesson 3 frequency tables & histogramsUnit 12 lesson 3 frequency tables & histograms
Unit 12 lesson 3 frequency tables & histograms
 
6th Grade Independent Reading Sheet
6th Grade Independent Reading Sheet6th Grade Independent Reading Sheet
6th Grade Independent Reading Sheet
 
Me write an exam ucr-wb
Me write an exam ucr-wbMe write an exam ucr-wb
Me write an exam ucr-wb
 
Test corrections
Test correctionsTest corrections
Test corrections
 
Data forms CSEFEL
Data forms CSEFELData forms CSEFEL
Data forms CSEFEL
 
5th Grade Independent Reading Sheet
5th Grade Independent Reading Sheet5th Grade Independent Reading Sheet
5th Grade Independent Reading Sheet
 
G6 m1-b-lesson 9-t
G6 m1-b-lesson 9-tG6 m1-b-lesson 9-t
G6 m1-b-lesson 9-t
 
Final.l1 dec2012
Final.l1 dec2012Final.l1 dec2012
Final.l1 dec2012
 
(7) Lesson 4.3 - Add and Subtract Like Fractions
(7) Lesson 4.3 - Add and Subtract Like Fractions(7) Lesson 4.3 - Add and Subtract Like Fractions
(7) Lesson 4.3 - Add and Subtract Like Fractions
 
Modulo octavo ingles 8
Modulo octavo ingles 8Modulo octavo ingles 8
Modulo octavo ingles 8
 

Mehr von mlabuski

Quiz week 1 & 2 study guide
Quiz week 1 & 2 study guideQuiz week 1 & 2 study guide
Quiz week 1 & 2 study guidemlabuski
 
Quiz week 1 & 2 practice
Quiz week 1 & 2 practiceQuiz week 1 & 2 practice
Quiz week 1 & 2 practicemlabuski
 
Welcome to social studies
Welcome to social studiesWelcome to social studies
Welcome to social studiesmlabuski
 
Team orion supply list 15 16
Team orion supply list 15 16Team orion supply list 15 16
Team orion supply list 15 16mlabuski
 
Literature letter graphic organizer
Literature letter graphic organizerLiterature letter graphic organizer
Literature letter graphic organizermlabuski
 
Team orion supply list 15 16
Team orion supply list 15 16Team orion supply list 15 16
Team orion supply list 15 16mlabuski
 
Literature letters revised
Literature letters revisedLiterature letters revised
Literature letters revisedmlabuski
 
Final exam review sheet # 2 2015
Final exam review sheet # 2 2015Final exam review sheet # 2 2015
Final exam review sheet # 2 2015mlabuski
 
Final exam review sheet # 3 2015
Final exam review sheet # 3 2015Final exam review sheet # 3 2015
Final exam review sheet # 3 2015mlabuski
 
Final exam review sheet # 1 2015
Final exam review sheet # 1 2015Final exam review sheet # 1 2015
Final exam review sheet # 1 2015mlabuski
 
Lessons 12 13 merged
Lessons 12 13 mergedLessons 12 13 merged
Lessons 12 13 mergedmlabuski
 
Mod 5 lesson 12 13
Mod 5 lesson 12 13Mod 5 lesson 12 13
Mod 5 lesson 12 13mlabuski
 
G6 m5-c-lesson 13-t
G6 m5-c-lesson 13-tG6 m5-c-lesson 13-t
G6 m5-c-lesson 13-tmlabuski
 
G6 m5-c-lesson 13-s
G6 m5-c-lesson 13-sG6 m5-c-lesson 13-s
G6 m5-c-lesson 13-smlabuski
 
G6 m5-c-lesson 12-t
G6 m5-c-lesson 12-tG6 m5-c-lesson 12-t
G6 m5-c-lesson 12-tmlabuski
 
G6 m5-c-lesson 12-s
G6 m5-c-lesson 12-sG6 m5-c-lesson 12-s
G6 m5-c-lesson 12-smlabuski
 
Mod 5 lesson 9
Mod 5 lesson 9Mod 5 lesson 9
Mod 5 lesson 9mlabuski
 
G6 m5-b-lesson 9-t
G6 m5-b-lesson 9-tG6 m5-b-lesson 9-t
G6 m5-b-lesson 9-tmlabuski
 
G6 m5-b-lesson 9-s
G6 m5-b-lesson 9-sG6 m5-b-lesson 9-s
G6 m5-b-lesson 9-smlabuski
 
Mod 5 lesson 8
Mod 5 lesson 8Mod 5 lesson 8
Mod 5 lesson 8mlabuski
 

Mehr von mlabuski (20)

Quiz week 1 & 2 study guide
Quiz week 1 & 2 study guideQuiz week 1 & 2 study guide
Quiz week 1 & 2 study guide
 
Quiz week 1 & 2 practice
Quiz week 1 & 2 practiceQuiz week 1 & 2 practice
Quiz week 1 & 2 practice
 
Welcome to social studies
Welcome to social studiesWelcome to social studies
Welcome to social studies
 
Team orion supply list 15 16
Team orion supply list 15 16Team orion supply list 15 16
Team orion supply list 15 16
 
Literature letter graphic organizer
Literature letter graphic organizerLiterature letter graphic organizer
Literature letter graphic organizer
 
Team orion supply list 15 16
Team orion supply list 15 16Team orion supply list 15 16
Team orion supply list 15 16
 
Literature letters revised
Literature letters revisedLiterature letters revised
Literature letters revised
 
Final exam review sheet # 2 2015
Final exam review sheet # 2 2015Final exam review sheet # 2 2015
Final exam review sheet # 2 2015
 
Final exam review sheet # 3 2015
Final exam review sheet # 3 2015Final exam review sheet # 3 2015
Final exam review sheet # 3 2015
 
Final exam review sheet # 1 2015
Final exam review sheet # 1 2015Final exam review sheet # 1 2015
Final exam review sheet # 1 2015
 
Lessons 12 13 merged
Lessons 12 13 mergedLessons 12 13 merged
Lessons 12 13 merged
 
Mod 5 lesson 12 13
Mod 5 lesson 12 13Mod 5 lesson 12 13
Mod 5 lesson 12 13
 
G6 m5-c-lesson 13-t
G6 m5-c-lesson 13-tG6 m5-c-lesson 13-t
G6 m5-c-lesson 13-t
 
G6 m5-c-lesson 13-s
G6 m5-c-lesson 13-sG6 m5-c-lesson 13-s
G6 m5-c-lesson 13-s
 
G6 m5-c-lesson 12-t
G6 m5-c-lesson 12-tG6 m5-c-lesson 12-t
G6 m5-c-lesson 12-t
 
G6 m5-c-lesson 12-s
G6 m5-c-lesson 12-sG6 m5-c-lesson 12-s
G6 m5-c-lesson 12-s
 
Mod 5 lesson 9
Mod 5 lesson 9Mod 5 lesson 9
Mod 5 lesson 9
 
G6 m5-b-lesson 9-t
G6 m5-b-lesson 9-tG6 m5-b-lesson 9-t
G6 m5-b-lesson 9-t
 
G6 m5-b-lesson 9-s
G6 m5-b-lesson 9-sG6 m5-b-lesson 9-s
G6 m5-b-lesson 9-s
 
Mod 5 lesson 8
Mod 5 lesson 8Mod 5 lesson 8
Mod 5 lesson 8
 

Lesson 6 5 frequency tables & histograms

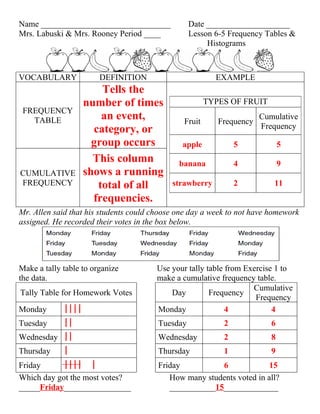
  • 1. Name _______________________________ Date ____________________ Mrs. Labuski & Mrs. Rooney Period ____ Lesson 6-5 Frequency Tables & Histograms VOCABULARY DEFINITION EXAMPLE Tells the number of times TYPES OF FRUIT FREQUENCY TABLE an event, Fruit Frequency Cumulative category, or Frequency group occurs apple 5 5 This column banana 4 9 CUMULATIVE shows a running FREQUENCY total of all strawberry 2 11 frequencies. Mr. Allen said that his students could choose one day a week to not have homework assigned. He recorded their votes in the box below. Make a tally table to organize Use your tally table from Exercise 1 to the data. make a cumulative frequency table. Cumulative Tally Table for Homework Votes Day Frequency Frequency Monday  Monday 4 4 Tuesday  Tuesday 2 6 Wednesday  Wednesday 2 8 Thursday  Thursday 1 9 Friday   Friday 6 15 Which day got the most votes? How many students voted in all? _____Friday________________ ___________15_____________
  • 2. Students listed the number of days they spent on vacation in one year. Make a tally table with intervals of 5. 2, 18, 5, 15, 7, 10, 1, 10, 4, 16, 7, 11, 17, 3, 8, 14, 13, 10 Number of Vacation Days 1-5  6-10   11-15  16-20  A bar graph that shows the 1. Choose an appropriate scale and number of data interval. HISTOGRAM 2. Draw a bar for the number of days itmes that occur in each interval. within each 3. Title the graph and label the axes. interval Number of Days spent on Vacation in one Year 7 6 5 4 3 2 1 0 1-5 6-10 11-15 16-20 Number of Vacation Days
  • 3. Name _______________________________ Date ____________________ Mrs. Labuski & Mrs. Rooney Period ____ Lesson 6-5 Frequency Tables & Histograms VOCABULARY DEFINITION EXAMPLE TYPES OF FRUIT FREQUENCY TABLE Cumulative Fruit Frequency Frequency CUMULATIVE FREQUENCY Mr. Allen said that his students could choose one day a week to not have homework assigned. He recorded their votes in the box below. Make a tally table to organize Use your tally table from Exercise 1 to the data. make a cumulative frequency table. Cumulative Tally Table for Homework Votes Day Frequency Frequency Monday Monday Tuesday Tuesday Wednesday Wednesday Thursday Thursday Friday Friday Which day got the most votes? How many students voted in all? ________________________ ________________________
  • 4. Students listed the number of days they spent on vacation in one year. Make a tally table with intervals of 5. 2, 18, 5, 15, 7, 10, 1, 10, 4, 16, 7, 11, 17, 3, 8, 14, 13, 10 1. Choose an appropriate scale and interval. HISTOGRAM 2. Draw a bar for the number of days in each interval. 3. Title the graph and label the axes.