Weitere ähnliche Inhalte Kürzlich hochgeladen (20) 1. << Back << || Print || Answer Key 4
Click Here
Name Date Class
CHAPTER Chapter Test
6 Form A
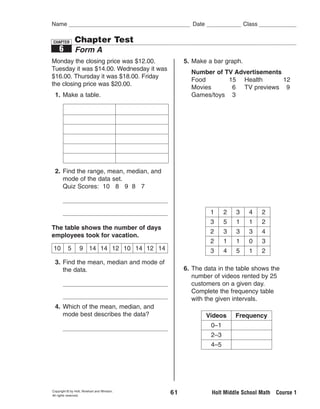
Monday the closing price was $12.00. 5. Make a bar graph.
Tuesday it was $14.00. Wednesday it was
Number of TV Advertisements
$16.00. Thursday it was $18.00. Friday
Food 15 Health 12
the closing price was $20.00.
Movies 6 TV previews 9
1. Make a table. Games/toys 3
2. Find the range, mean, median, and
mode of the data set.
Quiz Scores: 10 8 9 8 7
1 2 3 4 2
3 5 1 1 2
The table shows the number of days
2 3 3 3 4
employees took for vacation.
2 1 1 0 3
10 5 9 14 14 12 10 14 12 14 3 4 5 1 2
3. Find the mean, median and mode of
the data. 6. The data in the table shows the
number of videos rented by 25
customers on a given day.
Complete the frequency table
with the given intervals.
4. Which of the mean, median, and
mode best describes the data? Videos Frequency
0–1
2–3
4–5
Copyright © by Holt, Rinehart and Winston.
All rights reserved.
61 Holt Middle School Math Course 1
2. << Back << || Print || Answer Key 4
Click Here
Name Date Class
CHAPTER Chapter Test
6 Form A, continued
7. Name the ordered pairs for each Monthly Rainfall
location on the grid. 20
Rainfall (in.)
18
y 16
14
8 12
10
D 1 2 3 4 5
B6 Months
A 4
9. Why is this graph misleading?
2
C x
8 6 4 2 O 2 4
2
E 10. What might people believe from the
4 misleading graph?
8. Make a line graph for the depths of 11. Make a stem-and-leaf plot.
the river over 6 weeks. 10 31 26 30 22 17 23 12 31 28
Week 1 2 3 4 5 6 Stem Leaves
Depth 15 12 13 14 16 18
(in in.)
Copyright © by Holt, Rinehart and Winston.
All rights reserved.
62 Holt Middle School Math Course 1
3. << Back << || Print || Answer Key 4
Click Here
Name Date Class
CHAPTER Chapter Test
6 Form B
In 1965, 520,000 children were enrolled 5. Make a bar graph.
in preschool. In 1975, 1,748,000 were
Number of students in each class
enrolled. In 1985, 2,491,000 were enrolled.
Math 23 Gym 26
In 1995, 4,399,000 were enrolled, and in
Spanish 12 Science 24
2000, 4,481,000 children were enrolled.
English 25 History 19
1. Make a table of the data.
2. Find the range, mean, median, and
mode. 89 99 77 94 86 89
12 3 9 7 10
Attendance at Weekly Sales Meetings 10 3 8 10 5
5 8 6 0 11
Date Number in Attendance
11 9 7 4 5
July 3 48
3 3 6 13 2
July 10 50
14 2 3 12 5
July 17 36
6. The data in the table are the
July 24 47
numbers of responses by the
July 31 53 Swanton Rescue Squad for each day
August 7 50 in April. Make a frequency table with
August 14 38 intervals.
3. Find the mean, median, and mode.
4. Which of the mean, median, and
mode best describes the data?
Copyright © by Holt, Rinehart and Winston.
All rights reserved.
63 Holt Middle School Math Course 1
4. << Back << || Print || Answer Key 4
Click Here
Name Date Class
CHAPTER Chapter Test
6 Form B, continued
7. Name the ordered pairs for each Enrollment at Southern
location on the grid. Middle School
y
Number of students
650
625
A 4 600
E 575
2 550
x 525
500
4 2 O 2 4
2
00
02
94
96
98
20
20
19
19
19
B4 D
C Year
9. Why is this graph misleading?
A B
C D
10. What might people believe from the
E misleading graph?
8. Make a line graph.
Year Sales (in thousands)
1996 $114
1997 $130
11. Make a stem-and-leaf plot. 46 61 76
1998 $144
67 53 46 46 53 48 64 74
1999 $140
2000 $152 Stem Leaves
2001 $154
Copyright © by Holt, Rinehart and Winston.
All rights reserved.
64 Holt Middle School Math Course 1
5. << Back << || Print || Answer Key 4
Click Here
Name Date Class
CHAPTER Chapter Test
6 Form C
1. In 1995, 31.7% of U.S. households 5. Make a double bar graph.
had a computer. In 1996, 35.5% had
Number of Bushels of Apples Picked
a computer. In 1997, 39.2% had a
computer. In 1998, 42.6% had a Week 1 Week 2 Week 3 Week 4
computer. In 1999, 48.2% had Red 21 15 32 38
a computer, and in 2000, 53.0%
Yellow 25 18 27 36
of households had a computer.
Year Percentage
2. The daily high temperatures for one
week in August are listed. Find the
range, mean, median, and mode to 100 108 111 117
the nearest tenth. 111 113 103 103
86 92 88 91 95 84 86 115 116 117 100
102 109 107 114
102 103 106 102
116 115 111 115
Books Read by 6th Graders 6. Make a frequency table of the data
Sept. Oct. Nov. Dec. Jan. above.
29 30 30 15 28
3. Find the mean, median, and mode.
4. Which of the mean, median, and
mode best describes the data?
Copyright © by Holt, Rinehart and Winston.
All rights reserved.
65 Holt Middle School Math Course 1
6. << Back << || Print || Answer Key 4
Click Here
Name Date Class
CHAPTER Chapter Test
6 Form C, continued
7. Name the ordered pairs for each 9. Use the data given to construct a
location. misleading bar graph showing that the
company’s business is falling quickly.
y
Monthly Sales
4
B June $25,000
2 D
x
July $24,000
E
4 2 O 2 4 6 8 August $23,000
2
4
C
A 6
F
8
8. Make a double line graph.
Population of Orlando and Ft. Myers
Orlando Ft. Myers 10. Explain why your bar graph is
1970 523,000 105,000 misleading.
1980 805,000 205,000
1990 1,239,000 339,000
2000 1,535,000 401,000
11. Make a stem-and-leaf plot.
100, 103, 112, 120, 116, 127, 104,
109, 124, 118, 116 129, 119
Stem Leaves
Copyright © by Holt, Rinehart and Winston.
All rights reserved.
66 Holt Middle School Math Course 1
7. << Back << || Print ||
Name Date Class
CHAPTER Chapter Test
6 Form A
Monday the closing price was $12.00. 5. Make a bar graph.
Tuesday it was $14.00. Wednesday it was
Number of TV Advertisements
$16.00. Thursday it was $18.00. Friday
Food 15 Health 12
the closing price was $20.00.
Movies 6 TV previews 9
1. Make a table. Games/toys 3
Number of TV Advertisements
Day Price
Monday $12.00 16
14
Tuesday $14.00 12
Frequency
Wednesday $16.00 10
Thursday $18.00 8
6
Friday $20.00 4
2
2. Find the range, mean, median, and
0
mode of the data set.
d
s
es
lth
TV
ie
o
am
ea
Fo
Quiz Scores: 10 8 9 8 7
ov
H
M
G
range: 3; mean: 8.4; Ad
median: 8; mode: 8 1 2 3 4 2
3 5 1 1 2
The table shows the number of days
2 3 3 3 4
employees took for vacation.
2 1 1 0 3
10 5 9 14 14 12 10 14 12 14 3 4 5 1 2
3. Find the mean, median and mode of
the data. 6. The data in the table shows the
number of videos rented by 25
mean: 11.4; median: 12; customers on a given day.
Complete the frequency table
mode: 14 with the given intervals.
4. Which of the mean, median, and
mode best describes the data? Videos Frequency
Possible answer: mean or median 0–1 7
2–3 13
4–5 5
Copyright © by Holt, Rinehart and Winston.
All rights reserved.
61 Holt Middle School Math Course 1
8. << Back << || Print ||
Name Date Class
CHAPTER Chapter Test
6 Form A, continued
7. Name the ordered pairs for each Monthly Rainfall
location on the grid. 20
Rainfall (in.)
18
y 16
14
8 12
10
D 1 2 3 4 5
B6 Months
A 4
9. Why is this graph misleading?
2
C x The vertical scale does not start
8 6 4 2 O 2 4 at 0.
2
E 10. What might people believe from the
4 misleading graph?
Possible answer: People might
A( 4, 3), B( 1, 5), C(0, 2) believe that there was no rainfall
D(5, 6), E( 3, 2) the first month.
8. Make a line graph for the depths of 11. Make a stem-and-leaf plot.
the river over 6 weeks. 10 31 26 30 22 17 23 12 31 28
Week 1 2 3 4 5 6 Stem Leaves
Depth 15 12 13 14 16 18 1 027
(in in.) 2 2368
3 011
River Levels
20
Depth (in.)
15
10
5
0
1 2 3 4 5 6
Week
Copyright © by Holt, Rinehart and Winston.
All rights reserved.
62 Holt Middle School Math Course 1
9. << Back << || Print ||
Name Date Class
CHAPTER Chapter Test
6 Form B
In 1965, 520,000 children were enrolled 5. Make a bar graph.
in preschool. In 1975, 1,748,000 were
Number of students in each class
enrolled. In 1985, 2,491,000 were enrolled.
Math 23 Gym 26
In 1995, 4,399,000 were enrolled, and in
Spanish 12 Science 24
2000, 4,481,000 children were enrolled.
English 25 History 19
1. Make a table of the data.
Class Size
Year Number of students 30
Number of students
1965 520,000 25
1975 1,748,000 20
1985 2,491,000 15
1995 4,399,000 10
2000 4,481,000 5
0
2. Find the range, mean, median, and
h
h
h
ym
e
ry
at
is
is
nc
to
mode. 89 99 77 94 86 89
an
gl
G
M
ie
is
En
Sp
Sc
H
range: 22: mean: 89; median: Class
89; mode: 89 12 3 9 7 10
Attendance at Weekly Sales Meetings 10 3 8 10 5
5 8 6 0 11
Date Number in Attendance
11 9 7 4 5
July 3 48
3 3 6 13 2
July 10 50
14 2 3 12 5
July 17 36
6. The data in the table are the
July 24 47
numbers of responses by the
July 31 53 Swanton Rescue Squad for each day
August 7 50 in April. Make a frequency table with
August 14 38 intervals. Possible answer:
3. Find the mean, median, and mode. Responses Frequency
mean: 46; median: 48; mode: 50 0–2 3
3–5 10
4. Which of the mean, median, and
mode best describes the data? 6–8 6
9–11 7
median 12–14 4
Copyright © by Holt, Rinehart and Winston.
All rights reserved.
63 Holt Middle School Math Course 1
10. << Back << || Print ||
Name Date Class
CHAPTER Chapter Test
6 Form B, continued
7. Name the ordered pairs for each Enrollment at Southern
location on the grid. Middle School
y
Number of students
650
625
A 4 600
E 575
2 550
x 525
500
4 2 O 2 4
2
00
02
94
96
98
20
20
19
19
19
B4 D
C Year
9. Why is this graph misleading?
A ( 4, 5), B ( 1, 3),
The vertical scale is broken.
C (0, 5), D (3, 3),
10. What might people believe from the
E (1, 4) misleading graph?
8. Make a line graph.
People might believe that
Year Sales (in thousands) enrollment has more than
1996 $114
doubled since 1994.
1997 $130
11. Make a stem-and-leaf plot. 46 61 76
1998 $144
67 53 46 46 53 48 64 74
1999 $140
2000 $152 Stem Leaves
2001 $154 4 6668
5 33
Possible answer: 6 147
Car Sales 7 46
200
($ in thousands)
175
150
125
Sales
100
75
50
25
0
’96 ’97 ’98 ’99 ’00 ’01
Year
Copyright © by Holt, Rinehart and Winston.
All rights reserved.
64 Holt Middle School Math Course 1
11. << Back << || Print ||
Name Date Class
CHAPTER Chapter Test
6 Form C
1. In 1995, 31.7% of U.S. households 5. Make a double bar graph.
had a computer. In 1996, 35.5% had
Number of Bushels of Apples Picked
a computer. In 1997, 39.2% had a
computer. In 1998, 42.6% had a Week 1 Week 2 Week 3 Week 4
computer. In 1999, 48.2% had Red 21 15 32 38
a computer, and in 2000, 53.0%
Yellow 25 18 27 36
of households had a computer.
Apple Picking
Year Percentage
40
1995 31.7 35
1996 35.5 30
Bushels
25 Red
1997 39.2 20
15 Yellow
1998 42.6 10
1999 48.2 5
0
2000 53.0 1 2 3 4
Week
2. The daily high temperatures for one
week in August are listed. Find the
range, mean, median, and mode to 100 108 111 117
the nearest tenth. 111 113 103 103
86 92 88 91 95 84 86 115 116 117 100
range: 11; mean: 88.9; 102 109 107 114
102 103 106 102
median: 88; mode: 86
116 115 111 115
Books Read by 6th Graders 6. Make a frequency table of the data
Sept. Oct. Nov. Dec. Jan. above.
29 30 30 15 28
Possible answer:
3. Find the mean, median, and mode. Interval Frequency
100–104 8
mean: 26.4; median: 29;
105–109 4
mode: 30 110–114 5
4. Which of the mean, median, and 115–119 7
mode best describes the data?
median
Copyright © by Holt, Rinehart and Winston.
All rights reserved.
65 Holt Middle School Math Course 1
12. << Back << || Print ||
Name Date Class
CHAPTER Chapter Test
6 Form C, continued
7. Name the ordered pairs for each 9. Use the data given to construct a
location. misleading bar graph showing that the
company’s business is falling quickly.
y
Monthly Sales
4
B June $25,000
2 D
x
July $24,000
E
4 2 O 2 4 6 8 August $23,000
2
4
Possible answer:
C
A 6
Monthly Sales
F 25,500
8 25,000
24,500
Sales 24,000
23,500
A( 6, 5), B( 3, 3), C(0, 4), 23,000
22,500
D(2, 3), E(6, 0), F(5, 6) 22,000
e
y
t
us
l
n
Ju
Ju
g
8. Make a double line graph.
Population of Orlando and Ft. Myers Month Au
Orlando Ft. Myers 10. Explain why your bar graph is
1970 523,000 105,000 misleading.
1980 805,000 205,000 Possible answer: The lower part
1990 1,239,000 339,000
of the vertical scale is missing.
2000 1,535,000 401,000
11. Make a stem-and-leaf plot.
Population
100, 103, 112, 120, 116, 127, 104,
1,800,000 109, 124, 118, 116 129, 119
1,600,000
Total population
1,400,000
Stem Leaves
1,200,000
1,000,000 Orlando 10 0 3 4 9
800,000
600,000 Ft. Myers
11 2 6 6 8 9
400,000 12 0 4 7 9
200,000
0
0
70
90
0
8
0
19
19
19
20
Year
Copyright © by Holt, Rinehart and Winston.
All rights reserved.
66 Holt Middle School Math Course 1