SlideShare a Scribd company logo
1 of 9
Download to read offline
News Release
FOR IMMEDIATE RELEASE:
Home buyers and sellers face changing market dynamics
VANCOUVER, BC – October 4, 2016 – Metro Vancouver* home sales dipped below the 10-
year monthly sales average last month. This is the first time this has occurred in the region since
May 2014.
Metro Vancouver home sales totalled 2,253 in September 2016, a decrease of 32.6 per cent from
the 3,345 sales recorded in September 2015 and a decrease of 9.5 per cent compared to August
2016 when 2,489 homes sold.
Last month’s sales were 9.6 per cent below the 10-year sales average for the month.
“Supply and demand conditions differ today depending on property type,” Dan Morrison,
REBGV president said. “We’re seeing more demand for condominiums and townhomes today
than in the detached home market.”
New listings for detached, attached and apartment properties in Metro Vancouver totalled 4,799
in September 2016. This represents a decrease of one per cent compared to the 4,846 units listed
in September 2015 and an 11.8 per cent increase compared to August 2016 when 4,293
properties were listed.
The total number of homes currently listed for sale on the MLS® system in Metro Vancouver is
9,354, a 13.4 per cent decline compared to September 2015 (10,805) and a 10 per cent increase
compared to August 2016 (8,506).
The sales-to-active listings ratio for September 2016 is 24.1 per cent. This is the lowest this ratio
has been since February 2015. Generally, analysts say that downward pressure on home prices
occurs when the ratio dips below the 12 per cent mark, while home prices often experience
upward pressure when it reaches the 20 to 22 per cent range in a particular community for a
sustained period.
“Changing market conditions are easing upward pressure on home prices in our region,”
Morrison said. “There’s uncertainty in the market at the moment and home buyers and sellers are
having difficulty establishing price as a result. To help you understand the factors affecting
prices, it’s important to talk with a REALTOR®.”
The MLS® Home Price Index composite benchmark price for all residential properties in Metro
Vancouver is currently $931,900. This represents a 28.9 per cent increase compared to
September 2015 and a 0.1 per cent decline compared to August 2016.
Sales of detached properties in September 2016 reached 666, a decrease of 47.6 per cent from the
1,272 detached sales recorded in September 2015. The benchmark price for detached properties
is $1,579,400. This represents a 33.7 per cent increase compared to September 2015 and a 0.1
per cent increase compared to August 2016.
Sales of apartment properties reached 1,218 in September 2016, a decrease of 20.3 per cent
compared to the 1,529 sales in September 2015.The benchmark price of an apartment property is
$511,800. This represents a 23.5 per cent increase compared to September 2015 and a 0.5 per
cent decline compared to August 2016.
Attached property sales in September 2016 totalled 369, a decrease of 32.2 per cent compared to
the 544 sales in September 2015. The benchmark price of an attached unit is $677,000. This
represents a 29.1 per cent increase compared to September 2015 and a 0.1 per cent decline
compared to August 2016.
*Editor’s Note: Areas covered by Real Estate Board of Greater Vancouver include: Whistler, Sunshine Coast,
Squamish, West Vancouver, North Vancouver, Vancouver, Burnaby, New Westminster, Richmond, Port Moody,
Port Coquitlam, Coquitlam, New Westminster, Pitt Meadows, Maple Ridge, and South Delta.
-30-
The real estate industry is a key economic driver in British Columbia. In 2015, 42,326 homes changed ownership in
the Board’s area, generating $2.7 billion in economic spin-off activity and an estimated 19,000 jobs. The total dollar
value of residential sales transacted through the MLS® system in Greater Vancouver totalled $39 billion in 2015.
The Real Estate Board of Greater Vancouver is an association representing more than 13,000 REALTORS® and
their companies. The Board provides a variety of member services, including the Multiple Listing Service®. For
more information on real estate, statistics, and buying or selling a home, contact a local REALTOR® or visit
www.rebgv.org.
For more information please contact:
Craig Munn
Manager, Communication
Real Estate Board of Greater Vancouver
604.730.3146
cmunn@rebgv.org
Property Type Area
Benchmark
Price
Price
Index
1 Month
Change %
3 Month
Change %
6 Month
Change %
1 Year
Change %
3 Year
Change %
5 Year
Change %
10 Year
Change %
Residential / Composite Lower Mainland $829,400 233.9 -0.3% 2.1% 15.3% 30.4% 52.8% 52.0% 81.6%
Greater Vancouver $931,900 243.9 -0.1% 1.5% 14.3% 28.9% 54.6% 52.5% 90.1%
Bowen Island $797,400 172.9 -0.1% 3.5% 22.0% 23.9% 38.2% 32.1% 36.0%
Burnaby East $854,700 235.9 -1.7% -0.3% 11.5% 24.7% 51.6% 54.6% 82.0%
Burnaby North $779,200 234.2 -0.1% 0.8% 15.2% 28.2% 50.3% 50.4% 81.8%
Burnaby South $866,800 245.0 -0.1% 2.3% 17.8% 28.4% 51.5% 49.8% 90.4%
Coquitlam $775,100 230.0 -0.9% 0.0% 12.3% 27.6% 56.3% 56.7% 80.7%
Ladner $854,900 237.6 2.6% 1.3% 15.2% 31.5% 60.2% 56.5% 94.1%
Maple Ridge $575,100 194.3 0.3% 4.3% 19.3% 34.3% 48.2% 45.7% 55.3%
New Westminster $541,400 230.6 0.9% 4.3% 14.6% 28.5% 46.3% 45.2% 72.3%
North Vancouver $1,006,500 227.1 -1.9% 1.1% 15.6% 31.1% 54.6% 59.7% 85.4%
Pitt Meadows $559,900 204.8 0.8% 5.5% 18.9% 31.0% 45.9% 48.5% 57.8%
Port Coquitlam $595,400 211.0 -1.3% 1.8% 12.2% 28.7% 51.6% 47.6% 63.3%
Port Moody $778,700 215.3 0.3% 2.5% 10.9% 27.4% 52.4% 57.3% 69.3%
Richmond $886,900 257.0 0.4% 1.7% 15.4% 30.4% 55.6% 50.0% 99.8%
Squamish $628,600 204.9 0.9% 5.5% 17.4% 30.0% 64.8% 62.2% 76.8%
Sunshine Coast $490,300 171.8 2.7% 5.6% 18.7% 27.4% 42.9% 29.2% 36.2%
Tsawwassen $1,000,800 250.7 3.3% 0.7% 16.3% 34.4% 68.6% 65.4% 104.3%
Vancouver East $990,400 290.1 -0.1% 2.5% 15.4% 31.1% 63.4% 66.0% 120.6%
Vancouver West $1,246,500 262.7 -0.5% -0.3% 11.7% 26.7% 54.3% 52.3% 102.1%
West Vancouver $2,776,800 298.0 0.1% 3.3% 18.7% 35.9% 75.6% 82.3% 129.9%
Whistler $722,200 167.8 1.7% 6.7% 17.1% 27.6% 62.8% 45.5% 49.6%
Single Family Detached Lower Mainland $1,259,400 267.5 -0.4% 1.3% 17.7% 34.6% 66.0% 66.0% 111.5%
Greater Vancouver $1,579,400 291.3 0.1% 1.1% 17.6% 33.7% 70.8% 67.6% 131.4%
Bowen Island $797,400 172.9 -0.1% 3.5% 22.0% 23.9% 38.2% 32.1% 36.0%
Burnaby East $1,228,900 274.8 -2.5% -1.7% 12.5% 29.7% 64.6% 70.9% 115.2%
Burnaby North $1,565,300 302.7 -2.0% -4.1% 15.1% 29.2% 66.3% 72.4% 138.7%
Burnaby South $1,689,400 323.4 -0.6% 0.9% 21.1% 36.5% 73.9% 75.0% 154.0%
Coquitlam $1,211,000 268.7 -1.4% -0.5% 15.8% 34.3% 71.8% 76.0% 114.4%
Ladner $1,064,800 256.7 3.3% 2.1% 16.2% 36.0% 70.6% 69.9% 111.4%
Maple Ridge $719,900 205.1 1.0% 4.0% 19.5% 37.0% 56.3% 55.6% 68.8%
New Westminster $1,085,500 269.3 -1.7% -0.9% 14.2% 31.0% 63.7% 64.4% 112.2%
North Vancouver $1,663,500 264.8 -1.6% 0.0% 16.9% 37.2% 74.1% 81.7% 122.1%
Pitt Meadows $793,600 223.6 1.2% 4.3% 19.9% 34.9% 56.8% 62.3% 75.5%
Port Coquitlam $888,500 237.0 -2.1% -3.0% 10.4% 27.8% 61.8% 61.7% 87.1%
Port Moody $1,386,200 256.0 -0.6% 0.5% 14.5% 31.3% 62.8% 71.0% 106.6%
Richmond $1,686,300 338.2 -1.1% -0.8% 19.3% 39.3% 79.7% 67.1% 163.8%
Squamish $787,200 209.3 -1.6% 3.3% 19.5% 28.9% 58.8% 58.7% 75.1%
Sunshine Coast $487,500 170.8 2.5% 5.4% 18.5% 27.4% 43.0% 28.4% 35.6%
Tsawwassen $1,269,700 273.4 1.8% -0.2% 14.3% 36.6% 77.8% 78.2% 123.7%
Vancouver East $1,537,300 339.8 0.2% 1.7% 19.3% 32.4% 80.9% 86.8% 166.5%
Vancouver West $3,624,300 372.1 0.2% 2.2% 18.0% 32.1% 73.2% 62.1% 186.7%
West Vancouver $3,363,700 319.8 0.1% 3.1% 20.1% 36.5% 81.1% 89.2% 147.7%
Whistler $1,303,200 180.4 -1.5% 2.4% 15.6% 22.6% 48.5% 38.8% 56.5%
HOW TO READ THE TABLE:
• Benchmark Price: Estimated sale price of a benchmark property. Benchmarks represent a typical property within each market.
• Price Index: Index numbers estimate the percentage change in price on typical and constant quality properties over time. All figures are based on past sales.
• x Month/Year Change %: Percentage change of index over a period of x month(s)/year(s) *
In January 2005, the indexes are set to 100.
Townhome properties are similar to Attached properties, a category that was used in the previous MLSLink HPI, but do not included duplexes.
The above info is deemed reliable, but is not guaranteed. All dollar amounts in CDN.
September 2016*
* MLS®, Multiple Listing Service®, and all related graphics are trademarks of The Canadian Real Estate Association 1 of 14
Property Type Area
Benchmark
Price
Price
Index
1 Month
Change %
3 Month
Change %
6 Month
Change %
1 Year
Change %
3 Year
Change %
5 Year
Change %
10 Year
Change %
September 2016*
Townhouse Lower Mainland $563,700 204.0 0.1% 5.2% 17.2% 31.0% 44.1% 39.7% 60.9%
Greater Vancouver $677,000 218.8 -0.1% 3.1% 14.9% 29.1% 47.0% 43.3% 72.8%
Burnaby East $516,300 185.2 1.0% 1.8% 16.1% 15.4% 23.7% 25.3% 44.9%
Burnaby North $538,000 200.6 4.6% 4.9% 15.2% 22.1% 34.3% 25.8% 54.9%
Burnaby South $586,400 210.4 4.3% 10.2% 23.2% 30.8% 42.3% 37.1% 64.9%
Coquitlam $524,000 192.5 1.4% -0.7% 6.6% 21.0% 38.9% 34.6% 53.3%
Ladner $639,200 211.8 0.2% 1.7% 11.4% 27.6% 46.3% 39.2% 69.8%
Maple Ridge $398,000 193.3 -2.6% 6.6% 24.8% 34.2% 45.1% 39.7% 47.9%
New Westminster $535,600 201.2 -2.6% -1.4% 10.1% 22.3% 36.0% 35.8% 56.6%
North Vancouver $878,600 210.3 -2.4% 3.3% 19.6% 33.3% 51.8% 52.3% 72.0%
Pitt Meadows $474,900 205.5 -0.9% 6.1% 21.2% 31.6% 50.3% 43.0% 59.7%
Port Coquitlam $543,500 206.1 -1.2% 5.5% 12.0% 34.0% 47.6% 45.4% 60.3%
Port Moody $545,600 184.4 1.4% -0.3% 4.6% 17.8% 36.3% 31.2% 42.2%
Richmond $721,300 233.2 -1.5% 1.6% 14.2% 27.3% 44.9% 39.5% 83.6%
Squamish $636,200 231.1 3.6% 8.7% 15.5% 32.9% 90.0% 83.0% 107.8%
Tsawwassen $637,900 210.8 -0.5% 3.2% 11.9% 29.8% 50.6% 32.6% 69.0%
Vancouver East $776,400 256.0 -1.2% 1.4% 8.8% 34.1% 48.3% 51.4% 90.2%
Vancouver West $1,116,300 252.5 0.8% 2.1% 18.9% 37.2% 58.6% 63.9% 107.0%
Whistler $770,800 206.1 1.1% 5.3% 11.7% 26.6% 68.8% 64.4% 92.1%
Apartment Lower Mainland $460,300 201.0 -0.4% 2.7% 10.9% 23.5% 36.3% 36.0% 51.2%
Greater Vancouver $511,800 205.8 -0.5% 2.1% 10.6% 23.5% 38.9% 37.9% 56.6%
Burnaby East $531,000 201.6 -5.4% 0.7% -0.5% 16.9% 41.9% 45.9% 46.5%
Burnaby North $466,600 197.3 -0.3% 4.9% 15.2% 27.7% 39.6% 39.2% 51.5%
Burnaby South $532,100 213.6 -0.6% 2.3% 15.1% 23.8% 40.0% 36.6% 64.1%
Coquitlam $346,500 190.7 -0.1% 3.1% 10.4% 22.2% 40.4% 37.3% 45.0%
Ladner $408,900 193.8 2.9% -1.7% 16.5% 17.7% 36.4% 27.0% 56.4%
Maple Ridge $203,900 147.2 1.7% 7.3% 14.7% 23.3% 14.6% 10.4% 8.3%
New Westminster $384,400 218.9 2.3% 7.6% 15.3% 27.8% 40.1% 38.2% 60.1%
North Vancouver $453,600 184.6 -2.9% 2.1% 12.5% 21.5% 29.9% 32.7% 46.2%
Pitt Meadows $305,200 180.4 2.0% 7.1% 16.4% 24.8% 28.5% 37.7% 32.7%
Port Coquitlam $311,800 184.8 0.3% 8.5% 17.6% 28.5% 43.6% 32.5% 38.9%
Port Moody $480,200 200.1 1.2% 7.8% 12.2% 30.4% 50.0% 59.6% 56.3%
Richmond $439,000 185.4 -0.3% 3.5% 8.5% 17.9% 27.1% 27.4% 42.5%
Squamish $367,800 177.1 3.7% 8.0% 18.5% 31.4% 62.9% 60.3% 55.4%
Tsawwassen $427,700 180.3 3.9% -1.5% 19.2% 20.1% 35.7% 24.9% 45.5%
Vancouver East $435,700 240.3 -0.9% 4.1% 11.7% 28.8% 45.1% 44.5% 75.1%
Vancouver West $683,200 221.1 -1.3% -1.9% 7.5% 23.0% 43.8% 44.9% 68.5%
West Vancouver $901,200 196.9 -0.6% 6.5% 9.6% 29.7% 41.6% 41.3% 49.6%
Whistler $393,800 129.1 4.9% 12.2% 27.4% 41.7% 95.9% 59.2% 12.7%
HOW TO READ THE TABLE:
• Benchmark Price: Estimated sale price of a benchmark property. Benchmarks represent a typical property within each market.
• Price Index: Index numbers estimate the percentage change in price on typical and constant quality properties over time. All figures are based on past sales.
• x Month/Year Change %: Percentage change of index over a period of x month(s)/year(s)
In January 2005, the indexes are set to 100. *
Townhome properties are similar to attached properties, a category that was used in the previous MLSLink HPI, but do not included duplexes.
Lower Mainland includes areas serviced by both Real Estate Board of Greater Vancouver & Fraser Valley Real Estate Board.
The above info is deemed reliable, but is not guaranteed. All dollar amounts in CDN.
* MLS®, Multiple Listing Service®, and all related graphics are trademarks of The Canadian Real Estate Association 2 of 14
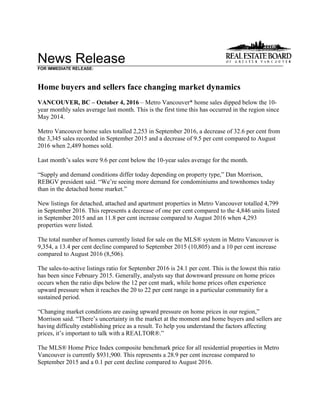
C:DATAMonthEndHpiexporthi_resgv-hpi2.tifGreaterVancouver
5YearTrend
60
110
160
210
260
310
Sep 2011
Nov 2011
Jan 2012
Mar 2012
May 2012
Jul 2012
Sep 2012
Nov 2012
Jan 2013
Mar 2013
May 2013
Jul 2013
Sep 2013
Nov 2013
Jan 2014
Mar 2014
May 2014
Jul 2014
Sep 2014
Nov 2014
Jan 2015
Mar 2015
May 2015
Jul 2015
Sep 2015
Nov 2015
Jan 2016
Mar 2016
May 2016
Jul 2016
Sep 2016
Price
Index
ResidentialDetachedTownhouseApartment
Jan2005HPI=100
9232016MLS®
SALESFacts
Burnaby
Coquitlam
Delta-South
Islands-Gulf
MapleRidge/PittMeadows
NewWestminster
NorthVancouver
PortCoquitlam
PortMoody/Belcarra
Richmond
Squamish
SunshineCoast
VancouverEast
VancouverWest
WestVancouver/HoweSound
Whistler/Pemberton
Detached586321592175327879195662602224666
Attached32231904563118206010102637230369
Apartment16579904491975331130131011232915401,218
Detached$1,550,000$1,100,000$1,140,000n/a$729,000n/a$1,602,000$874,500n/a$1,697,500n/a$470,000$1,539,750$2,990,000$2,835,000$1,327,500
Attached$636,000$522,750n/an/a$440,000n/a$882,000n/a$532,500$789,000n/an/a$915,000$1,125,000n/a$735,000n/a
Apartment$458,000$392,500n/an/a$254,000$387,000$533,000$287,500$389,900$375,000n/an/a$435,000$631,000n/a$437,500
Detached44572391351362221261237178613113715
Attached4537307572116167113122449438431
Apartment1831031705910077523619111711534218321,343
Detached$1,520,000$1,108,750$1,027,500n/a$731,000n/a$1,570,000$848,000n/a$1,700,000$847,000$469,877$1,472,500$3,550,000$2,758,000n/a
Attached$705,000$627,500n/an/a$416,000n/a$849,000n/an/a$739,000n/an/a$760,000$1,148,800n/a$801,250n/a
Apartment$431,200$388,000n/an/a$269,000$361,900$456,000$309,900$489,500$400,000n/an/a$458,888$639,500n/a$302,500
Detached86126585154301074219176337714412567231,272
Attached7748606919373111841544851836544
Apartment2211142103980111373719419915743325321,529
Detached$1,270,000$950,765$915,000n/a$587,000$799,000$1,356,250$705,300n/a$1,368,000$755,000$432,500$1,288,000$2,868,250$2,600,000$975,000
Attached$565,000$593,000n/an/a$314,950n/a$685,000$434,900n/a$596,000n/an/a$794,000$1,110,000n/a$566,000n/a
Apartment$395,000$335,950$409,000n/a$215,000$285,000$389,000$249,900$375,000$389,000n/an/a$410,000$527,000$859,000$324,500
Detached1,0161,228540601,6563391,0725032621,4752508251,2891,38175517312,824
Attached644463107064112038928119887316296361613632815,292
Apartment2,1631,21916105219711,0675783402,129157931,3544,34918937515,666
Detached$1,619,400$1,240,000$1,200,000$421,500$720,000$1,093,000$1,650,805$868,000$1,300,000$1,700,000$834,875$486,500$1,550,000$3,523,500$3,200,000$1,369,000
Attached$675,000$676,500$685,000n/a$402,500$536,000$885,000$542,000$595,000$738,000$535,000$301,000$892,500$1,200,761$1,650,000$723,000n/a
Apartment$436,000$374,500$468,000n/a$237,500$351,000$466,000$285,100$446,650$410,000$337,000$274,167$440,000$642,500$820,000$305,000
Detached1,2501,268545411,3902981,1714662521,8012675651,5281,57080515013,367
Attached81146189054712741929715098917760438695872305,577
Apartment1,78189019602948029794042551,546128651,4424,21116023213,385
Detached$1,233,500$883,250$850,188$380,000$547,500$810,000$1,287,125$660,000$970,000$1,210,000$656,500$400,000$1,200,000$2,770,000$2,372,500$1,133,750
Attached$535,000$511,750$505,125n/a$317,000$463,280$680,000$418,800$437,500$568,250$419,900$275,000$725,000$930,000$1,138,000$575,000n/a
Apartment$390,000$324,950$360,000n/a$210,386$304,000$402,000$245,000$385,000$355,000$259,500$256,298$378,950$524,950$789,500$275,000
Note:MedianSellingPricesarenotreportedforareaswithlessthan20salesorfortheGulfIslands
Median
Selling
Price
Number
of
Sales
Median
Selling
Price
August
2016
September
2015
Jan.-
Sep.2016
Jan.-
Sep.2015
Median
Selling
Price
Number
of
Sales
Median
Selling
Price
Number
of
Sales
September
2016
Number
of
Sales
Median
Selling
Price
Number
of
Sales
September
2016
Year-to-date
Year-to-date
9232016MLS®
LISTINGSFacts
Burnaby
Coquitlam
Delta-South
Islands-Gulf
MapleRidge/PittMeadows
NewWestminster
NorthVancouver
PortCoquitlam
PortMoody/Belcarra
Richmond
Squamish
SunshineCoast
VancouverEast
VancouverWest
WestVancouver/HoweSound
Whistler/Pemberton
Detached18318878132193521574402444690296250170192,160
Attached895218168115941221033686886522689
Apartment225126220541271657447198251418760931461,950
Detached32%34%27%38%42%49%25%36%20%32%41%62%21%24%13%126%
Attached36%44%106%0%66%55%53%44%91%58%28%125%38%43%40%136%n/a
Apartment73%63%41%n/a81%72%59%72%66%66%52%71%60%54%48%87%
Detached17714191112113712073312413110824618795251,825
Attached915716370739461911820105072434656
Apartment27412617059113105704622919416552715431,812
Detached25%40%25%82%64%35%52%30%39%25%74%66%32%33%33%52%
Attached49%65%19%0%107%100%54%35%84%60%65%120%48%68%100%112%n/a
Apartment67%82%100%n/a100%88%73%74%78%83%58%175%70%65%120%74%
Detached1901886571752819257432642671216309202292,062
Attached9767818917384621153191055113925768
Apartment238126340481271604141265142620063526352,016
Detached45%67%89%71%88%107%56%74%44%67%127%108%67%40%33%79%
Attached79%72%75%0%78%112%97%67%52%55%79%40%87%45%89%144%n/a
Apartment93%90%62%n/a81%63%69%90%90%73%136%35%79%68%96%91%
Detached2,0412,0479801192,2675041,7268084263,0024061,0222,6162,7231,64522122,553
Attached96261117647141424983962321,242242106534841903027,092
Apartment2,5561,47722105721,1921,3846634312,541224941,6785,81627039219,511
Detached50%60%55%50%73%67%62%62%62%49%62%81%49%51%46%78%
Attached67%76%61%0%90%85%78%71%85%70%67%91%68%73%70%93%n/a
Apartment85%83%73%n/a91%81%77%87%79%84%70%99%81%75%70%96%
Detached1,8481,665643891,7733681,5745683852,6263299422,2232,6871,67827319,671
Attached1,07660610127311784893951801,2812221025681,0251132937,362
Apartment2,7481,39626305421,3461,5056613632,801158982,0236,14629133620,677
Detached68%76%85%46%78%81%74%82%65%69%81%60%69%58%48%55%
Attached75%76%88%0%75%71%86%75%83%77%80%59%77%68%77%78%n/a
Apartment65%64%75%n/a54%60%65%61%70%55%81%66%71%69%55%69%
*Year-to-datelistingsrepresentacumulativetotaloflistingsratherthantotalactivelistings.
Number
of
Listings
September
2016
Number
of
Listings
%Salesto
Listings
Number
of
Listings
%Salesto
Listings
Number
of
Listings
%Salesto
Listings
August
2016
September
2015
Jan.-
Sep.2016
Jan.-
Sep.2015
%Salesto
Listings
Number
of
Listings
%Salesto
Listings
September
2016
Year-to-date*
Year-to-date*
Listing & Sales Activity Summary
Listings Sales
1 2 3 Col. 2 & 3 5 6 7 Col. 6 & 7 9 10 Col. 9 & 10
Sep Aug Sep Percentage Sep Aug Sep Percentage Jul 2015 - Jul 2016 - Percentage
2015 2016 2016 Variance 2015 2016 2016 Variance Sep 2015 Sep 2016 Variance
BURNABY % % %
DETACHED 190 177 183 3.4 86 44 58 31.8 363 179 -50.7
ATTACHED 97 91 89 -2.2 77 45 32 -28.9 268 155 -42.2
APARTMENTS 238 274 225 -17.9 221 183 165 -9.8 674 582 -13.6
COQUITLAM
DETACHED 188 141 188 33.3 126 57 63 10.5 428 225 -47.4
ATTACHED 67 57 52 -8.8 48 37 23 -37.8 163 113 -30.7
APARTMENTS 126 126 126 0.0 114 103 79 -23.3 309 316 2.3
DELTA
DETACHED 65 91 78 -14.3 58 23 21 -8.7 169 97 -42.6
ATTACHED 8 16 18 12.5 6 3 19 533.3 29 36 24.1
APARTMENTS 34 17 22 29.4 21 17 9 -47.1 64 38 -40.6
MAPLE RIDGE/PITT MEADOWS
DETACHED 175 211 219 3.8 154 135 92 -31.9 464 353 -23.9
ATTACHED 89 70 68 -2.9 69 75 45 -40.0 206 184 -10.7
APARTMENTS 48 59 54 -8.5 39 59 44 -25.4 107 160 49.5
NORTH VANCOUVER
DETACHED 192 120 215 79.2 107 62 53 -14.5 318 214 -32.7
ATTACHED 38 39 59 51.3 37 21 31 47.6 104 78 -25.0
APARTMENTS 160 105 165 57.1 111 77 97 26.0 335 287 -14.3
NEW WESTMINSTER
DETACHED 28 37 35 -5.4 30 13 17 30.8 100 66 -34.0
ATTACHED 17 7 11 57.1 19 7 6 -14.3 43 24 -44.2
APARTMENTS 127 113 127 12.4 80 100 91 -9.0 260 297 14.2
PORT MOODY/BELCARRA
DETACHED 43 31 40 29.0 19 12 8 -33.3 75 47 -37.3
ATTACHED 21 19 22 15.8 11 16 20 25.0 41 50 22.0
APARTMENTS 41 46 47 2.2 37 36 31 -13.9 106 98 -7.5
PORT COQUITLAM
DETACHED 57 73 74 1.4 42 22 27 22.7 159 91 -42.8
ATTACHED 46 46 41 -10.9 31 16 18 12.5 115 63 -45.2
APARTMENTS 41 70 74 5.7 37 52 53 1.9 134 171 27.6
RICHMOND
DETACHED 264 241 244 1.2 176 61 79 29.5 575 263 -54.3
ATTACHED 153 118 103 -12.7 84 71 60 -15.5 310 229 -26.1
APARTMENTS 265 229 198 -13.5 194 191 130 -31.9 560 532 -5.0
SUNSHINE COAST
DETACHED 71 108 90 -16.7 77 71 56 -21.1 220 203 -7.7
ATTACHED 10 10 8 -20.0 4 12 10 -16.7 16 33 106.3
APARTMENTS 26 4 14 250.0 9 7 10 42.9 24 26 8.3
SQUAMISH
DETACHED 26 31 46 48.4 33 23 19 -17.4 87 65 -25.3
ATTACHED 19 20 36 80.0 15 13 10 -23.1 49 40 -18.4
APARTMENTS 14 19 25 31.6 19 11 13 18.2 43 34 -20.9
VANCOUVER EAST
DETACHED 216 246 296 20.3 144 78 62 -20.5 431 257 -40.4
ATTACHED 55 50 68 36.0 48 24 26 8.3 148 91 -38.5
APARTMENTS 200 165 187 13.3 157 115 112 -2.6 459 358 -22.0
VANCOUVER WEST
DETACHED 309 187 250 33.7 125 61 60 -1.6 428 229 -46.5
ATTACHED 113 72 86 19.4 51 49 37 -24.5 203 145 -28.6
APARTMENTS 635 527 609 15.6 433 342 329 -3.8 1533 1106 -27.9
WHISTLER/PEMBERTON
DETACHED 29 25 19 -24.0 23 13 24 84.6 58 52 -10.3
ATTACHED 25 34 22 -35.3 36 38 30 -21.1 96 94 -2.1
APARTMENTS 35 43 46 7.0 32 32 40 25.0 89 108 21.3
WEST VANCOUVER/HOWE SOUND
DETACHED 202 95 170 78.9 67 31 22 -29.0 230 97 -57.8
ATTACHED 9 4 5 25.0 8 4 2 -50.0 21 12 -42.9
APARTMENTS 26 15 31 106.7 25 18 15 -16.7 55 50 -9.1
GRAND TOTALS
DETACHED 2055 1814 2147 18.4 1267 706 661 -6.4 4105 2438 -40.6
ATTACHED 767 653 688 5.4 544 431 369 -14.4 1812 1347 -25.7
APARTMENTS 2016 1812 1950 7.6 1529 1343 1218 -9.3 4752 4163 -12.4
ResidentialAverageSalePrices-January1977toSeptember2016
0
200
400
600
800
1000
1200
1400
1600
1800
2000
1977197819791980198119821983198419851986198719881989199019911992199319941995199619971998199920002001200220032004200520062007200820092010201120122013201420152016
DETACHEDCONDOMINIUMATTACHEDAPARTMENTS
INTHOUSANDS($)
NOTE:From1977-1984condominiumaverageswerenotseparatedintoattached&apartment.
$741,985
$549,214
$1,532,242

More Related Content

What's hot

REBGV November 2015 Statistics Package Mike Stewart Realtor
REBGV November 2015 Statistics Package Mike Stewart RealtorREBGV November 2015 Statistics Package Mike Stewart Realtor
REBGV November 2015 Statistics Package Mike Stewart RealtorMike Stewart
 
March 2017 Rebgv Stats Package Mike Stewart
March 2017 Rebgv Stats Package Mike StewartMarch 2017 Rebgv Stats Package Mike Stewart
March 2017 Rebgv Stats Package Mike StewartMike Stewart
 
September 2015 rebgv statistics package mike stewart
September 2015 rebgv statistics package mike stewartSeptember 2015 rebgv statistics package mike stewart
September 2015 rebgv statistics package mike stewartMike Stewart
 
February 2017 REBGV Statistics Package Mike Stewart Realtor
February 2017 REBGV Statistics Package Mike Stewart RealtorFebruary 2017 REBGV Statistics Package Mike Stewart Realtor
February 2017 REBGV Statistics Package Mike Stewart RealtorMike Stewart
 
October 2015 Vancouver Real Estate Board Statistics Package Mike Stewart Realtor
October 2015 Vancouver Real Estate Board Statistics Package Mike Stewart RealtorOctober 2015 Vancouver Real Estate Board Statistics Package Mike Stewart Realtor
October 2015 Vancouver Real Estate Board Statistics Package Mike Stewart RealtorMike Stewart
 
July 2015 rebgv stats package mike stewart
July 2015 rebgv stats package mike stewartJuly 2015 rebgv stats package mike stewart
July 2015 rebgv stats package mike stewartMike Stewart
 
May 2017 REBGV Stats
May 2017 REBGV Stats May 2017 REBGV Stats
May 2017 REBGV Stats Mike Stewart
 
April 2017 Real Estate Board of Greater Vancouver Statistics Package with Charts
April 2017 Real Estate Board of Greater Vancouver Statistics Package with ChartsApril 2017 Real Estate Board of Greater Vancouver Statistics Package with Charts
April 2017 Real Estate Board of Greater Vancouver Statistics Package with ChartsMike Stewart
 
August 2017 REBGV Stats Mike Stewart Realtor
August 2017 REBGV Stats Mike Stewart RealtorAugust 2017 REBGV Stats Mike Stewart Realtor
August 2017 REBGV Stats Mike Stewart RealtorMike Stewart
 
REBGV STATS PACKAGE JULY 2017
REBGV STATS PACKAGE JULY 2017REBGV STATS PACKAGE JULY 2017
REBGV STATS PACKAGE JULY 2017Marcella Riccardi
 
Real Estate Board of Greater Vancouver Statistics Package October 2021
Real Estate Board of Greater Vancouver Statistics Package October 2021Real Estate Board of Greater Vancouver Statistics Package October 2021
Real Estate Board of Greater Vancouver Statistics Package October 2021VickyAulakh1
 
Metro Vancouver Statistics Report October 2021
Metro Vancouver Statistics Report October 2021Metro Vancouver Statistics Report October 2021
Metro Vancouver Statistics Report October 2021VickyAulakh1
 
Rebgv stats-pkg-june-2019
Rebgv stats-pkg-june-2019Rebgv stats-pkg-june-2019
Rebgv stats-pkg-june-2019Vicky Aulakh
 
Real Estate Board of Greater Vancouver Statistics Package - November 2021
Real Estate Board of Greater Vancouver Statistics Package - November 2021Real Estate Board of Greater Vancouver Statistics Package - November 2021
Real Estate Board of Greater Vancouver Statistics Package - November 2021VickyAulakh1
 
Rebgv stats-pkg-november-2019-f
Rebgv stats-pkg-november-2019-fRebgv stats-pkg-november-2019-f
Rebgv stats-pkg-november-2019-fVicky Aulakh
 
REBGV Statistic Package December 2020
REBGV Statistic Package December 2020REBGV Statistic Package December 2020
REBGV Statistic Package December 2020Vicky Aulakh
 
June 2017 REBGV Statistics Package
June 2017 REBGV Statistics PackageJune 2017 REBGV Statistics Package
June 2017 REBGV Statistics PackageMike Stewart
 
Real Estate Board of Greater Vancouver Statistics Package July 2021
Real Estate Board of Greater Vancouver Statistics Package July 2021Real Estate Board of Greater Vancouver Statistics Package July 2021
Real Estate Board of Greater Vancouver Statistics Package July 2021Vicky Aulakh
 
Rebgv stats-pkg-february-2020
Rebgv stats-pkg-february-2020Rebgv stats-pkg-february-2020
Rebgv stats-pkg-february-2020Vicky Aulakh
 
REBGV Statistics Package June 2020
REBGV Statistics Package June 2020REBGV Statistics Package June 2020
REBGV Statistics Package June 2020Vicky Aulakh
 

What's hot (20)

REBGV November 2015 Statistics Package Mike Stewart Realtor
REBGV November 2015 Statistics Package Mike Stewart RealtorREBGV November 2015 Statistics Package Mike Stewart Realtor
REBGV November 2015 Statistics Package Mike Stewart Realtor
 
March 2017 Rebgv Stats Package Mike Stewart
March 2017 Rebgv Stats Package Mike StewartMarch 2017 Rebgv Stats Package Mike Stewart
March 2017 Rebgv Stats Package Mike Stewart
 
September 2015 rebgv statistics package mike stewart
September 2015 rebgv statistics package mike stewartSeptember 2015 rebgv statistics package mike stewart
September 2015 rebgv statistics package mike stewart
 
February 2017 REBGV Statistics Package Mike Stewart Realtor
February 2017 REBGV Statistics Package Mike Stewart RealtorFebruary 2017 REBGV Statistics Package Mike Stewart Realtor
February 2017 REBGV Statistics Package Mike Stewart Realtor
 
October 2015 Vancouver Real Estate Board Statistics Package Mike Stewart Realtor
October 2015 Vancouver Real Estate Board Statistics Package Mike Stewart RealtorOctober 2015 Vancouver Real Estate Board Statistics Package Mike Stewart Realtor
October 2015 Vancouver Real Estate Board Statistics Package Mike Stewart Realtor
 
July 2015 rebgv stats package mike stewart
July 2015 rebgv stats package mike stewartJuly 2015 rebgv stats package mike stewart
July 2015 rebgv stats package mike stewart
 
May 2017 REBGV Stats
May 2017 REBGV Stats May 2017 REBGV Stats
May 2017 REBGV Stats
 
April 2017 Real Estate Board of Greater Vancouver Statistics Package with Charts
April 2017 Real Estate Board of Greater Vancouver Statistics Package with ChartsApril 2017 Real Estate Board of Greater Vancouver Statistics Package with Charts
April 2017 Real Estate Board of Greater Vancouver Statistics Package with Charts
 
August 2017 REBGV Stats Mike Stewart Realtor
August 2017 REBGV Stats Mike Stewart RealtorAugust 2017 REBGV Stats Mike Stewart Realtor
August 2017 REBGV Stats Mike Stewart Realtor
 
REBGV STATS PACKAGE JULY 2017
REBGV STATS PACKAGE JULY 2017REBGV STATS PACKAGE JULY 2017
REBGV STATS PACKAGE JULY 2017
 
Real Estate Board of Greater Vancouver Statistics Package October 2021
Real Estate Board of Greater Vancouver Statistics Package October 2021Real Estate Board of Greater Vancouver Statistics Package October 2021
Real Estate Board of Greater Vancouver Statistics Package October 2021
 
Metro Vancouver Statistics Report October 2021
Metro Vancouver Statistics Report October 2021Metro Vancouver Statistics Report October 2021
Metro Vancouver Statistics Report October 2021
 
Rebgv stats-pkg-june-2019
Rebgv stats-pkg-june-2019Rebgv stats-pkg-june-2019
Rebgv stats-pkg-june-2019
 
Real Estate Board of Greater Vancouver Statistics Package - November 2021
Real Estate Board of Greater Vancouver Statistics Package - November 2021Real Estate Board of Greater Vancouver Statistics Package - November 2021
Real Estate Board of Greater Vancouver Statistics Package - November 2021
 
Rebgv stats-pkg-november-2019-f
Rebgv stats-pkg-november-2019-fRebgv stats-pkg-november-2019-f
Rebgv stats-pkg-november-2019-f
 
REBGV Statistic Package December 2020
REBGV Statistic Package December 2020REBGV Statistic Package December 2020
REBGV Statistic Package December 2020
 
June 2017 REBGV Statistics Package
June 2017 REBGV Statistics PackageJune 2017 REBGV Statistics Package
June 2017 REBGV Statistics Package
 
Real Estate Board of Greater Vancouver Statistics Package July 2021
Real Estate Board of Greater Vancouver Statistics Package July 2021Real Estate Board of Greater Vancouver Statistics Package July 2021
Real Estate Board of Greater Vancouver Statistics Package July 2021
 
Rebgv stats-pkg-february-2020
Rebgv stats-pkg-february-2020Rebgv stats-pkg-february-2020
Rebgv stats-pkg-february-2020
 
REBGV Statistics Package June 2020
REBGV Statistics Package June 2020REBGV Statistics Package June 2020
REBGV Statistics Package June 2020
 

Similar to REBGV September 2016 Stats Package Mike Stewart Vancouver Realtor

Rebgv stats-pkg-august-2018
Rebgv stats-pkg-august-2018Rebgv stats-pkg-august-2018
Rebgv stats-pkg-august-2018Kathryn Huang
 
201807 rebgv-stats-package-for-media
201807 rebgv-stats-package-for-media201807 rebgv-stats-package-for-media
201807 rebgv-stats-package-for-mediaKathryn Huang
 
November 2017 rebgv stats mike stewart real estate agent
November 2017 rebgv stats mike stewart real estate agentNovember 2017 rebgv stats mike stewart real estate agent
November 2017 rebgv stats mike stewart real estate agentMike Stewart
 
Rebgv Stats Package September 2020
Rebgv Stats Package September 2020Rebgv Stats Package September 2020
Rebgv Stats Package September 2020Vicky Aulakh
 
Rebgv stats-pkg-june-2018
Rebgv stats-pkg-june-2018Rebgv stats-pkg-june-2018
Rebgv stats-pkg-june-2018Kathryn Huang
 
May-2019 Stats Package for Greater Vancouver
May-2019 Stats Package for Greater VancouverMay-2019 Stats Package for Greater Vancouver
May-2019 Stats Package for Greater VancouverBC PRIME Realty
 
Rebgv stats-pkg-may-2019
Rebgv stats-pkg-may-2019Rebgv stats-pkg-may-2019
Rebgv stats-pkg-may-2019Kathryn Huang
 
REBGV Statistics package July 2020
REBGV Statistics package July 2020REBGV Statistics package July 2020
REBGV Statistics package July 2020Vicky Aulakh
 
Rebgv stats-pkg-may-2018
Rebgv stats-pkg-may-2018Rebgv stats-pkg-may-2018
Rebgv stats-pkg-may-2018Kathryn Huang
 
Rebgv stats-pkg-january-2018 2
Rebgv stats-pkg-january-2018 2Rebgv stats-pkg-january-2018 2
Rebgv stats-pkg-january-2018 2Kathryn Huang
 
Rebgv stats-pkg-october-2019
Rebgv stats-pkg-october-2019Rebgv stats-pkg-october-2019
Rebgv stats-pkg-october-2019Vicky Aulakh
 
Rebgv stats-pkg-august-2019
Rebgv stats-pkg-august-2019Rebgv stats-pkg-august-2019
Rebgv stats-pkg-august-2019Vicky Aulakh
 
REBGV Statistics Package October 2020
REBGV Statistics Package October 2020REBGV Statistics Package October 2020
REBGV Statistics Package October 2020Vicky Aulakh
 
REBGV Statistics Package May 2020
REBGV Statistics Package May 2020REBGV Statistics Package May 2020
REBGV Statistics Package May 2020Vicky Aulakh
 
Rebgv stats-pkg-april-2018
Rebgv stats-pkg-april-2018Rebgv stats-pkg-april-2018
Rebgv stats-pkg-april-2018Kathryn Huang
 
Rebgv stats-pkg-september-2019
Rebgv stats-pkg-september-2019Rebgv stats-pkg-september-2019
Rebgv stats-pkg-september-2019Vicky Aulakh
 
Rebgv stats-pkg-july-2019
Rebgv stats-pkg-july-2019Rebgv stats-pkg-july-2019
Rebgv stats-pkg-july-2019Vicky Aulakh
 
July 2017 Real Estate Board of Greater Vancouver Stats Package Mike Stewart r...
July 2017 Real Estate Board of Greater Vancouver Stats Package Mike Stewart r...July 2017 Real Estate Board of Greater Vancouver Stats Package Mike Stewart r...
July 2017 Real Estate Board of Greater Vancouver Stats Package Mike Stewart r...Mike Stewart
 
Rebgv stats-pkg-october-2018 .pdf
Rebgv stats-pkg-october-2018 .pdf Rebgv stats-pkg-october-2018 .pdf
Rebgv stats-pkg-october-2018 .pdf Kathryn Huang
 

Similar to REBGV September 2016 Stats Package Mike Stewart Vancouver Realtor (20)

Rebgv stats-pkg-august-2018
Rebgv stats-pkg-august-2018Rebgv stats-pkg-august-2018
Rebgv stats-pkg-august-2018
 
201807 rebgv-stats-package-for-media
201807 rebgv-stats-package-for-media201807 rebgv-stats-package-for-media
201807 rebgv-stats-package-for-media
 
November 2017 rebgv stats mike stewart real estate agent
November 2017 rebgv stats mike stewart real estate agentNovember 2017 rebgv stats mike stewart real estate agent
November 2017 rebgv stats mike stewart real estate agent
 
Rebgv Stats Package September 2020
Rebgv Stats Package September 2020Rebgv Stats Package September 2020
Rebgv Stats Package September 2020
 
Rebgv stats-pkg-june-2018
Rebgv stats-pkg-june-2018Rebgv stats-pkg-june-2018
Rebgv stats-pkg-june-2018
 
May-2019 Stats Package for Greater Vancouver
May-2019 Stats Package for Greater VancouverMay-2019 Stats Package for Greater Vancouver
May-2019 Stats Package for Greater Vancouver
 
Rebgv stats-pkg-may-2019
Rebgv stats-pkg-may-2019Rebgv stats-pkg-may-2019
Rebgv stats-pkg-may-2019
 
REBGV Statistics package July 2020
REBGV Statistics package July 2020REBGV Statistics package July 2020
REBGV Statistics package July 2020
 
Rebgv stats-pkg-may-2018
Rebgv stats-pkg-may-2018Rebgv stats-pkg-may-2018
Rebgv stats-pkg-may-2018
 
Rebgv stats-pkg-january-2018 2
Rebgv stats-pkg-january-2018 2Rebgv stats-pkg-january-2018 2
Rebgv stats-pkg-january-2018 2
 
Rebgv stats-pkg-october-2019
Rebgv stats-pkg-october-2019Rebgv stats-pkg-october-2019
Rebgv stats-pkg-october-2019
 
Rebgv stats-pkg-august-2019
Rebgv stats-pkg-august-2019Rebgv stats-pkg-august-2019
Rebgv stats-pkg-august-2019
 
REBGV Statistics Package October 2020
REBGV Statistics Package October 2020REBGV Statistics Package October 2020
REBGV Statistics Package October 2020
 
Rebgv stats-pkg-october-2020
Rebgv stats-pkg-october-2020Rebgv stats-pkg-october-2020
Rebgv stats-pkg-october-2020
 
REBGV Statistics Package May 2020
REBGV Statistics Package May 2020REBGV Statistics Package May 2020
REBGV Statistics Package May 2020
 
Rebgv stats-pkg-april-2018
Rebgv stats-pkg-april-2018Rebgv stats-pkg-april-2018
Rebgv stats-pkg-april-2018
 
Rebgv stats-pkg-september-2019
Rebgv stats-pkg-september-2019Rebgv stats-pkg-september-2019
Rebgv stats-pkg-september-2019
 
Rebgv stats-pkg-july-2019
Rebgv stats-pkg-july-2019Rebgv stats-pkg-july-2019
Rebgv stats-pkg-july-2019
 
July 2017 Real Estate Board of Greater Vancouver Stats Package Mike Stewart r...
July 2017 Real Estate Board of Greater Vancouver Stats Package Mike Stewart r...July 2017 Real Estate Board of Greater Vancouver Stats Package Mike Stewart r...
July 2017 Real Estate Board of Greater Vancouver Stats Package Mike Stewart r...
 
Rebgv stats-pkg-october-2018 .pdf
Rebgv stats-pkg-october-2018 .pdf Rebgv stats-pkg-october-2018 .pdf
Rebgv stats-pkg-october-2018 .pdf
 

More from Mike Stewart

1_FINTRAC_clientinfo_2021.pdf
1_FINTRAC_clientinfo_2021.pdf1_FINTRAC_clientinfo_2021.pdf
1_FINTRAC_clientinfo_2021.pdfMike Stewart
 
Mike Stewart PREC Listing Contract
Mike Stewart PREC Listing ContractMike Stewart PREC Listing Contract
Mike Stewart PREC Listing ContractMike Stewart
 
October 2017 REBGV Stats Mike Stewart Vancouver Realtor
October 2017 REBGV Stats Mike Stewart Vancouver RealtorOctober 2017 REBGV Stats Mike Stewart Vancouver Realtor
October 2017 REBGV Stats Mike Stewart Vancouver RealtorMike Stewart
 
September 2017 rebgv statistics package mike stewart realtor
September 2017 rebgv statistics package mike stewart realtorSeptember 2017 rebgv statistics package mike stewart realtor
September 2017 rebgv statistics package mike stewart realtorMike Stewart
 
15% tax on international buyers in vancouver
15% tax on international buyers in vancouver15% tax on international buyers in vancouver
15% tax on international buyers in vancouverMike Stewart
 
REBGV Stats for December 2011 Courtesy Mike Stewart Vancouver Realtor
REBGV Stats for December 2011 Courtesy Mike Stewart Vancouver RealtorREBGV Stats for December 2011 Courtesy Mike Stewart Vancouver Realtor
REBGV Stats for December 2011 Courtesy Mike Stewart Vancouver RealtorMike Stewart
 
October 2011 REBGV Stats Mike Stewart
October 2011 REBGV Stats Mike StewartOctober 2011 REBGV Stats Mike Stewart
October 2011 REBGV Stats Mike StewartMike Stewart
 
REBGV Stats for Sept 2011 Mike Stewart
REBGV Stats for Sept 2011 Mike StewartREBGV Stats for Sept 2011 Mike Stewart
REBGV Stats for Sept 2011 Mike StewartMike Stewart
 

More from Mike Stewart (8)

1_FINTRAC_clientinfo_2021.pdf
1_FINTRAC_clientinfo_2021.pdf1_FINTRAC_clientinfo_2021.pdf
1_FINTRAC_clientinfo_2021.pdf
 
Mike Stewart PREC Listing Contract
Mike Stewart PREC Listing ContractMike Stewart PREC Listing Contract
Mike Stewart PREC Listing Contract
 
October 2017 REBGV Stats Mike Stewart Vancouver Realtor
October 2017 REBGV Stats Mike Stewart Vancouver RealtorOctober 2017 REBGV Stats Mike Stewart Vancouver Realtor
October 2017 REBGV Stats Mike Stewart Vancouver Realtor
 
September 2017 rebgv statistics package mike stewart realtor
September 2017 rebgv statistics package mike stewart realtorSeptember 2017 rebgv statistics package mike stewart realtor
September 2017 rebgv statistics package mike stewart realtor
 
15% tax on international buyers in vancouver
15% tax on international buyers in vancouver15% tax on international buyers in vancouver
15% tax on international buyers in vancouver
 
REBGV Stats for December 2011 Courtesy Mike Stewart Vancouver Realtor
REBGV Stats for December 2011 Courtesy Mike Stewart Vancouver RealtorREBGV Stats for December 2011 Courtesy Mike Stewart Vancouver Realtor
REBGV Stats for December 2011 Courtesy Mike Stewart Vancouver Realtor
 
October 2011 REBGV Stats Mike Stewart
October 2011 REBGV Stats Mike StewartOctober 2011 REBGV Stats Mike Stewart
October 2011 REBGV Stats Mike Stewart
 
REBGV Stats for Sept 2011 Mike Stewart
REBGV Stats for Sept 2011 Mike StewartREBGV Stats for Sept 2011 Mike Stewart
REBGV Stats for Sept 2011 Mike Stewart
 

Recently uploaded

Call Girls In Mayur Vihar-1 Delhi ❤️8860477959 Good Looking Escorts In 24/7 D...
Call Girls In Mayur Vihar-1 Delhi ❤️8860477959 Good Looking Escorts In 24/7 D...Call Girls In Mayur Vihar-1 Delhi ❤️8860477959 Good Looking Escorts In 24/7 D...
Call Girls In Mayur Vihar-1 Delhi ❤️8860477959 Good Looking Escorts In 24/7 D...lizamodels9
 
Shapoorji Pallonji Parkwest Sequoia Tower Bangalore.pdf
Shapoorji Pallonji Parkwest Sequoia Tower Bangalore.pdfShapoorji Pallonji Parkwest Sequoia Tower Bangalore.pdf
Shapoorji Pallonji Parkwest Sequoia Tower Bangalore.pdfashiyadav24
 
Purva Palm Hills Devanahalli, Bangalore E- Brochure.pdf
Purva Palm Hills Devanahalli, Bangalore E- Brochure.pdfPurva Palm Hills Devanahalli, Bangalore E- Brochure.pdf
Purva Palm Hills Devanahalli, Bangalore E- Brochure.pdffaheemali990101
 
Experion Elements Sector 45 Noida_Brochure.pdf.pdf
Experion Elements Sector 45 Noida_Brochure.pdf.pdfExperion Elements Sector 45 Noida_Brochure.pdf.pdf
Experion Elements Sector 45 Noida_Brochure.pdf.pdfkratirudram
 
Ajmera Prive at Juhu, Mumbai E-Brochure.pdf
Ajmera Prive at Juhu, Mumbai  E-Brochure.pdfAjmera Prive at Juhu, Mumbai  E-Brochure.pdf
Ajmera Prive at Juhu, Mumbai E-Brochure.pdfManishSaxena95
 
Eco-Efficient Living: Redefining Sustainability through Leech's Green Design ...
Eco-Efficient Living: Redefining Sustainability through Leech's Green Design ...Eco-Efficient Living: Redefining Sustainability through Leech's Green Design ...
Eco-Efficient Living: Redefining Sustainability through Leech's Green Design ...Newman George Leech
 
Call Girls in Inderpuri Delhi 💯Call Us 🔝8264348440🔝
Call Girls in Inderpuri Delhi 💯Call Us 🔝8264348440🔝Call Girls in Inderpuri Delhi 💯Call Us 🔝8264348440🔝
Call Girls in Inderpuri Delhi 💯Call Us 🔝8264348440🔝soniya singh
 
Sobha Aranya Sector 80 Gurgaon E- Brochure.pdf
Sobha Aranya Sector 80 Gurgaon E- Brochure.pdfSobha Aranya Sector 80 Gurgaon E- Brochure.pdf
Sobha Aranya Sector 80 Gurgaon E- Brochure.pdffaheemali990101
 
Call Girls in Kashmiri Gate Delhi 💯Call Us 🔝8264348440🔝
Call Girls in Kashmiri Gate Delhi 💯Call Us 🔝8264348440🔝Call Girls in Kashmiri Gate Delhi 💯Call Us 🔝8264348440🔝
Call Girls in Kashmiri Gate Delhi 💯Call Us 🔝8264348440🔝soniya singh
 
Prestige Rainbow Waters Raidurgam, Gachibowli Hyderabad E- Brochure.pdf
Prestige Rainbow Waters Raidurgam, Gachibowli Hyderabad E- Brochure.pdfPrestige Rainbow Waters Raidurgam, Gachibowli Hyderabad E- Brochure.pdf
Prestige Rainbow Waters Raidurgam, Gachibowli Hyderabad E- Brochure.pdffaheemali990101
 
Rustomjee The Panorama At Pali Hill, Bandra West, Mumbai - Brochure.pdf
Rustomjee The Panorama At Pali Hill, Bandra West, Mumbai - Brochure.pdfRustomjee The Panorama At Pali Hill, Bandra West, Mumbai - Brochure.pdf
Rustomjee The Panorama At Pali Hill, Bandra West, Mumbai - Brochure.pdfmonikasharma630
 
Call Girls In The Lalit New Delhi ❤️8860477959 Good Looking Escorts In 24/7 D...
Call Girls In The Lalit New Delhi ❤️8860477959 Good Looking Escorts In 24/7 D...Call Girls In The Lalit New Delhi ❤️8860477959 Good Looking Escorts In 24/7 D...
Call Girls In The Lalit New Delhi ❤️8860477959 Good Looking Escorts In 24/7 D...lizamodels9
 
DLF Plots Sriperumbudur in Chennai E Brochure Pdf
DLF Plots Sriperumbudur in Chennai E Brochure PdfDLF Plots Sriperumbudur in Chennai E Brochure Pdf
DLF Plots Sriperumbudur in Chennai E Brochure Pdfashiyadav24
 
Affordable and Quality Construction SVTN's Signature Blend of Cost-Efficiency...
Affordable and Quality Construction SVTN's Signature Blend of Cost-Efficiency...Affordable and Quality Construction SVTN's Signature Blend of Cost-Efficiency...
Affordable and Quality Construction SVTN's Signature Blend of Cost-Efficiency...AditiAlishetty
 
A Brief History of Intangibles in Ad Valorem Taxation.pdf
A Brief History of Intangibles in Ad Valorem Taxation.pdfA Brief History of Intangibles in Ad Valorem Taxation.pdf
A Brief History of Intangibles in Ad Valorem Taxation.pdfTim Wilmath
 
Call Girls in Nehru Place Delhi 💯Call Us 🔝8264348440🔝
Call Girls in Nehru Place Delhi 💯Call Us 🔝8264348440🔝Call Girls in Nehru Place Delhi 💯Call Us 🔝8264348440🔝
Call Girls in Nehru Place Delhi 💯Call Us 🔝8264348440🔝soniya singh
 
The Omaxe State Dwarka Delhi-broucher.pdf.pdf
The Omaxe State Dwarka Delhi-broucher.pdf.pdfThe Omaxe State Dwarka Delhi-broucher.pdf.pdf
The Omaxe State Dwarka Delhi-broucher.pdf.pdfkratirudram
 
Call Girls In Sahibabad Ghaziabad ❤️8860477959 Low Rate Escorts Service In 24...
Call Girls In Sahibabad Ghaziabad ❤️8860477959 Low Rate Escorts Service In 24...Call Girls In Sahibabad Ghaziabad ❤️8860477959 Low Rate Escorts Service In 24...
Call Girls In Sahibabad Ghaziabad ❤️8860477959 Low Rate Escorts Service In 24...lizamodels9
 
Managed Farmland Brochures to get more in
Managed Farmland Brochures to get more inManaged Farmland Brochures to get more in
Managed Farmland Brochures to get more inknoxdigital1
 

Recently uploaded (20)

Call Girls In Mayur Vihar-1 Delhi ❤️8860477959 Good Looking Escorts In 24/7 D...
Call Girls In Mayur Vihar-1 Delhi ❤️8860477959 Good Looking Escorts In 24/7 D...Call Girls In Mayur Vihar-1 Delhi ❤️8860477959 Good Looking Escorts In 24/7 D...
Call Girls In Mayur Vihar-1 Delhi ❤️8860477959 Good Looking Escorts In 24/7 D...
 
Shapoorji Pallonji Parkwest Sequoia Tower Bangalore.pdf
Shapoorji Pallonji Parkwest Sequoia Tower Bangalore.pdfShapoorji Pallonji Parkwest Sequoia Tower Bangalore.pdf
Shapoorji Pallonji Parkwest Sequoia Tower Bangalore.pdf
 
Purva Palm Hills Devanahalli, Bangalore E- Brochure.pdf
Purva Palm Hills Devanahalli, Bangalore E- Brochure.pdfPurva Palm Hills Devanahalli, Bangalore E- Brochure.pdf
Purva Palm Hills Devanahalli, Bangalore E- Brochure.pdf
 
Experion Elements Sector 45 Noida_Brochure.pdf.pdf
Experion Elements Sector 45 Noida_Brochure.pdf.pdfExperion Elements Sector 45 Noida_Brochure.pdf.pdf
Experion Elements Sector 45 Noida_Brochure.pdf.pdf
 
Ajmera Prive at Juhu, Mumbai E-Brochure.pdf
Ajmera Prive at Juhu, Mumbai  E-Brochure.pdfAjmera Prive at Juhu, Mumbai  E-Brochure.pdf
Ajmera Prive at Juhu, Mumbai E-Brochure.pdf
 
Eco-Efficient Living: Redefining Sustainability through Leech's Green Design ...
Eco-Efficient Living: Redefining Sustainability through Leech's Green Design ...Eco-Efficient Living: Redefining Sustainability through Leech's Green Design ...
Eco-Efficient Living: Redefining Sustainability through Leech's Green Design ...
 
Call Girls in Inderpuri Delhi 💯Call Us 🔝8264348440🔝
Call Girls in Inderpuri Delhi 💯Call Us 🔝8264348440🔝Call Girls in Inderpuri Delhi 💯Call Us 🔝8264348440🔝
Call Girls in Inderpuri Delhi 💯Call Us 🔝8264348440🔝
 
Sobha Aranya Sector 80 Gurgaon E- Brochure.pdf
Sobha Aranya Sector 80 Gurgaon E- Brochure.pdfSobha Aranya Sector 80 Gurgaon E- Brochure.pdf
Sobha Aranya Sector 80 Gurgaon E- Brochure.pdf
 
Call Girls in Kashmiri Gate Delhi 💯Call Us 🔝8264348440🔝
Call Girls in Kashmiri Gate Delhi 💯Call Us 🔝8264348440🔝Call Girls in Kashmiri Gate Delhi 💯Call Us 🔝8264348440🔝
Call Girls in Kashmiri Gate Delhi 💯Call Us 🔝8264348440🔝
 
Prestige Rainbow Waters Raidurgam, Gachibowli Hyderabad E- Brochure.pdf
Prestige Rainbow Waters Raidurgam, Gachibowli Hyderabad E- Brochure.pdfPrestige Rainbow Waters Raidurgam, Gachibowli Hyderabad E- Brochure.pdf
Prestige Rainbow Waters Raidurgam, Gachibowli Hyderabad E- Brochure.pdf
 
Rustomjee The Panorama At Pali Hill, Bandra West, Mumbai - Brochure.pdf
Rustomjee The Panorama At Pali Hill, Bandra West, Mumbai - Brochure.pdfRustomjee The Panorama At Pali Hill, Bandra West, Mumbai - Brochure.pdf
Rustomjee The Panorama At Pali Hill, Bandra West, Mumbai - Brochure.pdf
 
Call Girls In The Lalit New Delhi ❤️8860477959 Good Looking Escorts In 24/7 D...
Call Girls In The Lalit New Delhi ❤️8860477959 Good Looking Escorts In 24/7 D...Call Girls In The Lalit New Delhi ❤️8860477959 Good Looking Escorts In 24/7 D...
Call Girls In The Lalit New Delhi ❤️8860477959 Good Looking Escorts In 24/7 D...
 
DLF Plots Sriperumbudur in Chennai E Brochure Pdf
DLF Plots Sriperumbudur in Chennai E Brochure PdfDLF Plots Sriperumbudur in Chennai E Brochure Pdf
DLF Plots Sriperumbudur in Chennai E Brochure Pdf
 
Affordable and Quality Construction SVTN's Signature Blend of Cost-Efficiency...
Affordable and Quality Construction SVTN's Signature Blend of Cost-Efficiency...Affordable and Quality Construction SVTN's Signature Blend of Cost-Efficiency...
Affordable and Quality Construction SVTN's Signature Blend of Cost-Efficiency...
 
young call girls in Lajpat Nagar,🔝 9953056974 🔝 escort Service
young call girls in Lajpat Nagar,🔝 9953056974 🔝 escort Serviceyoung call girls in Lajpat Nagar,🔝 9953056974 🔝 escort Service
young call girls in Lajpat Nagar,🔝 9953056974 🔝 escort Service
 
A Brief History of Intangibles in Ad Valorem Taxation.pdf
A Brief History of Intangibles in Ad Valorem Taxation.pdfA Brief History of Intangibles in Ad Valorem Taxation.pdf
A Brief History of Intangibles in Ad Valorem Taxation.pdf
 
Call Girls in Nehru Place Delhi 💯Call Us 🔝8264348440🔝
Call Girls in Nehru Place Delhi 💯Call Us 🔝8264348440🔝Call Girls in Nehru Place Delhi 💯Call Us 🔝8264348440🔝
Call Girls in Nehru Place Delhi 💯Call Us 🔝8264348440🔝
 
The Omaxe State Dwarka Delhi-broucher.pdf.pdf
The Omaxe State Dwarka Delhi-broucher.pdf.pdfThe Omaxe State Dwarka Delhi-broucher.pdf.pdf
The Omaxe State Dwarka Delhi-broucher.pdf.pdf
 
Call Girls In Sahibabad Ghaziabad ❤️8860477959 Low Rate Escorts Service In 24...
Call Girls In Sahibabad Ghaziabad ❤️8860477959 Low Rate Escorts Service In 24...Call Girls In Sahibabad Ghaziabad ❤️8860477959 Low Rate Escorts Service In 24...
Call Girls In Sahibabad Ghaziabad ❤️8860477959 Low Rate Escorts Service In 24...
 
Managed Farmland Brochures to get more in
Managed Farmland Brochures to get more inManaged Farmland Brochures to get more in
Managed Farmland Brochures to get more in
 

REBGV September 2016 Stats Package Mike Stewart Vancouver Realtor