1. Pharmaceutical Research, Vol. 26, No. 12, December 2009 (# 2009)
DOI: 10.1007/s11095-009-9975-2
Research Paper
Long- and Short-Range Electrostatic Interactions Affect the Rheology of Highly
Concentrated Antibody Solutions
Ravi Chari,1 Kavita Jerath,1 Advait V. Badkar,2 and Devendra S. Kalonia1,3
Received June 3, 2009; accepted September 14, 2009; published online October 1, 2009
Purpose. To explain the differences in protein-protein interactions (PPI) of concentrated versus dilute
formulations of a model antibody.
Methods. High frequency rheological measurements from pH 3.0 to 12.0 quantitated viscoelasticity and
PPI at high concentrations. Dynamic light scattering (DLS) characterized PPI in dilute solutions.
Results. For concentrated solutions at low ionic strength, the storage modulus, a viscosity component and
a measure of PPI, is highest at the isoelectric point (pH 9.0) and lowest at pH 5.4. This profile flattens at
higher ionic strength but not completely, indicating PPI consist of long-range electrostatics and other
short-range attractions. At low concentrations, PPI are near zero at pI but become repulsive as the pH is
shifted. Higher salt concentrations completely flatten this profile to zero, indicating that these PPI are
mainly electrostatic.
Conclusions. This discrepancy occurs because long-range interactions are significant at low concen-
trations, whereas both long- and short-range interactions are significant at higher concentrations.
Computer modeling was used to calculate antibody properties responsible for long- and short-range
interactions, i.e. net charge and dipole moment. Charge-charge interactions are repulsive while dipole-
dipole interactions are attractive. Their net effect correlated with the storage modulus profile. However,
only charge-charge repulsions correlated with PPI determined by DLS.
KEY WORDS: computer modeling; dipole; highly concentrated protein solutions; protein-protein
interactions; viscosity.
INTRODUCTION (1,2). In this case, the protein may occupy less than 10% of
the solution volume, but the effects of preferential exclusion
As the active ingredient in therapeutic liquid formula- due to the co-solutes cause the protein molecules to
tions or as observed within physiological systems, proteins are sequester, resulting in localized regions where the protein is
often highly concentrated or exist in a crowded state (1,2). A highly concentrated (3). The more concentrated or crowded a
highly concentrated solution has greater than 10% of its solution, the smaller the average distance among protein
volume occupied by solute (1,2). In contrast, a crowded solute molecules and the greater the frequency of encounter
solution refers to a highly concentrated solution whose and the duration of interaction among them. For a liquid
solutes consist of the protein of interest as well as co-solutes protein formulation such as that of a therapeutic monoclonal
antibody (mAb), these increased protein-protein interactions
Electronic supplementary material The online version of this article (PPI) result from the drug’s manufacture at high concen-
(doi:10.1007/s11095-009-9975-2) contains supplementary material, trations. Such a constraint is necessary to ensure delivery of
which is available to authorized users. the active ingredient at the appropriate dose in as little
1
Department of Pharmaceutical Sciences, School of Pharmacy, volume as possible (4,5). This is especially important for
University of Connecticut, 69 North Eagleville Rd., U-3092, Storrs, subcutaneous injections, which are typically limited to 1.5 mL
Connecticut 06269, USA. or less (6). Unfortunately, PPI in such formulations can affect
2
Global Biologics, Pfizer Global Research and Development, Ches- properties such as viscosity and may increase the probability
terfield, Missouri 63017, USA. of aggregation, a process in which proteins partially unfold
3
To whom correspondence should be addressed. (e-mail: kalonia@ and irreversibly combine to form non-functional higher order
uconn.edu) complexes (7,8). Formulations with high viscosity are sub-
ABBREVIATIONS: B22, second osmotic virial coefficient; B′22, stantially more difficult to prepare and administer (5,6,9)
second osmotic virial coefficient multiplied by solute molecular
while the increased rate of aggregation decreases drug shelf-
weight; CD, circular dichroism; DLS, dynamic light scattering; EB22,
pairwise energetic interaction term; G′, storage modulus of complex
life (5). Loss of potency, changes in pharmacokinetic profile,
viscosity; G″, loss modulus of complex viscosity; IgG, immunoglobulin and compromised product safety are also concerns. With
G; kD, interaction parameter from DLS; mAb, monoclonal antibody; regard to physiological systems, certain conditions and
|η*|, magnitude of complex viscosity; PDB, Protein Databank; PPI, diseases have been found to result partly from PPI that
protein-protein interaction(s); VB22, excluded volume term. manifest in the formation and deposition of aggregate protein
2607 0724-8741/09/1200-2607/0 # 2009 Springer Science + Business Media, LLC
2. 2608 Chari, Jerath, Badkar and Kalonia
complexes within the body. Examples include ocular con- during oscillation. In particular, G′ was determined to be an
ditions such as eye cataracts (10); neurological diseases such ideal parameter for quantitating PPI, especially at high
as familial amyloid polyneuropathy, and Alzheimer’s, Parkin- concentrations (20). At low concentrations (<40 mg/ml), it is
son’s, and Huntington’s diseases (11,12); and kidney disorders not significantly different from that of water. The theory
such as light-chain deposition disease and myeloma cast behind the technique and the derivation of the moduli are
nephropathy (13,14). included in the online Supplementary Materials (21).
To address these concerns, an understanding of PPI in We have previously shown that PPI within a solution of a
concentrated solutions is needed. This would aid in establish- model IgG2 mAb differ at high versus low concentrations
ing the solution conditions under which the protein remains (20). At 120 mg/ml, G′ decreased from pH 4.0 to 5.4 then
most stable and where formulation viscosity does not hinder increased as the pH was raised to the mAb’s pI of 9.0. This
handling. Techniques such as static and dynamic light means that at high concentrations protein-protein attractions
scattering involve analyzing dilute protein solutions and decreased from pH 4.0 to 5.4 and then increased until pH 9.0.
assuming the results to be applicable at higher concentrations. In contrast, both the B22 and kD from light scattering studies
The former gives the osmotic second virial coefficient (B22), a simply decreased from pH 4.0 to 9.0. In other words, at
thermodynamic measure of the solution’s deviation from relatively low concentrations, the PPI were marked by
ideality (15). The latter yields the interaction parameter straightforward decreasing repulsions and/or increasing
(kD), which is a function of B22 and protein hydrodynamics attractions across that pH range. Furthermore, the mAb
(16). Both properties are measures of PPI at low concen- solution was opalescent at the pI at high concentrations but
trations. They are used to determine the conditions in which a became clear upon dilution. Apparently, protein association
protein remains soluble as well as those that lead to occurs at high concentrations, but reverses when the concen-
crystallization or precipitation (17). The interactions that tration is lowered. This suggests that the PPI governing that
cause protein association in the latter case(s) may also process are strongly attractive, but weaken sharply when the
eventually result in aggregation (8). This suggests a link solution is diluted (22). In fact, the attractions are mitigated
between B22 and kD and long-term protein stability. However, to the point that both B22 and kD are near zero at the pI (22).
such findings may not always be applicable to highly The above findings establish that PPI observed at high
concentrated formulations, since those properties are deter- concentrations do not always correlate with those determined
mined under dilute conditions. under dilute conditions. This is likely because the nature of
Fortunately, a high-frequency shear rheometer recently the PPI differ between the two conditions. Indeed, PPI are
developed in our laboratory allows for the direct analysis of actually composed of many underlying interactions which
highly concentrated solutions (18–20). Samples are subjected vary differently according to the distance between interacting
to an oscillatory stress applied at megahertz frequencies, and molecules (Table I) (23–25). Potentials which are short-
solution viscoelastic properties are obtained. These include ranged are typically proportional to the inverse of the sixth
the complex viscosity (|η*|), storage modulus (G′), and loss power of the distance between molecules. They are significant
modulus (G″). All three are positive and have a minimum within 0.3–0.5 nm from a protein’s surface and usually
value of zero. G′ is a measure of the energy stored in the become negligible at 0.8–1.0 nm (26). The most common
solution under stress while G″ quantitates energy dissipated examples are the van der Waals attractions, which include
a
Table I. Underlying Interactions Comprising Protein-Protein Interactions
Interaction Type at
b
Interaction Potential Minimum Energy State Range Category W(r)
−1
Electrostatic Charge-Charge Repulsive Long ∝r
(incl. repulsive term of DLVO eqn.)
Charge-Dipole Attractive Mid ∝ r −4
Charge-Induced Dipole Attractive Mid ∝ r −4
Dipole-Dipole c Attractive Short ∝ r −6
Induced Dipole-Dipole c Attractive Short ∝ r −6
Induced Dipole-Induced Dipole c Attractive Short ∝ r −6
Aromatic Stacking Attractive Short ∝ r −6
Hydrogen Bonding Attractive Short ∝ r −10
Hard Sphere (Excluded Volume) Repulsive Short ∞ for r≤(d+2σ) d
0 for r>(d+2σ) e
Osmotic Attractive Short
Hydrophobic Attractive Short
Specific Ionic Interactions Attractive Short
a
references are in the text
b
W(r) is the potential as function of the distance r between interacting species
c
van der Waals attractions
d
d is the protein diameter; σ is the hydration layer thickness
h i
e
WðrÞ ¼ À 4 p d3 ð Á kT Þ 1 À 4d þ 16d3 for ðd þ 2Þ r 2d23
3 23
3r r3
23
WðrÞ ¼ 0 for r 2d23 23
where d23 =(d + ion diameter +2σ)/2 and ρ=ion conc.
3. Long- Short-Range Electrostatics Affect Rheology 2609
dipole-dipole, dipole-induced dipole, and induced dipole- themselves, regardless of their effect on pH, can affect mAb
induced dipole interactions. They are attractive because solution behavior, buffers were prepared with low concen-
molecules in solution can align themselves to complement trations of the buffer salts and adjusted to the target ionic
their dipoles. Other short-range interactions include hydro- strength with sodium chloride. Specifically, buffers were
phobic interactions, hydrogen bonding, specific ionic attrac- prepared at concentrations of 1.0 mM or 10 mM with Milli-
tions, hard sphere or excluded volume potential, and the QTM grade water and adjusted to an ionic strength of 4 mM
osmotic attraction potential (24). In certain models of protein or 300 mM, respectively, with sodium chloride. They were
self-association, the first three, along with the van der Waals then passed through 0.1 μm filters (Millipore, Billerica, MA,
attractions, may be grouped under an associative potential USA) to remove foreign particles. mAb solutions were
(22,24). The potential assumes a square well form when a prepared by multiple dialysis cycles against the selected
specific association site of one protein is within a certain buffer and were concentrated to greater than 120 mg/ml
distance of another such site on a second protein. The with Millipore Amicon Ultra centrifugation dialysis tubes.
osmotic attraction potential arises from the exclusion of salt mAb concentration was determined by UV absorption with a
between closely contacting proteins (24). Thus, it is significant Cary 50-Bio UV-Vis spectrophotometer (Varian Inc., Palo
at high salt concentrations ( 100 mM ionic strength) and Alto, CA, USA). The extinction coefficient is 1.48 at 280 nm
small inter-protein distances. Long-range potentials are for a 0.1% mAb solution. The pH of the dialyzed solutions
proportional to the inverse of the distance between two was observed and, if necessary, carefully adjusted to the
proteins and can be significant even at distances of 1.5–2.0 nm target pH with sodium hydroxide or hydrochloric acid. The
(26). The most common example is electrostatic charge- solutions were then diluted with their respective buffers to
charge repulsion governed by Coulomb’s law. Mid-range obtain the desired concentrations. We should note that the
interactions are simply a combination of the two. At low ionic strengths of the samples were not examined after
concentrations where the distances among molecules are dialysis. At low buffer ionic strength, the Donnan effect may
large, only long-range interactions are expected to affect the cause the sample ionic strength to differ from 4 mM.
overall PPI (22). However, as the concentration is increased Nevertheless, any such variation will still result in an ionic
and inter-protein distances decrease, the long-range interac- strength significantly less than the contrasting high ionic
tions become stronger but the short-range interactions strength condition of 300 mM.
become significant (22). Their net effect determines the
overall PPI. In fact, it is not uncommon for the different High Frequency Rheology Studies
interactions to oppose each other (27).
In this study, we investigate the contributions of the The high frequency shear rheometer used in this study
various long- and short-range interactions to overall PPI in consists of a 10 MHz resonance frequency piezoelectric
solutions of our model IgG2 mAb at different pHs and at low quartz crystal sandwiched between gold-plated electrodes
and high concentrations. In particular, we focus on the roles (International Crystal Manufacturing Company, Oklahoma
of electrostatic charge-charge repulsions, dipole-dipole attrac- City, OK, USA) which are connected to a Hewlett Packard
tions, and specific region-region interactions. Expanding on HP4194A impedance analyzer (Agilent Technologies, Palo
the work of Saluja et al. (20,22), solutions of the mAb were Alto, CA, USA). The impedance analyzer subjects the crystal
further characterized over a wider pH range. High frequency to an alternating current, causing it to vibrate according to the
rheology analyses, dynamic light scattering and circular piezoelectric effect. Electrical properties including resistance,
dichroism studies, and zeta-potential measurements were reactance, and impedance are obtained. By applying solution
performed. In addition, a 3D computer model of the mAb atop the crystal, changes in those values can then be used to
was created to study the distribution of its charges. Net determine the G′ and G″ of the solution (18–20). |η*| is the
charges, dipole moments, dipole orientations, and electro- square root of the sum of the squares of the two moduli
static potential surfaces at different pHs of the whole mAb divided by the resonance frequency (see online Supplemen-
and its Fc and Fab fragments were calculated in silico. From tary Materials). Small quantities of mAb solutions (20 μl)
this data, the magnitudes of the long- and short-range from 20 to 120 mg/ml at different pHs and ionic strengths
interactions were quantitated in order to assess their specific were analyzed at 25°C. All samples were analyzed in
contributions to mAb PPI in solution. triplicate and the results averaged. More details regarding
the development and use of the rheometer can be found in
MATERIALS AND METHODS previous studies by our group (18–20,22).
Materials and Sample Preparation Circular Dichroism Studies
The human IgG2 monoclonal antibody analyzed was mAb secondary and tertiary structure information at
donated by Pfizer Biologics (St. Louis, MO, USA) and has a different pHs and ionic strengths were determined from far-
molecular weight of 144 kD. Its pI is 9.0 as determined by gel and near-UV circular dichroism (CD) spectra, respectively,
isoelectric focusing. All reagents were obtained from Fisher which were acquired with a Jasco 710 polarimeter (JASCO
Scientific (Fair Lawn, NJ, USA). The buffer reagents are as Inc., Easton, MD, USA). Far- and near-UV CD spectra were
follows: acetic acid-sodium acetate for pH 4.0 and 5.4, obtained from mAb solutions of 0.5 and 1.0 mg/ml, respec-
monobasic-dibasic sodium phosphate for pH 7.4, TRIS for tively. Each spectrum is the average of at least five scans each
pH 9.0, glycine for pH 10.0 and 11.0, and arginine for pH 12.0. with a resolution of 0.5 nm collected at 20 nm per minute.
To minimize the possibility that the different buffer species Spectra of the buffers were also obtained and subtracted from
4. 2610 Chari, Jerath, Badkar and Kalonia
the spectra of protein samples in the corresponding buffer. conjugate gradient until it was less than 0.1 kcal∙(Å∙mol)−1.
The spectra were then normalized for concentration and the Computer models of the Fc and Fab fragments were made by
results reported in molar ellipticities (degrees∙cm2∙dmol−1). removing a portion of the hinge region. The “structural” hinge
in human IgG1 encompasses residues 221–237 (32). This
Zeta Potential Measurements corresponds to the mAb sequence CCVECPPCPAPPVAGP.
Its deletion results in the three fragments. The atomic
Zeta potentials of 3.0 mg/ml mAb solutions at different coordinates of the mAb and its fragments were saved in the
pHs and 4 mM ionic strength were determined at 25°C by PDB format for further analysis.
laser Doppler electrophoresis using a Zetasizer Nano ZS unit The software PROPKA (33,34) was used to calculate the
(Malvern Instruments Ltd., Worcestershire, UK). Zeta poten- pKas of the ionizable residues. PROPKA utilizes a fast
tials were calculated from the mAb mean electrophoretic empirical approach that determines pKas based on the local
mobility, which is obtained by the method of Phase Analysis environment of residues within the protein structure.
Light Scattering. All scans were performed in monomodal MAb and mAb fragment net charges were determined as
mode which involves fast electric field reversals to separate a function of pH. The net charge is the sum of the charges of
the effect of electro-osmosis from the movements of the all ionizable residues. The charges of aspartic and glutamic
proteins. All samples were analyzed in triplicate and the acids, tyrosines, cysteines, and carboxyl termini were calcu-
results averaged. lated with a modified Henderson-Hasselbalch equation that
gives values between zero and −1:
Dynamic Light Scattering
10ðpHÀpKaÞ
negative residue charge ¼ À ð1Þ
Dynamic light scattering (DLS) studies were performed 1 þ 10ðpHÀpKaÞ
on mAb solutions of 4.0, 8.0, and 12.0 mg/ml at different pHs Similarly, lysine, arginine, histidine, and amino termini
and ionic strengths at 25°C with the same Zetasizer Nano ZS charges are determined according to a similar equation that
unit used to obtain zeta potentials. Prior to measurement, yields values between zero and +1:
protein solutions were centrifuged with a mini-centrifuge to
settle any dust particles. Measurements at pH 10.0 and 11.0 10ðpHÀpKaÞ
were performed in a glove bag under nitrogen gas to positive residue charge ¼ 1 À ð2Þ
1 þ 10ðpHÀpKaÞ
minimize any changes in pH due to atmospheric carbon
dioxide. A total of 10 scans of 5 s each were recorded for each Partial charges of individual atoms are required to
sample. All samples were analyzed in triplicate and the determine the dipoles and electrostatic potential surfaces.
results averaged. Mutual diffusion coefficients were obtained Atomic radii are also needed for calculation of the potential
and plotted as a function of concentration. surfaces. Most atomic partial charges and all atomic radii
were obtained from the CHARMM 27 forcefield’s topology
Computer Modeling file (35). However, atomic partial charges for neutral amino
termini, neutral carboxyl termini, negatively charged cys-
A 3D mAb computer model was constructed by modify- teines, negatively charged tyrosines, and neutral arginines are
ing the X-ray crystallographic structure of an IgG2aκ murine not included. These were calculated with the program
mAb, mAb 231 (PDB ID: 1IGT), obtained from the RCSB VCharge (36,37), which utilizes a fast algorithm to accurately
Protein Data Bank (28,29). The molecular modeling pro- reproduce partial charge values similar to those from
grams Hyperchem Professional 7.5.1 (30) and Discovery quantum mechanical (Hartree-Fock 6-31G*) calculations,
Studio 2.1 (31) were used. The sugar units were first removed but independent of molecular conformation. To model
from the 1IGT Fc fragment. Next, the mAb amino acid proteins at a specific pH, ionizable residues are typically set
sequence was compared with the 1IGT sequence to find the in a fully ionized state with a±1 charge or fully neutralized
optimal homology match. 1IGT residues that differed were state with zero charge. Fractional charges are not considered.
converted to those of the mAb with Hyperchem Professio- This is because an ionizable proton can only be shown as
nal’s Mutate command, while insertions were performed with present or absent in a computer model. Therefore, the partial
the Replace command. The side chains of pairs of cysteine charges of atoms of an ionizable residue will sum to either
residues in close proximity were then linked with disulfide zero or ±1. However, this approximation is not appropriate,
bonds. Since the mAb is human-derived, its structure was especially when the pH is very close to an ionizable residue’s
configured such that four of the disulfide bonds are located pKa. In such situations, the residue’s charge will be between
within the hinge region (32). Next, the mAb hinge region zero and ±1. To address this, the Henderson-Hasselbalch
adjacent to the Fab fragments was shortened by removing ten equations were used to adjust the atomic partial charges
residues (5 per heavy chain) corresponding to a deletion based upon the user-defined pH. For example, the partial
between 1IGT and the mAb. This subsequently required charge of an aspartic acid carboxyl oxygen is −0.55 when
positioning those fragments closer to the remaining hinge protonated and −0.76 when ionized. If the pH is equal to the
region in order to reestablish the bonds between them. residue’s pKa, the partial charge will be −0.655.
Finally, in order to relieve any steric clashes among atoms, The dipole of the mAb and its fragments is a vector given
all sidechains, inserted residues, and residues within 6Å of by
deleted residues were subjected to minimization first by X
steepest descent until the gradient was less than 1.0 kcal∙ dipole ¼ qi ð ri ÀcÞ
^ ^
ð3Þ
(Å∙mol)−1 followed by the calculation of the Polak-Ribiere i
5. Long- Short-Range Electrostatics Affect Rheology 2611
where qi is the atomic partial charge of the ith atom, bi r reduced to 5% of their magnitude. In addition, since these
contains the x, y, and z coordinates of the ith atom, and b is
c computations required manipulating vast amounts of numer-
the center of mass vector which is determined according by ical data, scripts and programs were written in-house in the
P JAVA 1.4.2 programming language (42) to facilitate these
awi Âbi
r operations.
i
b¼
c ð4Þ
MW
RESULTS
where awi is the atomic weight of the ith atom and MW is the
protein molecular weight. Since the dipole of a charged High Frequency Rheology Studies
protein can vary with the protein’s location, the protein is
centered about a reference point, commonly the center of Rheological profiles of mAb solutions at different pHs
mass (38). The dipole moment is simply the magnitude of the and 4 mM or 300 mM ionic strength are shown in Fig. 1.
dipole and is equal to the square root of the sum of the Previous studies determined the profile from pH 4.0 to the pI
squares of the dipole’s x, y, and z values. of 9.0 (20,22) while solutions at pHs 10.0, 11.0, and 12.0 were
Electrostatic potential values were determined with the also analyzed in this study. Due to solution shear thinning at
Adaptive Poisson Boltzmann Solver program (APBS) (39). high oscillating frequencies, the complex viscosities are lower
The program requires PQR files with atomic coordinates and than viscosities typically obtained with a gravitational-based
atomic partial charges of the mAb or its fragments. PQR files capillary viscometer (6,23). Regarding studies performed at
were generated from the PDB files by a program written in- 4 mM ionic strength, a mAb concentration of 20 mg/ml has a
house. APBS also requires an input file of user-defined negligible contribution to |η*| over the pH range. PPI as
parameters. Default parameter settings were obtained with quantitated by G′ are zero, and only G″ contributes to the
the program PDB2PQR (40), which can generate APBS viscosity. (As mentioned, G′ is relatively insensitive at low
input files. Modified settings include the protein and solvent concentrations.) G″ is almost exclusively due to the solvent,
relative dielectric constants (4.0 and 78.54), the ion concen- since the viscosity remains close to 1.0 cP, the value for water.
tration (0.010 M), and the number of grid points (x=y=z=161). As the concentration is increased, differences in |η*| versus
Finally, the software VMD was used to create 3D pH become apparent. At 60 mg/ml, |η*| is still mainly due to
graphical representations of the mAb, its dipoles, and G″ since G′ remains near zero except at the extremes of the
electrostatic potential surfaces (41). In order to display the pH range. At 120 mg/ml, |η*| is still primarily due to G″, but
dipoles within the same scale as the proteins, the dipoles are differences in PPI versus pH become apparent as indicated by
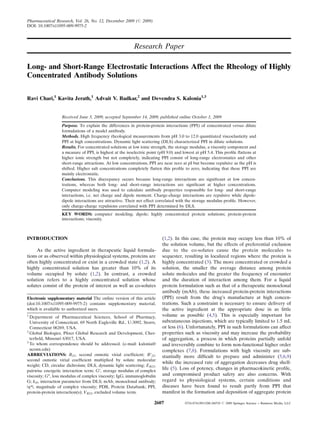
Fig. 1. Rheological properties as a function of pH at different mAb concentrations and ionic strengths. Left column: 4 mM ionic strength. Right
column: 300 mM ionic strength. Note the scale difference between the G′ and G″ y-axes. For all plots, error bars not visible are smaller than the
symbol.
6. 2612 Chari, Jerath, Badkar and Kalonia
the G′ versus pH trend. Also, all three rheological properties 4.0, the spectra are only marginally less negative. At pHs 10.0
reach a maximum at the pI of 9.0 and decrease at pHs and 11.0, an apparent decrease in the intensity of the negative
immediately surrounding it. Finally, an interesting phenom- bands is observed, although the spectra fine structure is
enon is seen around pH 4.0 to 5.4. At 120 mg/ml, |η*| and G″ maintained. This indicates that the protein is slightly
are minimal at pH 4.0 while G′ is minimal at pH 5.4. At expanded under these conditions. The decrease in intensity
60 mg/ml, |η*| and G″ are minimal at pH 4.7, while G′ is still is slightly greater at higher ionic strengths for pH 11.0. At pH
minimal at pH 5.4. These properties increase immediately 12.0, the spectra are highly positive and featureless, indicating
above and below those pHs. Studies at 300 mM ionic strength a significant loss of tertiary structure. Interestingly, gelation of
show that high salt concentrations reduce the variation in |η*|, mAb solutions was observed at this pH above 100 mg/ml, but
G′, and G″ over the pH range (Fig. 1, right column). The not at other pHs, perhaps due to the unfolding. Overall, the
curves begin to level, with lower values increasing and higher CD studies show that the mAb exists in a partially or
values decreasing. This is most apparent at 120 mg/ml. completely unfolded state at pH 12.0. The protein is only
slightly unfolded at pHs 10.0 and 11.0 and remains in the
native state at pHs 4.0 to 9.0.
Circular Dichroism Studies
Fig. 2 shows the far- and near-UV CD spectra at pHs Zeta Potential Studies
10.0, 11.0, and 12.0 and 4 mM and 300 mM ionic strength
along with previously published results (20). The far UV-CD Fig. 3 A shows the results of zeta potential measurements
spectra show a strong negative band at 217 nm for all pHs and at different pHs and 4 mM ionic strength. Due to technique
ionic strengths, indicating that the mAb is composed primar- refinement, the results are more reliable than those from
ily of β-sheets. mAb secondary structure is constant at pHs Saluja et al. (20). The mAb potential is most positive at pH
4.0, 9.0, 10.0, and 11.0. At pH 12.0 the spectra show 4.0 and decreases with increasing pH. From pH 4.0 to 9.0, the
broadening at 217 nm and a shift towards lower wavelengths, potential’s decrease is fairly linear and crosses 0.0 mV at pH
indicating secondary structure changes. Within the region of 7.5. Interestingly, this neutral point differs from the pI of 9.0.
260 to 300 nm of the near UV-CD spectra at both low and From pH 9.0 to 11.0, a much sharper decrease is observed,
high ionic strengths, the most negative bands are seen at pH resulting in a zeta potential of −44.0 mV at pH 11.0 as
9.0, indicating that the mAb is most compact at its pI. At pH compared to a potential of only +21.0 mV at pH 4.0.
Fig. 2. Far-UV (left column) and near-UV (right column) CD spectra of mAb solutions at 4 and 300 mM ionic strength and different pHs. For
all plots, error bars not visible are smaller than the symbol.
7. Long- Short-Range Electrostatics Affect Rheology 2613
Computer Modeling: Calculated Net Charge and Dipole
Moments
Fig. 4 A shows the calculated net charge as a function of
pH for the mAb and its fragments. The calculated pI is 9.0,
similar to the experimental pI, with values of 8.1 and 9.3 for
the Fc and Fab fragments. Although the net charge of the
mAb and its fragments decreases from pH 5.0 to 10.0, the
drop is very gradual as compared to the change from pH 0.0
to 5.0 and pH 10.0 to 14.0. This profile is consistent with the
mAb zeta potentials which decrease gradually from pH 4.0 to
9.0, then sharply from pH 9.0 to 11.0.
The calculated dipole moments of the mAb and its
fragments versus pH are shown in Fig. 4 B. The maximum
mAb dipole moment occurs at pH 2.0 and decreases rapidly
as the pH is increased to 5.0. It then remains fairly level until
pH 10.0, where it begins to rise rapidly to a peak at pH 12.0.
However, the dipole moment at pH 12.0 is lower than at pH
2.0. Since an antibody is comprised of three loosely connected
fragments subject to fluctuation, the mAb dipole moment is
also expected to fluctuate. Therefore, it is also informative to
examine the dipole moments of the fragments which are fairly
rigid in contrast to the mAb as a whole (also refer to the 2nd
and 4th row of Fig. 5). From pH 0.0, the Fc dipole moment
peaks at pH 3.0 and decreases until about pH 5.0. From there,
it steadily increases to its maximum value at pH 11.5
Fig. 3. (A) Zeta potentials of mAb solutions at 4 mM ionic strength and
different pHs. (B) kD versus pH from DLS measurements at 4 mM and
300 mM ionic strength. For all plots, error bars not visible are smaller
than the symbol.
Dynamic Light Scattering Studies
In DLS, a solution is exposed to an incident light source,
and the variation in intensity of the scattered light is
measured over time (23). The fluctuations in intensity result
from the random motion of solute molecules and are
quantified by the experimentally determined mutual diffusion
coefficient (Dm) (16). A more rapid change in intensity
translates to greater Dm values and thus faster diffusion
(16). Fig. 3 B shows the kD values obtained from DLS studies
conducted at pHs 10.0 and 11.0 and at 4 mM and 300 mM
ionic strengths as well as previously reported results at other
pHs (22). As mentioned, the interaction parameter kD is a
measure of PPI at low concentrations (16). A more positive
kD correlates with greater repulsive PPI while a more negative
kD correlates with greater attractive PPI (16,22). The kD
values were obtained by plotting Dm versus concentration (c)
and fitting a regression line to the following equation (16):
Dm ¼ D0 þ ðkD Â D0 Þc ð5Þ
D0 is the diffusion coefficient of an isolated solute molecule at
infinite dilution, i.e. zero c. From pH 4.0 to 7.4 at 4 mM ionic
strength, kD decreases but remains positive, indicating that
repulsive PPI are decreasing. At pH 7.4, kD is close to zero
with attractive and repulsive PPI balanced. At the pI of 9.0,
kD is negative and net PPI is attractive. From the pI to pH Fig. 4. (A) Calculated net charge vs. pH for the mAb and its
11.0, kD becomes positive and increases, meaning that PPI are fragments. (B) Calculated dipole moment vs. pH for the mAb and its
repulsive again. At 300 mM ionic strength, charge screening fragments. Charges and dipole moments of the two Fabs have been
by the salt ions results in kD values close to zero at all pHs. averaged.
8. 2614 Chari, Jerath, Badkar and Kalonia
Fig. 5. Variation in the calculated electrostatic potential surfaces (first and third row) and dipoles of the
Fab and Fc fragments (second and fourth row) with pH. Potential Surfaces: Red or blue contours in space
indicate the −1 or +1 kT/e potential. White/gray surfaces indicate the mAb van der Waals surface. Dipoles:
Positive ends are blue and negative ends are red.
whereupon it starts to decrease again. In contrast, the average configuration is expected since the Fabs share the same
Fab dipole moment increases gradually from pH 3.0 to 5.0 amino acid sequence and are located on opposite sides of an
and stays level until pH 8.0. After this, it drops to its axis of symmetry that bisects the Fc fragment. This may be an
minimum level at pH 10.0 and then rises to a peak at pH 12.0. evolutionary design meant to keep an antibody’s antigen
recognition site open for binding. If Fabs within the same
antibody approached each other, like two hands of a clock
Computer Modeling: Visualization of Dipole Moments, nearing midnight, the positive ends of their dipoles would
Dipole Orientations, and Electrostatic Potential Surfaces repel each other.
The fragments’ dipole orientations correspond to the
Fig. 5 shows the Fab and Fc dipole orientations and the development and change in the electrostatic potential surfa-
mAb electrostatic potential surfaces. Interestingly, the frag- ces. The red contour in space represents the location of the
ments’ dipoles are oriented with the positive (blue) ends −1 kT/e potential surface, while the blue shows the location of
pointing outwards and the negative (red) ends pointing the +1 kT/e surface. At the lowest pH, the abundance of blue
towards the center hinge region except for pHs 3.0 and 4.0 and relative absence of red shows the effect due to the
where the Fc dipole is oppositely oriented. This flip means predominance of positive charges. As the pH increases,
that the Fc dipole no longer negates the net dipole of the Fab negative (red) surfaces start to develop and the amount of
fragments. Not surprisingly, this corresponds to the dramatic blue decreases. Red colors appear first in areas in which the
increase in the mAb dipole moment from pH 5.0 to 2.0 as negative ends of the dipoles reside. This is especially notable
seen in Fig. 4 B. In contrast, the relatively low and constant at the center hinge region. As the pH continues to increase,
mAb dipole moment from pH 5.0 to 10.0 is due to the the negative potentials begin to dominate, and the positive
fragments’ dipoles canceling each other. Also notable is that (blue) potentials start to disappear. The blue colors disappear
the Fab dipoles have a mirror image orientation. In fact, this last in areas where the positive ends of the dipoles are
9. Long- Short-Range Electrostatics Affect Rheology 2615
located. At the pI of 9.0, the red and blue surfaces are evenly while ξ1 is obtained from the virial expansion of the
distributed. It is interesting that significant dipoles can still concentration-dependent frictional coefficient ξ (16):
exist at either high or low pHs where positive or negative
charges predominate. x ¼ x 0 ð1 þ x 1 c þ . . . Þ ð7Þ
Thus, the concern arises as to how the hydrodynamic
DISCUSSION term affects interpretation of kD with regard to PPI. For
example, B′22 could be positive or zero, indicating repulsive
As mentioned earlier, characterizing PPI within highly or no net PPI, but subtraction of the hydrodynamic term may
concentrated protein solutions typically involves utilizing yield a negative kD, thus suggesting attractive PPI. To address
techniques that require low concentrations and then assuming this, consider that B′22 is composed of a pairwise energetic
the results are applicable at high concentrations. Because such interaction term (EB22) and an excluded volume term (VB22)
assumptions may not be valid, we developed a high frequency (44). After variable substitution and grouping of the volume
shear rheometer for direct PPI analysis at high concentrations and frictional terms, kD is given by
via the G′ values. Nevertheless, those techniques—i.e. CD and À Á
DLS studies, zeta potential measurements, and computer kD ¼ 2EB22 þ 2VB22 À x1 À n sp ð8Þ
modeling which can only process a single mAb model—can
still yield information to explain the PPI quantitated by G′. From this equation and from the kD values at high ionic
This is because certain protein features such as net charge are strength, we can determine that the volume and frictional
independent of concentration. Also, such information terms in the parenthesis sum to zero at the pHs studied and
obtained at low concentrations is essentially measures of that kD is due only to energetic mAb-mAb interactions. At
long-range interactions. 300 mM ionic strength, the kD values are essentially zero, or
Analysis of the rheology of highly concentrated mAb are not significantly different from zero. This means that 2
solutions (Fig. 1) showed that electrostatic charge-charge EB22 and (2VB22 - ξ1 - νsp) sum to zero. Due to high salt and
repulsions comprise a significant portion of the PPI. Such low mAb concentration, 2EB22, which is primarily due to
interactions are long-ranged (Table I) and are mitigated by electrostatic repulsions, is negligible. Therefore, (2VB22 - ξ1 -
the presence of salt. Indeed, the change in the rheological νsp) must also be essentially zero. When the ionic strength is
properties from 4 mM to 300 mM ionic strength at 120 mg/ml reduced, 2EB22 will become significant, but since the volume
show the effect of charge screening due to salt. With and frictional terms are not likely to be affected by salt, they
contributions from electrostatics greatly reduced, the rheo- will not change. Thus, kD is strictly a function of EB22, or the
logical properties show greater influence from protein volume through-space energy of attraction or repulsion between
and concentration, and therefore their variation versus pH is mAbs.
reduced. However, since their profiles are not entirely flat, With regard to dilute mAb solutions, only electrostatic
non-electrostatic interactions, which have likely always been interactions contribute significantly to PPI. This is supported
present, are now more apparent. This is observed from the by the kD versus pH profile obtained from DLS studies (Fig. 3
PPI as quantitated by G′ at high salt concentration. These B). Increasing the ionic strength reduces the kD values to zero
residual interactions are likely short-range attractions since at all pHs studied, indicating that the PPI are mainly
only electrostatic charge-charge repulsion is long-ranged electrostatic and thus shielded by salt. In addition, in contrast
(Table I). Thus, at high concentrations and low ionic strength, to the G′ versus pH profile at 120 mg/ml and 4 mM ionic
both long- and short-range interactions can contribute strength, PPI as quantitated by kD are minimal at the pI. In
significantly to overall PPI. In fact, this is supported by the the former case, PPI are greatest at the pI because although
observation that the rheological properties are greatest at the charge-charge repulsions are zero due to zero net charge, the
pI at low ionic strength and decrease at the immediately effect of short-range attractions is still significant. These
surrounding pHs. At the pI, the mAb net charge is zero, and, attractions may also be responsible for the G′ reversal point
therefore, charge-charge repulsions are minimal. This means at pH 5.4, which is absent in the kD versus pH plot. However,
their opposition of the short-range attractions is also minimal, at low concentrations where inter-protein distances are large,
which allows those interactions to have maximum effect, those interactions are very weak and do not influence kD to a
resulting in the highest |η*| and G′. Not surprisingly, for many significant degree. This means that charge-charge repulsions
other proteins, the phenomenon of minimum solubility occurs almost fully constitute the PPI at low concentrations.
at the pI for the same reasons (43). Furthermore, this is supported by a plot of the absolute
Before discussing the DLS results and their quantitation values of the calculated mAb net charge versus pH (Fig. 6B)
of PPI at low concentrations, one issue regarding the kD which closely matches the kD versus pH profile (Fig. 3B). (It
values requires addressing. Previous studies have stated that is unclear why the absolute values of the zeta potentials in
kD is composed of a thermodynamic term minus a hydro- Fig. 3A do not correspond similarly to the kD versus pH
dynamic term (16): profile. They also do not follow the G′ versus pH trend.
Chloride ion binding may shift the zeta potential neutral point
À Á
kD ¼ 2B022 À x1 þ n sp ð6Þ to pH 7.4 from the isoelectric pI of 9.0, yet it apparently does
not affect the rheology or PPI which correspond more closely
The thermodynamic term B′22 is the second osmotic to the calculated net charge profile. Perhaps for this mAb, ion
virial coefficient of the solution multiplied by the solute’s binding only affects zeta potential measurements. It should be
molecular weight. The latter two terms comprise the hydro- noted, however, that a closer inspection of the kD values at
dynamic term. νsp is the partial specific volume of the solute, the pI show that the short-range interactions do have a
10. 2616 Chari, Jerath, Badkar and Kalonia
range interactions, especially at high concentrations, need to
be discussed. Many of these interactions in Table I, such as
induced dipole-induced dipole attractions, are difficult to
quantify. Therefore, we will mainly focus on the contributions
of dipole-dipole interactions while conceding that other short-
range interactions may also be present to a significant
degree. Fig. 6 shows, as a function of pH, (A) the G′ values
at 120 mg/ml and 4 mM or 300 mM ionic strength from
Fig. 1, (B) the absolute values of calculated mAb net
charges from Fig. 4A, and (C) calculated dipole moments
from Fig. 4B. G′ quantitates PPI, while the dipole moments
and the absolute values of the net charges indicate the
strength of short-range attractions and long-range electro-
static repulsions, respectively. From pH 4.7 to 9.0, the
attractions (mAb dipole moment) remain constant while
the repulsions (mAb net charge absolute value) decrease.
Around pH 4.7 to 5.4, repulsions and attractions roughly
cancel, and the G′ is lowest at 4 mM ionic strength. As the
pH increases, repulsions decrease, allowing the attractions to
have a greater effect. At the pI of 9.0, the repulsion is zero,
and only the short-range attraction is present. Thus, G′ is
highest here. At pH 3.0 and 4.0, repulsions are greatest, but
the dipole moments are significantly greater than at other
pHs. Therefore, the increase in G′ from pH 5.4 to 3.0 is a
result of attractions increasing at a greater rate than
repulsions. From pH 9.0 to 10.0, attractions remain constant
but repulsions increase, resulting in lower net attractions
and a lower G′. From pH 10.0 to 11.0, the dipole moment
increases considerably while repulsions also increase. Based
on the observations at pH 3.0 and 4.0, the attraction from
the larger dipole moment should greatly counter the
increased repulsion, resulting in an increase in G′. Yet the
G′ decreases. This phenomenon may be due to the addi-
tional effect of mAb unfolding. CD studies established that
the protein becomes increasingly unfolded from pH 10.0 to
12.0 but remains in the native state from pH 4.0 to 9.0
(Fig. 2). Nevertheless, it is encouraging to see that our
modeling results correspond to the experimental G′ values
within the pharmaceutically relevant pH range of 4.0 to 8.0.
The effect of higher ionic strength on G′ can be explained
by assuming that the attractions are shielded to a lesser
Fig. 6. Contributions of long-range repulsions and short-range
attractions to PPI. (A) G′ versus pH at 120 mg/ml. G′ quantitates
PPI. Error bars not visible are smaller than the symbol. (B) Absolute
value of calculated mAb net charge versus pH. Net charge quantitates
repulsion. (C) Dipole moment versus pH. Dipole moment quantitates
attraction.
measurable effect, although miniscule, at low concentrations.
At 4 mM ionic strength, the kD is slightly negative, indicating
slight attractions. At 300 mM ionic strength, those attractions
are diminished, and kD is not significantly different from zero. Fig. 7. Putative atomic view of mAb interactions in a highly
At pHs other than 9.0, the attractions are likely still present concentrated solution at the pI. Based on the computer modeling
but are simply negated by the charge-charge repulsions. results, the negative potentials are centered (red) and the positive
Having established the nature and behavior of the long- potentials are peripheral (blue). Black lines indicate attractions
range interactions, the additional contributions of the short- between areas of positive and negative potential.
11. Long- Short-Range Electrostatics Affect Rheology 2617
degree than the electrostatic repulsions. This is because the trations and low ionic strength, long-range electrostatic
magnitude of van der Waals attractions due to dipole-dipole interactions in the form of charge-charge repulsions are
or dipole-induced dipole interactions are less affected by present. Short-range interactions such as dipole-dipole attrac-
higher salt concentrations (45). Therefore, a significant tions are also significant. In contrast, at low concentrations
reduction of the repulsions combined with a slight to where inter-protein distance is large, only electrostatic
moderate decrease in attractions, especially those below repulsions are significant. Also, PPI at high concentrations
pH 4.7 and above pH 10.0, would result in less variation in may also originate from interactions between fragments of
PPI across the pH range. Indeed, the trend of G′ versus pH different mAb units which can lead to network formation.
flattens from 4 mM to 300 mM ionic strength. These findings have two main implications for the
In assessing the contribution of long- and short-range formulation of highly concentrated protein therapeutics. First,
interactions to PPI, we also considered each fragment’s charge when using techniques that require low sample concentra-
distribution. Fig. 6 C shows that the Fc dipole moment from pH tions to characterize formulations, we have shown that one
3.0 to 9.0 follows the trend of G′ versus pH at 120 mg/ml and should be cautious of assuming the results are similar at high
4 mM ionic strength (Fig. 6 A). This is not observed for the Fab concentrations because more types of interactions are signifi-
dipole moments (Fig. 4 B), which suggests that short-range cant at this condition. Therefore, direct characterization of
interactions due to the Fc fragment could be the main high concentration formulations is desired when possible. The
contributor to PPI at and below pH 9.0. Above pH 9.0, mAb second implication involves the benefits of computer model-
unfolding, as mentioned in the previous paragraph, may also ing for mAb design. The technique has the potential for
significantly influence PPI. In fact, if mAb charge-charge predicting PPI at high concentrations, albeit after further
repulsions (Fig. 6 B) and attractions quantitated by the Fc refinement and rigorous validation. In this study, our mAb
dipole (Fig. 6 C) are summed, it would result in a net PPI trend was modeled, and the net charges and dipole moments versus
even better resembling the G′ versus pH curve at 4 mM ionic pH were calculated. The former corresponds to long-range
strength below pH 10.0 (Fig. 6 A). Furthermore, the Fc dipole repulsions while the latter to short-range attractions. The
flips from pH 4.0 to 5.4 (Fig. 5), which corresponds to the combination of these interactions correlated well with the
reversal point in the G′ versus pH plot at 4 mM ionic strength. experimentally determined G′ values in the pharmaceutically
Based on these observations, one may argue that the short- relevant pH range of 4.0 to 8.0. Therefore, by modeling a
range interactions should have been represented by the Fc therapeutic mAb, one can predict the effect of specific
dipole moment instead of that of the whole mAb. However, mutations on overall PPI. For example, one may find that
this ignores interactions due to the Fab fragments. mutating an aspartic acid to an asparagine in the Fc region
At this point, we cannot propose a definitive mechanism may reduce the calculated mAb dipole moment. This would
of how our mAbs interact at high concentrations. Although correspond to lower dipole-dipole attractions. Such mutations
the calculated dipole moments of the mAb and Fc fragment can be performed at locations away from the antigen
both appear to be sufficient measures of short-range inter- recognition site in order to predict if PPI can be lowered
actions below pH 10.0, the role of other such interactions without affecting mAb efficacy. Eventually, such predictions
need to be explored. For example, fluorescence studies with a may result in new formulations with lower viscosity and/or a
hydrophobic probe have previously shown that the mAb’s reduced potential for aggregation.
hydrophobicity is constant from pH 4.0 to 9.0. Hydrophobic
attractions are very weak and are easily countered by
electrostatic repulsions (27). Yet it might be significant at ACKNOWLEDGEMENTS
the pI where those repulsions are minimal or at pHs 10.0 to
12.0 where the mAb has a tendency to unfold. In addition, The authors thank Pfizer Inc. for donating the mAb for
studies on different antibodies have determined that high this study and for partial financial support of this work.
viscosity originates from Fab-Fab interactions among the
antibodies, resulting in a network at high concentrations (9).
In contrast, our research suggests that both long- and short- REFERENCES
range interactions are involved and that the Fc fragment may
play a greater role than the Fabs in determining PPI and 1. Fulton AB. How crowded is the cytoplasm? Cell. 1982;30:345–7.
rheology for our mAb. In addition, based on the electrostatic 2. Zimmerman SB, Minton AP. Macromolecular crowding: bio-
potential surface distributions (Fig. 5), we propose that our chemical, biophysical, and physiological consequences. Annu
Rev Biophys Biomol Struct. 1993;22:7–65.
mAb forms a slightly different network at its pI at high 3. Minton AP. Influence of macromolecular crowding upon the
concentrations (Fig. 7). The network arises from dipole stability and state of association of proteins: Predictions and
alignment among different fragments of different mAb observations. J Pharm Sci. 2005;94:1668–75.
molecules and from interactions among areas of positive 4. Wang W, Singh S, Zeng DL, King K, Nema S. Antibody
and negative potential (pH 9.0 in Fig. 5). structure, instability, and formulation. J Pharm Sci. 2006;96:1–26.
5. Shire SJ, Shahrokh Z, Liu J. Challenges in the development of
high protein concentration formulations. J Pharm Sci. 2004;2004:
1390–402.
CONCLUSIONS 6. Liu J, Nguyen MD, Andya JD, Shire SJ. Reversible self-
association increases the viscosity of a concentrated monoclonal
antibody in aqueous solution. J Pharm Sci. 2005;94:1928–40.
In this study, we have shown that the PPI in solutions of 7. Saluja A, Kalonia DS. Nature and consequences of protein-
our model mAb are based on contributions from long- and protein interactions in high protein concentration solutions. Int J
short-range interactions among the proteins. At high concen- Pharm. 2008;358:1–15.
12. 2618 Chari, Jerath, Badkar and Kalonia
8. Zhang J, Liu XY. Effect of protein–protein interactions on 25. Elcock AH, McCammon JA. Calculation of weak protein-
protein aggregation kinetics. J Chem Phys. 2003;119:10972–6. protein interactions: the pH dependence of the second virial
9. Kanai S, Liu J, Patapoff TW, Shire SJ. Reversible self-association coefficient. Biophys J. 2001;80:613–25.
of a concentrated monoclonal antibody solution mediated by 26. Torshin IY. Bioinformatics in the post-genomic era: the role of
Fab-Fab interaction that impacts solution viscosity. J Pharm Sci. biophysics. New York, USA: Nova Science; 2006.
2008;97:4219–27. 27. Al-Shakhshira RH, Regnierb FE, Whitec JL, Hema SL. Con-
10. Meehan S, Berry Y, Luisi B, Dobson CM, Carver JA, MacPhee tribution of electrostatic and hydrophobic interactions to the
CE. Amyloid fibril formation by lens crystallin proteins and its adsorption of proteins by aluminium-containing adjuvants.
implications for cataract formation. J Biol Chem. 2004;279:3413– Vaccine. 1995;13:41–4.
9. 28. Harris LJ, Larson SB, Hasel KW, McPherson A. Refined
11. Harper JD, Lansbury PT. Models of amyloid seeding in structure of an intact IgG2a monoclonal antibody. Biochem.
Alzheimer’s disease and scrapie: mechanistic truths and physio- 1997;36:1581–97.
logical consequences of the time-dependent solubility of amyloid 29. RCSB Protein Data Bank. http://www.pdb.org (accessed Decem-
proteins. Annu Rev Biochem. 1997;66:385–407. ber 2008).
12. Koo EH, Lansbury PT, Kelly JW. Amyloid diseases: abnormal 30. Hyperchem Professional 7.5.1 (Hypercube, Inc., Gainesville,
protein aggregation in neurodegeneration. Proc Natl Acad Sci Florida, USA).
USA. 1999;96:9989–90. 31. Discovery Studio 2.1 (Accelrys, Inc., San Diego, California,
13. Ganeval D, Noël LH, Preud’homme JL, Droz D, Grünfeld JP. USA).
Light-chain deposition disease: its relation with AL-type amyloi- 32. Nezlin R. The immunoglobulins: structure and function. London,
dosis. Kidney Int. 1984;26:1–9. UK: Academic; 1998.
14. Buxbaum JN, Chuba JV, Hellman GC, Solomon A, Gallo GR. 33. Li H, Robertson AD, Jensen JH. Very fast empirical prediction and
Monoclonal immunoglobulin deposition disease: light chain and interpretation of protein pKa values. Proteins. 2005;61:704–21.
light and heavy chain deposition diseases and their relation to 34. Bas DC, Rogers DM, Jensen JH. Very fast prediction and
light chain amyloidosis. Clinical features, immunopathology, and rationalization of pKa values for protein-ligand complexes.
molecular analysis. Ann Intern Med. 1990;112:455–64. Proteins. 2008;73:765–83.
15. Zimm BH. Applications of the methods of molecular distribution 35. Brooks BR, Bruccoleri RE, Olafson BD, States DJ, Swamina-
to solutions of large molecules. J Chem Phys. 1946;14:164–79. than S, Karplus M. CHARMM: a program for macromolecular
16. Teraoka I. Polymer solutions: an introduction to physical proper- energy, minimization, and dynamics calculations. J Comp Chem.
ties. New Jersey, USA: Wiley-IEEE; 2002. 1983;4:187–17.
17. George A, Chiang Y, Guo B, Arabshahi A, Cai Z, Wilson WW. 36. Gilson MK, Gilson HSR, Potter MJ. Fast assignment of accurate
Second virial coefficient as predictor in protein crystal growth. partial atomic charges. An electronegativity equalization method
Methods Enzymol. 1997;276:100–10. that accounts for alternate resonance forms. J Chem Inf Comput
18. Saluja A, Kalonia DS. Measurement of fluid viscosity at micro- Sci. 2003;43:1982–97.
liter volumes using quartz impedance analysis. AAPS PharmSci- 37. Chen W, Huang J, Gilson MK. Identification of symmetries in
Tech. 2004;5:e47. molecules and complexes. J Chem Inf Comput Sci. 2004;44:1301–13.
19. Saluja A, Kalonia DS. Application of ultrasonic shear rheometer 38. Felder CE, Prilusky J, Silman I, Sussman JL. A server and
to characterize rheological properties of high protein concen- database for dipole moments of proteins. Nucleic Acids Res.
tration solutions at microliter volume. J Pharm Sci. 2005;94:1161– 2007;35:W512–21.
8. 39. Baker NA, Sept D, Joseph S, Holst MJ, McCammon JA.
20. Saluja A, Badkar AV, Zeng DL, Nema S, Kalonia DS. Electrostatics of nanosystems: Application to microtubules and
Application of high-frequency rheology measurements for the ribosome. Proc Natl Acad Sci USA. 2001;98:10037–41.
analyzing protein-protein interactions in high protein concen- 40. Dolinsky TJ, Nielsen JE, McCammon JA, Baker NA.
tration solutions using a model monoclonal antibody (IgG2). J PDB2PQR: an automated pipeline for the setup, execution,
Pharm Sci. 2006;95:1967–83. and analysis of Poisson-Boltzmann electrostatics calculations.
21. Hackley VA, Ferraris CF. Guide to rheological nomenclature for Nuc Acids Res. 2004;32:W665–7.
liquid-based particle systems. Maryland, USA: NIST; 2001. 41. Humphrey W, Dalke A, Schulten K. VMD—visual molecular
22. Saluja A, Badkar AV, Zeng DL, Nema S, Kalonia DS. Ultrasonic dynamics. J Molec Graphics. 1996;14:33–8.
storage modulus as a novel parameter for analyzing protein- 42. JAVA 1.4.2 programming language (Sun Microsystems, Inc.,
protein interactions in high protein concentration solutions: Santa Clara, California, USA).
correlation with static and dynamic light scattering measure- 43. Shaw KL, Grimsley GR, Yakovlev GI, Makarov AA, Pace CN.
ments. Biophys J. 2007;92:234–44. The effect of net charge on the solubility, activity, and stability of
23. Hiemenz PC, Rajagopalan R. Principles of colloid and surface ribonuclease Sa. Protein Sci. 2001;10:1206–15.
chemistry. New York, USA: Marcel Dekker; 1997. 44. Neal BL, Asthagiri D, Lenhoff AM. Molecular origins of osmotic
24. Curtis RA, Prausnitz JM, Blanch HW. Protein-protein and second virial coefficients of proteins. Biophys J. 1998;75:2469–77.
protein-salt interactions in aqueous protein solutions containing 45. Papp E, Fricsovszky G, Meszéna G. Electrodichroism of purple
concentrated electrolytes. Biotechnol Bioeng. 1998;57:11–21. membrane. Biophys J. 1986;49:1089–100.