Call Girls In Panjim North Goa 9971646499 Genuine Service
Short-Term Private Equity Performance Begins to Improve in Q2 2003 With Little Movement in Venture Capital Performance
1. Jeanne Metzger, NVCA, 703-524-2549 ext. 116, jmetzger@nvca.org
Joshua Radler, Thomson Venture Economics, 973-353-7139, joshua.radler@thomson.com
Short-Term Private Equity Performance Begins to Improve in Q2 2003 With Little
Movement in Venture Capital Performance
The Private Equity Asset Class Remains a Strong Long Term Investment
October 14, 2003--Newark, NJ— One-year private equity returns improved slightly from historically low
levels, as the one-year private equity return was –6.9% for the period ending June 30, 2003 compared to a
-15.5% for the period ending March 31, 2003, according to Thomson Venture Economics and the National
Venture Capital Association. Venture capital performance for Q2 was virtually unchanged at -27.4% from
the previous quarter. Distributions back to limited partners approximately doubled from the prior quarter,
but total realizations remain below traditional levels.
Long-term performance figures, the best indicator of fund performance, remained strong at 26.2% and
14.2% respectively. These figures are most relevant because they best match the life span of venture
capital and private equity funds. By spreading the risk over multiple phases of the business cycle, venture
capital and private equity funds have been able to consistently outperform the public markets over the long
term.
Positive indicators for future improvements in private equity fund performance were led by the NASDAQ’s
strong showing in Q2, with a one-year return of 10.8%. NASDAQ is an important indicator of the future
health of the venture capital market as most venture-backed companies either go public on NASDAQ or are
acquired by NASDAQ listed companies. In addition, the number of private equity backed IPO’s has also
been increasing, with most of them currently trading above their offering price.
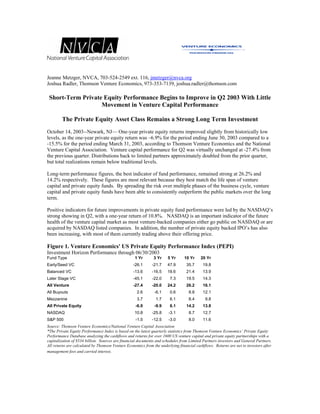
Figure 1. Venture Economics' US Private Equity Performance Index (PEPI)
Investment Horizon Performance through 06/30/2003
Fund Type 1 Yr 3 Yr 5 Yr 10 Yr 20 Yr
Early/Seed VC -26.1 -21.7 47.9 35.7 19.8
Balanced VC -13.6 -16.5 18.6 21.4 13.9
Later Stage VC -45.1 -22.0 7.3 19.5 14.3
All Venture -27.4 -20.0 24.2 26.2 16.1
All Buyouts 2.6 -6.1 0.6 8.8 12.1
Mezzanine 3.7 1.7 6.1 8.4 9.8
All Private Equity -6.9 -9.9 6.1 14.2 13.8
NASDAQ 10.8 -25.8 -3.1 8.7 12.7
S&P 500 -1.5 -12.5 -3.0 8.0 11.6
Source: Thomson Venture Economics/National Venture Capital Association
*The Private Equity Performance Index is based on the latest quarterly statistics from Thomson Venture Economics’ Private Equity
Performance Database analyzing the cashflows and returns for over 1600 US venture capital and private equity partnerships with a
capitalization of $534 billion. Sources are financial documents and schedules from Limited Partners investors and General Partners.
All returns are calculated by Thomson Venture Economics from the underlying financial cashflows. Returns are net to investors after
management fees and carried interest.
2. Mark Heesen, president of the National Venture Capital Association explained, “It’s too early to claim that
a recovery is in the near future. However, it is encouraging to see that exit activity is on the rise. Recovery
of venture capital performance will lag the public markets considerably. It will take some time for venture-
backed companies to build their customer and revenue base. As they grow and reach profitability, an IPO
or acquisition will then become possible and will lead to the realization of returns for investors.”
According to Jesse Reyes, Director of Thomson Venture Economics' US Branch, quot;As we entered the
second quarter this year, you have to remember that the entire financial community was affected by the
volatile geopolitical environment surrounding the war in Iraq. The venture and buyouts industries are not
totally immune to these factors. As a result the rebound we saw in the second quarter in performance as
well as investments was probably delayed by these events. Given the general trends in the economy and
new found optimism in the technology sector, we expect performance to continue to improve in the coming
months. The good news is that the distribution spigot began to flow again, albeit at levels below a year ago,
but at least some exits are being realized.quot;
Figure 2. Distributions of Capital to Limited Partners During Recent Quarters
Private Equity* ($Mil) Venture Capital ($Mil)
Period Total Dist Total Dist
2002-1 6,574.112 1,656.826
2002-2 8,844.059 1,543.051
2002-3 3,183.769 691.044
2002-4 5,711.136 2,495.240
2003-1 3,260.203 634.968
2003-2 6,203.418 1,123.387
Source: Thomson Venture Economics/National Venture Capital Association
*Private Equity = Venture Capital + Buyouts + Mezzanine + Other Private Equity
Distributions are the cash or value of stock disbursed to the limited partners of a fund.
An analysis of the Cumulative Paid in to Committed Capital (PICC) shows that venture capital takedowns
have increased at a slow rate, which illustrates that venture capitalists are making a cautious effort in
investing their limited partners’ capital. As shown below the PICC for the combined last five vintage years
has increased at a steady pace showing that the dry powder, albeit at a small rate, is starting to be taken
down and invested. The PICC is a determinate of the total available capital. An increase in the PICC will
signal that the total amount available will decrease.
Figure 3. Cumulative PICC For Venture Capital Vintage Year 1999-2003 Funds
PICC
Inception To Pooled Avg
06/30/2002 0.47
09/30/2002 0.49
12/31/2002 0.50
03/31/2003 0.52
06/30/2003 0.53
Source: Thomson Venture Economics/National Venture Capital Association
Thomson Venture Economics, a Thomson Financial company, is the foremost information provider for
equity professionals worldwide. Venture Economics offers an unparalleled range of products from
directories to conferences, journals, newsletters, research reports, and the Venture Expert™ database. For
over 35 years, Venture Economics has been tracking the venture capital and buyouts industry. Since 1961,
3. it has been a recognized source for comprehensive analysis of investment activity and performance of the
private equity industry. Venture Economics maintains a long-standing relationship within the private equity
investment community, in-depth industry knowledge, and proprietary research techniques. Private equity
managers and institutional investors alike consider Venture Economics information to be the industry
standard. For more information about Venture Economics, please visit www.ventureeconomics.com.
Thomson Financial
Thomson Financial (www.thomsonfinancial.com), is a US$2 billion provider of information and
technology solutions to the worldwide financial community. Through the widest range of products and
services in the industry, Thomson Financial helps clients in more than 70 countries make better decisions,
be more productive and achieve superior results. Thomson Financial is part of The Thomson Corporation
(www.thomson.com), a leading provider of integrated information solutions to business and professional
markets worldwide. The Corporation reported 2002revenues of US$7.8 billion and its common shares are
listed on the New York and Toronto stock exchanges (NYSE: TOC; TSX: TOC).
The National Venture Capital Association (NVCA) represents 450 venture capital and private equity
organizations. NVCA's mission is to foster the understanding of the importance of venture capital to the
vitality of the U.S. and global economies, to stimulate the flow of equity capital to emerging growth
companies by representing the public policy interests of the venture capital and private equity communities
at all levels of government, to maintain high professional standards, facilitate networking opportunities and
to provide research data and professional development for its members. For more information visit
www.nvca.org.