08. financial ratio tree (deb sahoo)
•
0 gefällt mir•340 views


Empfohlen
Weitere ähnliche Inhalte
Was ist angesagt?
Was ist angesagt? (20)
Andere mochten auch
Andere mochten auch (6)
Ähnlich wie 08. financial ratio tree (deb sahoo)
Ähnlich wie 08. financial ratio tree (deb sahoo) (20)
Mehr von Deb Sahoo, MBA(Finance), MS(EE), BTech(EE),
Mehr von Deb Sahoo, MBA(Finance), MS(EE), BTech(EE), (20)
Kürzlich hochgeladen
Kürzlich hochgeladen (20)
08. financial ratio tree (deb sahoo)
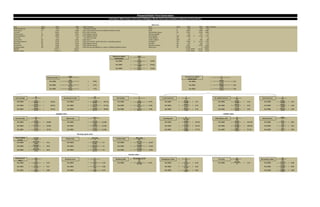
- 1. Item Short 2004 2003 2002 Comment Item Short 2004 2003 2002 Comment Profit bf. Int & tax PBIT 824 729 629 (PnL account) Stock S 398 362 325 Total capital TC 5,492 5,000 5,441 Total assets less current liabilities (Balance sheet) Debt D 2,865 2,308 2,807 Turnover T 8,302 8,019 8,135 (PnL account) Shareholders Equity SE 2,454 2,108 3,081 Current assets CA 3,870 3,246 3,761 (Balance sheet) Interest payable I 136 137 117 Current liabilities CL -1,885 -1,711 -1,751 (Balance sheet) Cost of goods CoG 5,260 0 5,118 5,191 Net Profit P 552 507 153 (PnL account) Trade debtors TD 31 32 22 Gross profit GP 3,042 2,901 2,944 Note 2 Trade creditors TRC 210 202 200 Operating expences OE -2,218 -2,172 -2,343 Gross profit - profit of the year = operating expences Purchases PU 5,260 0 5,118 5,191 Net assets NA 2,454 2,108 3,081 (Balance sheet) Divident Div 263 246 239 Fixed assets FA 3,498 3,435 3,381 (Balance sheet) Number of shares SH 2,267 2,294 2,842 Working capital WC 1,985 1,535 2,010 Net current liabilities (c. assets-c. liabilities) (Balance sheet) Share price SP 0.2780 0 0.3850 EBITDA 1107.9 1007.9 4.79% #### 4.51% 4.00% EBITDA margin 13.35% # 12.57% 2.53% #### 2.51% 2.45% PBIT TC 824 5,492 729 5,000 629 5,441 PBIT T T TC 824 8,302 8,302 5,492 729 8,019 8,019 5,000 629 8,135 8,135 5,441 GP OE P T T T T T T FA WC TC 3,042 -2,218 552 8,302 8,302 8,302 8,302 8,302 8,302 3,498 1,985 5,492 2,901 -2,172 507 8,019 8,019 8,019 8,019 8,019 8,019 3,435 1,535 5,000 2,944 -2,343 153 8,135 8,135 8,135 8,135 8,135 8,135 3,381 2,010 5,441 CA CA-S D D PBIT CL CL D+CnR SE I 3,870 3,472 2,865 2,865 824 -1,885 -1,885 5,319 2,454 136 3,246 2,885 2,308 2,308 729 -1,711 -1,711 4,416 2,108 137 3,761 3,435 2,807 2,807 629 -1,751 -1,751 5,888 3,081 117 S x365 TD x365 TRC x365 CoG T PU 145,270 11,133 76,723 5,260 8,302 5,260 132,057 11,717 73,584 5,118 8,019 5,118 118,735 7,994 72,854 5,191 8,135 5,191 Div P Div p share /(1-t) P SP NA SH Div SP SH EPS SH 263 552 0.13 552 0.2780 2,454 2,267 263 0.2780 2,267 0 2,267 246 507 507 2,108 2,294 246 2,294 2,294 239 153 153 3,081 2,842 239 2,842 2,842 Financial Ratio Tree Generation | Deb Sahoo | MBA, Finance, University of Michigan | MS, EE, University of Southern California | B-Tech, EE, IIT | Ratio Tree Return on capital employment = For 2004 = = 15.0% For 2003 = = 14.6% For 2002 = = 11.6% Return on sales = Turnover on capital emplayment = For 2004 = = 9.9% For 2004 = = 1.51 For 2002 = = 9.1% For 2003 = = 1.60 For 2002 = = 7.7% For 2002 = = 1.50 Gross margin = Overheads to sales = Net margin = F. asset turnover = W. Capital turnover = Asset turnover = For 2004 = = 36.6% For 2004 = = -26.7% For 2004 = = 6.7% For 2004 = = 2.37 For 2004 = = 4.18 For 2004 = = 1.51 For 2003 = = 36.2% For 2003 = = -27.1% For 2003 = = 6.3% For 2003 = = 2.33 For 2003 = = 5.22 For 2003 = = 1.60 For 2002 = = 36.2% For 2002 = = -28.8% For 2002 = = 1.9% For 2002 = = 2.41 For 2002 = = 4.05 For 2002 = = 1.50 Liquidity ratios Stability ratios Current ratio = Quick ratio = Gearing ratio = Debt/Equity ratio = Interest cover = For 2004 = = (2.05) For 2004 = = (1.84) For 2004 = = 53.9% For 2004 = = 116.7% For 2004 = = 6.05 For 2003 = = (1.90) For 2003 = = (1.69) For 2003 = = 52.3% For 2003 = = 109.4% For 2003 = = 5.32 For 2002 = = (2.15) For 2002 = = (1.96) For 2002 = = 47.7% For 2002 = = 91.1% For 2002 = = 5.38 Working capital ratios Stock holding period = Debtor days = Creditor days = For 2004 = = 27.6 For 2004 = = 1.3 For 2004 = = 14.59 For 2003 = = 25.8 For 2003 = = 1.5 For 2003 = = 14.38 For 2002 = = 22.9 For 2002 = = 1.0 For 2002 = = 14.03 Investor ratios Dividents per share = Divident cover = Divident yield = Earnings per share = P/E ratio = Net assets p. share = For 2004 = = 0.12 For 2004 = = 2.10 For 2004 = = 0.46 For 2004 = = 0.24 For 2004 = = 1.14 For 2004 = = 1.08 For 2003 = = 0.11 For 2003 = = 2.06 For 2003 = = 0.22 For 2003 = = 0.92 For 2002 = = 0.08 For 2002 = = 0.64 For 2002 = = = = 1.080.05 For 2002