1. Asia Pacific Equity Research
02 December 2010
Spicejet Ltd
Initiation
Overweight
SPJT.BO, SJET IN
Ready to take off
Price: Rs82.15
Price Target: Rs115.00
India
Airlines
Princy Singh
AC
(91-22) 6157 3587
princy.singh@jpmorgan.com
J.P. Morgan India Private Limited
Dinesh S. Harchandani, CFA
(91-22) 6157-3583
dinesh.x.harchandani@jpmorgan.com
J.P. Morgan India Private Limited
Corrine Png
(65) 6882-1514
corrine.ht.png@jpmorgan.com
J.P. Morgan Securities (Asia Pacific) Limited
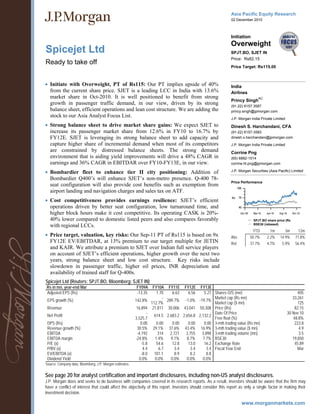
40
70
100
Rs
Dec-09 Mar-10 Jun-10 Sep-10 Dec-10
Price Performance
SPJT.BO share price (Rs
BSE30 (rebased)
YTD 1m 3m 12m
Abs 50.7% 2.2% 14.9% 71.8%
Rel 37.7% 4.7% 5.9% 56.4%
Spicejet Ltd (Reuters: SPJT.BO, Bloomberg: SJET IN)
Rs in mn, year-end Mar FY09A FY10A FY11E FY12E FY13E
Adjusted EPS (Rs) -13.35 1.70 6.63 6.56 5.27
EPS growth (%) 142.8%
-
112.7%
289.7% -1.0% -19.7%
Revenue 16,894 21,811 30,006 43,041 50,308
Net Profit
-
3,525.7
614.5 2,683.2 2,656.8 2,132.2
DPS (Rs) 0.00 0.00 0.00 0.00 0.00
Revenue growth (%) 30.5% 29.1% 37.6% 43.4% 16.9%
EBITDA -4,192 314 2,721 3,755 3,898
EBITDA margin -24.8% 1.4% 9.1% 8.7% 7.7%
P/E (x) -5.8 54.6 12.8 13.0 16.2
P/BV (x) 4.4 6.7 3.4 3.4 3.4
EV/EBITDA (x) -8.0 101.1 8.9 8.2 8.8
Dividend Yield 0.0% 0.0% 0.0% 0.0% 0.0%
Shares O/S (mn) 405
Market cap (Rs mn) 33,261
Market cap ($ mn) 725
Price (Rs) 82.15
Date Of Price 30 Nov 10
Free float (%) 48.8%
3-mth trading value (Rs mn) 223.8
3-mth trading value ($ mn) 4.9
3-mth trading volume (mn) 3.5
BSE30 19,850
Exchange Rate 45.89
Fiscal Year End Mar
Source: Company data, Bloomberg, J.P. Morgan estimates.
See page 20 for analyst certification and important disclosures, including non-US analyst disclosures.
J.P. Morgan does and seeks to do business with companies covered in its research reports. As a result, investors should be aware that the firm may
have a conflict of interest that could affect the objectivity of this report. Investors should consider this report as only a single factor in making their
investment decision.
• Initiate with Overweight, PT of Rs115: Our PT implies upside of 40%
from the current share price. SJET is a leading LCC in India with 13.6%
market share in Oct-2010. It is well positioned to benefit from strong
growth in passenger traffic demand, in our view, driven by its strong
balance sheet, efficient operations and lean cost structure. We are adding the
stock to our Asia Analyst Focus List.
• Strong balance sheet to drive market share gains: We expect SJET to
increase its passenger market share from 12.6% in FY10 to 16.7% by
FY12E. SJET is leveraging its strong balance sheet to add capacity and
capture higher share of incremental demand when most of its competitors
are constrained by distressed balance sheets. The strong demand
environment that is aiding yield improvements will drive a 48% CAGR in
earnings and 36% CAGR in EBITDAR over FY10-FY13E, in our view.
• Bombardier fleet to enhance tier II city positioning: Addition of
Bombardier Q400’s will enhance SJET’s non-metro presence. Q-400 78-
seat configuration will also provide cost benefits such as exemption from
airport landing and navigation charges and sales tax on ATF.
• Cost competitiveness provides earnings resilience: SJET’s efficient
operations driven by better seat configuration, low turnaround time, and
higher block hours make it cost competitive. Its operating CASK is 20%-
40% lower compared to domestic listed peers and also compares favorably
with regional LCCs.
• Price target, valuation, key risks: Our Sep-11 PT of Rs115 is based on 9x
FY12E EV/EBITDAR, at 13% premium to our target multiple for JETIN
and KAIR. We attribute a premium to SJET over Indian full service players
on account of SJET’s efficient operations, higher growth over the next two
years, strong balance sheet and low cost structure. Key risks include
slowdown in passenger traffic, higher oil prices, INR depreciation and
availability of trained staff for Q-400s.
2. 2
Asia Pacific Equity Research
02 December 2010
Princy Singh
(91-22) 6157 3587
princy.singh@jpmorgan.com
Company Description P&L sensitivity metrics EBITDA EPS
FY11E impact (%) impact (%)
Load Factor 77%
Impact of each +1% increase 5% 15%
Yields (Rs/RPKM) 3.45
Impact of each +1% increase 4% 11%
Fuel Price (Rs/Litre) 40.1
Impact of each +1% increase -2% -6%
Source: J.P. Morgan estimates.
Fuel sensitivity analysis
Spicejet is a low-cost Indian airline service operator. It
was engaged mostly in domestic airline services and
has recently started an international service with flights
from Chennai to Colombo and from New Delhi to
Kathmandu. It was the most profitable airline in the
country for FY10. The company operates 122 flights
daily to over 19 domestic destinations.
Load factor (%) and yields (Rs/RPKM) trends
Source: J.P. Morgan estimates.
PT and valuation
analysis
Our Sep-2011 price target of Rs115 is based on
EV/EBITDAR of 9.0x on FY12E EBITDAR, at a 13%
premium to our target multiple for JETIN and KAIR.
Source: J.P. Morgan estimates.
EPS: J.P. Morgan vs consensus
Spicejet is currently trading at a 6.3x FY12E
EV/EBITDAR, at a 12% discount to Asian LCC’s and
6% discount to Global LCCs.
Rs J. P. Morgan Consensus vs. Cons
FY11E 6.6 5.8 15%
FY12E 6.6 7.9 -17%
FY13E 5.3 9.5 -45%
Source: Bloomberg and J.P. Morgan.
Key risks include a lower-than-expected passenger
demand, higher jet fuel prices, an increase/changes in
airport charges regulations, adaptability of Bombardiers
to Indian conditions or non-availability/ delays in
getting trained staff, and a weaker rupee.
Table 1: SJET vs. Indian air carriers vs. Asian sector average valuation comparison
Rtg Ccy Price P/E (x) P/BV (x) EV/EBITDA (x) EV/EBITDAR (x) EPS growth (%) ROE (%)
Airline 2010E 2011E 2010E 2011E 2010E 2011E 2010E 2011E 2010E 2011E 2010E 2011E
Jet OW INR 805.4 26.6 8.6 3.5 2.5 9.7 7.4 8.6 7.5 130% 575% 7.7% 24.1%
Kingfisher OW INR 66.8 nm 11.9 nm nm 46.8 6.3 13.0 7.4 nm nm nm 12.0%
Spicejet OW INR 82.2 12.4 12.5 3.4 3.4 11.8 8.6 8.5 6.3 325% -1% 36.5% 26.9%
Asian sector Average 11.4 10.6 2.1 1.7 8.4 6.8 8.1 6.9 177% 21% 22.5% 18.5%
Asia Pacific LCCs 14.2 9.9 2.7 2.0 9.9 7.3 8.7 7.2 177% 43% 23% 22%
Global LCCs 16.3 11.4 2.4 1.8 8.7 6.8 8.0 6.8 128% 43% 16% 17%
Source: Bloomberg, company reports, J.P. Morgan estimates. Consensus estimates for non-rated companies. *EV/EBITDAR has been adjusted for the capitalization of aircraft operating leases.
**For Spicejet , Jet Airways and Kingfisher 2010E indicates year ending Mar-2011 and 2011E indicates year ending Mar-2012. Valuations are as on COB 30/11/2010.
EBITDAR (Rs%Change PAT (Rs M%Change
-5% 10350.1 9.1 3400.8 28.0
-4% 10179.3 7.3 3252.0 22.4
-3% 10008.6 5.5 3103.2 16.8
-2% 9837.8 3.7 2954.4 11.2
-1% 9657.6 1.8 2805.6 5.6
Base Case - Rs40.1/litre 9486.8 0.0 2656.8 0.0
1% 9316.0 -1.8 2508.1 -5.6
2% 9135.8 -3.7 2359.3 -11.2
3% 8965.0 -5.5 2210.5 -16.8
4% 8794.3 -7.3 2061.7 -22.4
5% 8623.5 -9.1 1912.9 -28.0
3. 3
Asia Pacific Equity Research
02 December 2010
Princy Singh
(91-22) 6157 3587
princy.singh@jpmorgan.com
Figure 1: Spicejet route map
Source: Company website
4. 4
Asia Pacific Equity Research
02 December 2010
Princy Singh
(91-22) 6157 3587
princy.singh@jpmorgan.com
Investment thesis
We initiate coverage on SJET with Overweight rating and price target of Rs115
based on 9x FY12E EV/EBITDAR. SJET is a leading LCC in India with current
passenger market share of 13.6%. It currently operates a fleet of 22 aircraft, operating
125 daily flights connecting 20 domestic destinations and two international
destinations.
We believe that SJET is well positioned to gain market share amidst a strong pick-up
in traffic demand as industry capacity additions lag behind. SJET is leveraging its
strong balance sheet to aggressively add capacity and capture higher share of
incremental demand, in a scenario when most of its competitors are constrained to
add capacities on account of highly geared balance sheets. As a result, we estimate
that SJET will be able to increase its passenger market share from 12.6% in FY10 to
16.7% by FY12E. We forecast an earnings CAGR of 48% and EBITDAR CAGR of
36% over FY10-FY13 driven by an increase in fleet size, higher load factors and
improvement in yields.
SJET has recently placed an order for 15 Bombardier Q400 regional turbo-prop
aircraft (with an option to acquire another 15), delivery of which will start in June
2011. The Q400s will have 78 seat configurations and will strengthen SJET’s tier II
and tier III city presence. Rising affluence is driving strong demand from tier II and
tier III cities and current fares connecting non-metro cities are remunerative. In
addition, Q400 turbo-props are fuel-efficient and will also be exempt from domestic
airport navigation and landing charges (current regulation provides this concession to
planes with less than 80 seats).
SJET is among the most efficient carriers in India. Its cost structure is one of the
lowest and it continues to improve its operating efficiencies. Its operating cost per
ASK is almost 20%-40% lower than that of its domestic peers. On a regional basis
too, its operating costs compare favorably to its peer group. This bodes well for SJET
as a lower cost structure allows its earnings to be more resilient in a downturn
compared to its peer group.
Table 2: Key assumptions and earnings sensitivities
Base Case
Assumption
Change in
assumption
Impact on
FY12E net
profit (%)
Domestic load factor (%) 77.0 +/-1% +/-14.7%
Domestic Yields (Rs/RPKM) 3.45 +/-1% +/-11.0%
Fuel price (Rs/litre) 40.1 +/-1% +/-5.6%
Group unit cost per ASK (Rs) 2.6 +/-1% +/-11.3%
Aircraft maintenance cost (Rs/flying hour) 25844.6 +/-1% +/-1.2%
Aircraft, landing, navigation charges (Rs/departure) 30108.9 +/-1% +/-0.8%
USD/INR FX rate (Rs) 44.5 +/-1% +/-7.0%
Effective tax rate (%) 20.0 +/-1% +/-1.3%
Source: J.P. Morgan estimates
Initiate coverage with OW rating
and PT of Rs115 based on 9x
FY12E EV/EBITDAR
We estimate SJET’s market
share to increase from 12.6% in
FY10 to 16.7% by FY12 driven by
aggressive fleet addition backed
by a strong balance sheet
Addition of Bombardier Q400
turboprops to the fleet will
enhance tier II city presence
Efficient operations and low
operating costs provide a
competitive advantage
5. 5
Asia Pacific Equity Research
02 December 2010
Princy Singh
(91-22) 6157 3587
princy.singh@jpmorgan.com
Positive drivers
Market share gains backed by a strong balance sheet
SJET is well positioned in the current market environment to profitably gain market
share over. It is leveraging its strong balance sheet to aggressively add capacity and
capture higher share of incremental demand, at a time when most of its competitors
are constrained to add capacity by their stretched balance sheets. Spice is
aggressively enhancing its fleet; we estimate it to double its fleet size by FY12E to
41 aircraft from 20 aircraft in FY10.
Table 3: SJET fleet expansion estimates
FY06 FY07 FY08 FY09 FY10 FY11E FY12E FY13E
Aircraft type
B737-800 5 11 17 14 15 24 28 34
B737-900ER 0 0 2 5 5 5 7 7
Bombardier-Q400 0 0 0 0 0 0 6 12
Total 5 11 19 19 20 29 41 53
Additions
B737-800 6 6 (3) 1 9 4 6
B737-900ER 0 2 3 0 0 2 0
Bombardier-Q400 0 0 0 0 0 6 6
Total 6 8 0 1 9 12 12
Source: Company reports, DGCA, J.P. Morgan estimates
As a result of the fleet expansion, we estimate that SJET will be able to increase its
passenger market share from 12.6% in FY10 to 16.7% in FY12E. Additionally, given
that we expect industry supply to remain tight until at least 2H FY12, load factors
and yield trends are likely to remain strong, despite new capacity additions. We
estimate SJET’s EBITDA to grow at a 137% CAGR over FY10-FY13E and net
profit to grow at a 55% CAGR over the same period.
Figure 2: SJET: Domestic passenger market share evolution (%)
4.4
7.3
9.2 9.0
12.6 13.3
16.7
0.0
5.0
10.0
15.0
20.0
FY06 FY07 FY08 FY09 FY10 FY11E FY12E
%
Source: DGCA, J.P. Morgan estimates
Enhancing tier II city penetration through Bombardier Q400 additions
SJET recently placed an order for 15 Bombardier Q400 regional turbo-prop aircraft
with an option to acquire another 15. According to management, delivery will
commence in June 2011 and management expects to add one plane every subsequent
month. In the initial phase, Spicejet is looking to fly the Q400s connecting tier I and
tier II cities and later expand to tier III cities. Tier II and III cities are currently
underserved (top six cities account for 90% of airline traffic in India, with Delhi &
Mumbai accounting for 60% of traffic). However, demand from tier II and tier III
Well positioned to capture
higher share of incremental
passenger traffic through fleet
addition backed by strong
balance sheet
Addition of Bombardier
turboprops to strengthen tier II
and tier III city routes
6. 6
Asia Pacific Equity Research
02 December 2010
Princy Singh
(91-22) 6157 3587
princy.singh@jpmorgan.com
cities is rising rapidly and most of these cities are currently underserved. As a result,
traffic share of non-metro cities has been rising steadily over the past few years and
is likely to rise going forward.
According to SJET’s management, the sectors on which Q400s are likely to be
deployed will have an average stage length of 500km. Despite flying smaller stage
lengths, we believe that Q400s are unlikely to be margin-dilutive, given that yields
on tier II routes are remunerative (according to our recent channel checks) and Q400s
will bring some inherent cost advantages.
Our recent channel checks on domestic fares suggest that tier II city fares (on a per
ASKM basis) are remunerative in relation to metro fares.
Table 4: Cheapest available air fares between various cities across India*
Rs Stage Length Tomorrow After 1 week
After 1
Month
Tier I to Tier I cities
Mumbai-Delhi 1hr 55m 5281 4581 3274
Tier I to Tier II cities
Mumbai-Goa 1hr 6425 2704 2202
Mumbai-Ahmedabad 1hr 7934 1852 1852
Delhi-Amritsar 1hr 15m 8342 4871 2257
Delhi-Lucknow 50m 3827 2102 2197
Mumbai-Aurangabad 45m 3910 2812 2258
Tier II to Tier II cities
Hyderabad-Chennai 1hr 3479 2971 2469
Bangalore-Mangalore 1hr 5829 2961 2961
Bangalore-Cochin 1hr 15m 5136 3979 4457
Kolkata-Bhubaneshwar 1hr 20m 4168 2760 2308
Tier III to Tier III cities
Khajurao-Varanasi 45m 9571 3338 3338
Source: www.cleartrip.com, * We conducted this exercise on 25th Nov-2010.
Q400 turboprops will also offer some inherent cost advantages - SJET will configure
the Q400s with 78 seats, below the 80-seat limit, which would exempt the Q400s
from aeronautical and landing fees at domestic airports. In addition, Q400 turboprops
are economical on fuel consumption relative to jets and also have high cruising
speeds, which offer the flexibility to fly longer sectors. In addition, SJET is
Bombardier’s launch customer in India, which we believe will allow SJET to
negotiate a favorable price on the turboprops.
Our channel checks suggest that
non-metro routes are
remunerative
Q400 Turboprops offer good
flying economics to comparative
aircrafts on account of faster
speed and lower fuel
consumptions
7. 7
Asia Pacific Equity Research
02 December 2010
Princy Singh
(91-22) 6157 3587
princy.singh@jpmorgan.com
Figure 3: Q400 turboprop seat economics Figure 4: Q400 fuel consumption vs. other narrow body aircraft
Source: Bombardier website Source: Bombardier website
Lean player with low operating costs
SJET is among the most efficient carriers in India. Its cost structure is one of the
lowest and it continues to improve its operating efficiencies. Its operating cost per
ASK is 20%-40% lower than that of its domestic listed peers.
Figure 5: SJET: Operating CASK vs. JETIN vs. KAIR (FY10) Figure 6: SJET: Operating CASK w/o fuel vs. JETIN vs. KAIR (FY10)
2.45
3.14
4.03
0.00
1.00
2.00
3.00
4.00
5.00
Spicejet Jet Kingfisher
Rs/ASKM
1.52
2.05
2.82
0.00
0.50
1.00
1.50
2.00
2.50
3.00
Spicejet Jet Kingfisher
Rs/ASKM
SJET’s cost structures also compare favorably with those of global low-cost carriers.
Figure 7: CASK (in US cents per ASKM) of Global LCCs
12.1
9.6
8.7
8.0 7.6 7.4 7.0 6.7
5.6 5.3 4.8 4.5 4.4
3.4
0.0
2.0
4.0
6.0
8.0
10.0
12.0
14.0
SouthW
est
JetBlue
GOL
JetAirways
Virgin
Blue
EasyJet
CSA
RyanAir
JetStar
SpicejetCebuAir,Inc.
AirArabiaTigerAirways
AirAsia
Source: Company reports
Cost structures lower by 20%-
40% compared to domestic
listed peers
8. 8
Asia Pacific Equity Research
02 December 2010
Princy Singh
(91-22) 6157 3587
princy.singh@jpmorgan.com
SJET derives its efficiencies from 1) airplane configuration which allows it to
operate with 3% extra seats per place compared to Indian peers, 2) high fleet
utilization driven by faster turnaround of aircraft (average 25min-30min turnaround
time), 3) lean aircraft cabin crew in the absence of in-flight merchandise retailing, 4
cabin crew for SJET compared to the industry average of 5.5 cabin crew, 4) lower
ticketing and reservation costs relative to domestic listed peers. SJET uses Navitaire
(used by LCCs) while listed Indian peers are on the GDS systems. Its lower cost
structure makes SJET’s earnings more resilient during downturns and gives it better
leeway to be competitive on fares.
Consolidation of promoter shareholding bodes well
Mr. Kalanithi Maran recently acquired a controlling stake in SJET, buying out stakes
of earlier promoter Kansagra and US-based investor Wilbur Ross. The promoter
shareholding is now consolidated, with Mr. Maran holding 38.6% of the equity of
SJET. A new management team and board have been inducted, with Mr. Maran as
the Chairman. We believe that the consolidation of promoter shareholding bodes well
as it lends more focus and takes away the risk of conflicts on business decisions.
Efficiencies driven by extra
seats, faster turnaround of
aircraft, lower cost of ticketing
and lean aircraft cabin crew
Consolidation of promoter
shareholding bodes well and
enhances focus
9. 9
Asia Pacific Equity Research
02 December 2010
Princy Singh
(91-22) 6157 3587
princy.singh@jpmorgan.com
Key risks to our rating and price target
Lower-than-expected passenger demand
SJET has seen a strong pick-up in load factors over the last few months, driven by a
rise in traffic demand and tight supply. We expect load factors to remain high, but
higher-than-expected supply could result in load factors declining. In addition, any
one-off events such as terrorist attacks could lead to a sharp fall in passenger traffic.
According to our estimates, every 1% decline in load factors for SJET would
adversely impact FY12E earnings by 14.7%.
Jet kerosene price increase over US$105/bbl
SJET’s earnings are highly sensitive to oil prices. Our fuel assumptions for SJET are
based on Singapore jet kerosene at US$100/bbl for FY11E and US$105/bbl for
FY12E. Higher oil prices would have an adverse impact on our earnings estimates.
We estimate that every 1% increase in ATF prices would adversely impact SJET’s
FY12E earnings by 5.6%.
Increase / changes to airport charge regulations
Current regulations in India exempt aircrafts with fewer than 80 seats from airport
landing and navigation charges. SJET is adding Bombardier Q400 aircraft with a 78-
seat configuration to its fleet, which would qualify for these exemptions, which are
also built into our margin assumptions for SJET. If these exemptions are withdrawn
or changed, it would have an adverse impact on our earnings estimates.
Bombardier Q400s are untested in Indian conditions
SJET is the first operator in India looking to induct the Bombardier Q400 fleet. The
performance of Q400s is yet untested in Indian conditions. In addition, SJET will
need to train pilots and cabin staff for Q400s. Any issues pertaining to the
adaptability of Q400s to Indian flying conditions or non-availability / delays in
getting trained crew staff could have an adverse impact on SJET’s growth plans.
Weaker rupee, given US$ denominated costs and debt
A large part of SJET’s costs, such as ATF, lease rentals and aircraft maintenance
charges, are US$-denominated. In addition, its debt for purchase of new aircraft will
also likely be US$-denominated. Depreciation of the rupee against the US dollar will
result in foreign-exchange-related losses and have an adverse impact on our earnings
estimates.
Key risks include a slowdown in
passenger traffic, increase in oil
prices, changes to airport
charge regulations, induction of
Bombardier fleet, and
unfavorable currency
fluctuations
10. 10
Asia Pacific Equity Research
02 December 2010
Princy Singh
(91-22) 6157 3587
princy.singh@jpmorgan.com
Valuation and share price analysis
Spicejet is currently trading at 6.3x FY12E EV/EBITDAR, at 12% discount to Asian
LCC’s and 6% discount to Global LCCs. On an EV/EBITDA basis it is trading at
8.6x FY12E EV/EBITDA, at 18% discount to Asian LCCs. On a P/E basis, SJET is
trading at 12.5x FY12E P/E, at a 26% premium to its Asian LCC peers.
Our price target of Rs115 is based on 9x FY12E EV/EBITDAR, at 13% premium to
our target multiple for JETIN and KAIR. We attribute a premium to SJET over
Indian full service players on account of SJET’s efficient operations, higher growth
over the next two years, strong balance sheet and low cost structure. Our valuation
summary is enumerated below.
Table 5: SJET: Valuation based on EV/EBITDAR multiples
FY12E EBITDAR (Rs MM) 9,486.8
Target EV/EBITDAR Multiple (x) 9.0
13% premium to JPME target multiple of 8.0x for
JETIN and KAIR
Enterprise Value (Rs MM) 85,381.2
Lease Rental Capitalization (Rs MM) 40,123 FY12E
(-) Net Debt /(Cash) (Rs MM) (1,077.6) FY12E
Target Equity Value (Rs MM) 46,336.0
NOSH (MM) 404.9
Target price per share (Rs) 115
Source: J.P. Morgan estimates
Figure 8: SJET: EV/EBITDAR bands (x) Figure 9: SJET: EV/EBITDA bands
5.0
6.5
8.0
9.5
0.0
20.0
40.0
60.0
80.0
100.0
120.0
140.0
Apr-05 Oct-05 Apr-06 Oct-06 Apr-07 Oct-07 Apr-08 Oct-08 Apr-09 Oct-09 Apr-10 Oct-10 Apr-11
EV/EBITDAR Bands
5.0
7.0
9.0
11.0
0.0
20.0
40.0
60.0
80.0
100.0
120.0
140.0
Apr-05 Oct-05 Apr-06 Oct-06 Apr-07 Oct-07 Apr-08 Oct-08 Apr-09 Oct-09 Apr-10 Oct-10 Apr-11
EV/EBITDA Bands
Source: Bloomberg, company reports, J.P. Morgan estimates Source: Bloomberg, company reports, J.P. Morgan estimates
SJET is trading at a 12%
discount to Asian LCCs on
FY12E EV/EBITDAR
12. 12
Asia Pacific Equity Research
02 December 2010
Princy Singh
(91-22) 6157 3587
princy.singh@jpmorgan.com
Company description
Spicejet is a low-cost airline service operator engaged primarily in domestic routes in
India. It recently started an international service with flights to Colombo, Dhaka, the
Maldives, and Kathmandu. SJET operates 122 flights daily to over 19 domestic
destinations with a fleet of 22 aircraft, which includes 17 Boeing 737-800 and five
Boeing 737-900 ER aircraft. With the intention to expand its network in domestic
and international routes, the company intends to take 36 aircraft deliveries over the
next 4-5years. Spicejet had a domestic passenger market share of 12.6% in FY10.
Management background
Spicejet, (previously run as Modiluft), was founded by Mr. Ajay Singh and the
Kansagra family. In July 2008, investor Wilbur Ross invested US$78.3MM in the
company. Recently, a promoter of SUN Network, Mr. Kalanithi Maran, acquired a
37.5% stake in Spicejet from Kansagra and Wibur Ross, and acquired management
control of the company. Mr. Kalanithi Maran is the Chairman of the company. A
new management team has been inducted, with Mr. Neil Mills being appointed as the
CEO (former CFO of LCC start-up Flydubai), Mr. S. Natrajhen as the COO
(previously CFO of Sun TV). Ms. Seema Chandra is the CFO of SJET.
Shareholding trend
As at the end of Sep-2010, promoter shareholding in the company was 8.1%, and FII
holdings were 14.5% as per the BSE website. However, Mr. Kalanithi Maran
recently bought stakes of earlier promoters and investors and controls over 38.66%
stake in SJET.
Table 7: Spicejet shareholding trend (%)
%
Jun-
07
Sep-
07
Dec-
07
Mar-
08
Jun-
08
Sep-
08
Dec-
08
Mar-
09
Sep-
09
Dec-
09
Mar-
10
Jun-
10
Sep-
10
Promoter holding 12.9 12.9 12.9 12.9 12.9 12.9 12.9 12.9 12.9 12.9 12.9 9.5 8.1
Public
shareholding
Institutions 25.7 28.5 24.8 24.1 17.6 17.8 17.7 16.9 16.5 22.2 34.3 35.0 33.3
Mutual Funds 6.9 10.1 10.6 11.7 7.7 8.2 8.1 7.7 11.0 12.8 23.5 19.5 18.8
Financial Insti. 0.0 0.2 0.0
FIIs 18.8 18.2 14.2 12.4 9.9 9.6 9.6 9.2 5.5 9.3 10.8 15.5 14.5
Non-Institutions 32.2 29.5 31.5 35.2 42.0 42.4 42.3 43.7 45.3 41.7 43.4 30.0 51.3
Corporates 21.5 17.7 18.1 20.4 22.7 22.3 21.6 21.9 23.7 22.0 21.6 16.0 38.7
Individuals 10.8 11.8 13.4 14.9 19.3 20.2 20.7 21.8 21.6 19.6 21.8 14.0 12.6
Others 29.1 29.2 30.8 27.8 27.6 26.9 27.1 26.6 25.3 23.3 9.5 25.5 7.4
Total 100 100 100 100 100 100 100 100 100 100 100 100 100
Source: BSE website
13. 13
Asia Pacific Equity Research
02 December 2010
Princy Singh
(91-22) 6157 3587
princy.singh@jpmorgan.com
Financial analysis
Earnings CAGR of 47% over FY10-FY13E
We forecast an EPS CAGR of 47% over FY10-FY13E driven by an increase in fleet
size, higher load factors, and improvement in yields. We estimate ASKMs for SJET
to increase from 8770 MM in FY10 to 17948 MM by FY13E, implying a CAGR of
27% and RSKMs to increase at 26% CAGR over the same period. We forecast
EBITDA margins to improve from 1.4% in FY10 to 7.7% in FY13E, driven by
operating leverage and improving efficiencies.
Figure 12: SJET: EBITDAR FY08-FY13E (Rs MM) Figure 13: SJET: PAT FY08-FY13E (Rs MM)
6
(487)
4,297
7,059
9,487
10,687
(2,000)
0
2,000
4,000
6,000
8,000
10,000
12,000
FY08 FY09 FY10 FY11E FY12E FY13E
(1,324)
(3,217)
670
2,683 2,657 2,132
(4,000)
(3,000)
(2,000)
(1,000)
0
1,000
2,000
3,000
FY08 FY09 FY10 FY11E FY12E FY13E
Source: Company reports, J.P. Morgan estimates Source: Company reports, J.P. Morgan estimates
Revenue CAGR of 32% over FY10-FY13E
We forecast a CAGR of 32% in revenues over FY10-FY13E. We expect revenue
growth to be driven by a 27% CAGR in RPKMs and 5.5% CAGR in yields over the
same period. We estimate ASKMs to increase from 8770MM in FY10 to 17,948MM
by FY13E on account of addition of new aircraft. We estimate RPKMs to increase at
a 26% CAGR over FY10-FY13E, assuming stable load factors (77.6% in FY10,
declining to 76% in FY13E). We estimate a 15% improvement in passenger yields in
FY11E and 3% improvement in FY12E, before a 1% decline in FY13E.
Figure 14: Spicejet: ASKM trend FY06-FY13E Figure 15: Spicejet: RPKM and load factors
3,532
6,010
7,227
8,770
10,636
15,005
17,948
0
5,000
10,000
15,000
20,000
FY07 FY08 FY09 FY10 FY11E FY12E FY13E
MM KMs
2,707 4,397 4,819 6,807 8,296 11,554 13,641
76.6
73.2
66.7
77.6 78.0 77.0
76.0
60.0
65.0
70.0
75.0
80.0
FY07 FY08 FY09 FY10 FY11E FY12E FY13E
0
5000
10000
15000
RPKMs (MM KMs) Load Factor (%)
Load Factor % RPKMs (MM KMs)
Source: Company reports and presentations, J.P. Morgan estimates Source: Company reports and presentations, J.P. Morgan estimates
EPS CAGR of 46% over FY10-
FY13E driven by increase in fleet
size and yield improvement
New plane additions to drive
strong revenue growth
14. 14
Asia Pacific Equity Research
02 December 2010
Princy Singh
(91-22) 6157 3587
princy.singh@jpmorgan.com
Figure 16: Spicejet: Yield (Rs/RPKM) trends FY06-FY13E Figure 17: Spicejet: CASK/ CASK w/o fuel trends FY06-FY13E
2.24
2.74
3.25
2.91
3.35
3.45 3.41
2.00
2.50
3.00
3.50
4.00
FY07 FY08 FY09 FY10 FY11E FY12E FY13E
Yield (Rs/RPKM)
2.0
2.4
2.8
2.4 2.5 2.6 2.6
1.51.5
1.0
1.2
1.5 1.4 1.5
0.0
0.5
1.0
1.5
2.0
2.5
3.0
FY07 FY08 FY09 FY10 FY11E FY12E FY13E
CASK per ASKM (Rs) CASK per ASKM w/o fuel (Rs)
Source: Company reports and presentations, J.P. Morgan estimates Source: Company reports and presentations, J.P. Morgan estimates
EBITDAR margin to improve by 150bp by FY13E
We forecast an EBITDAR CAGR of 36% over FY10-FY13E and forecast margins to
improve by 150bp to 21.2% over the same period. We estimate margin improvement
to be driven by higher yields and operating leverage. We are also factoring in lower
maintenance costs, better fuel efficiencies, and savings on airport navigation and
landing charges on account of induction of the Bombardier Q400s. Our key margin
assumptions are enumerated below.
Table 8: Key revenue and costs assumptions (Rupees / ASKM)
Year-end March FY09 FY10 FY11E FY12E FY13E
Revenues per ASK (RASK) 2.3 2.5 2.8 2.9 2.8
% YoY 8.8 6.4 13.3 1.7 (2.3)
Operating Costs per ASK (CASK) 2.4 1.9 2.0 2.1 2.1
% YoY 14.1 (18.1) 5.3 2.3 (0.2)
Lease Rentals / ASK 0.5 0.5 0.4 0.4 0.4
Fuel Cost / ASK 1.3 0.9 1.1 1.2 1.2
Aircraft maintenance cost / ASK 0.3 0.3 0.3 0.3 0.3
Landing, navigation & other airport charges / ASK 0.2 0.2 0.2 0.2 0.2
Other Operating Costs 0.0 0.0 0.0 0.0 0.0
0.1 0.1 0.1 0.1 0.1
CASK (post depreciation and interest)
% YoY 2.8 2.4 2.5 2.6 2.6
Source: Company presentations, J.P. Morgan estimates
Margin improvement to be
driven by operating leverage and
higher yields
15. 15
Asia Pacific Equity Research
02 December 2010
Princy Singh
(91-22) 6157 3587
princy.singh@jpmorgan.com
Earnings highly sensitive to load factors, yields and oil
We enumerate below our earnings sensitivity analysis for Spicejet to load factors,
yields and oil prices.
We estimate a 1% change in load factors would affect FY12E EBITDAR and PAT
by 5% and 15% respectively.
Table 9: FY12 EBITDAR and FY12 PAT sensitivity to changes in passenger load factors
EBITDAR (Rs
MM) % Change
PAT (Rs
MM) % Change
-5% 7228.9 -23.8 704.1 -73.5
-4% 7684.3 -19.0 1094.6 -58.8
-3% 8130.2 -14.3 1485.2 -44.1
-2% 8585.6 -9.5 1875.7 -29.4
-1% 9031.4 -4.8 2266.3 -14.7
Base Case - 77% 9486.8 0.0 2656.9 0.0
1% 9942.2 4.8 3047.4 14.7
2% 10388.0 9.5 3438.0 29.4
3% 10843.4 14.3 3828.5 44.1
4% 11289.3 19.0 4219.1 58.8
5% 11744.7 23.8 4609.7 73.5
Source: J.P. Morgan estimates
We estimate a 1% change in yields would affect FY12E EBITDAR and PAT by 4%
and 11% respectively.
Table 10: FY12 EBITDAR and FY12 PAT sensitivity to changes in yields (Rs/RPKM)
EBITDAR (Rs
MM) % Change
PAT (Rs
MM) % Change
-5% 7798.1 -17.8 1192.9 -55.1
-4% 8130.2 -14.3 1487.8 -44.0
-3% 8471.7 -10.7 1780.1 -33.0
-2% 8813.2 -7.1 2072.4 -22.0
-1% 9145.3 -3.6 2364.6 -11.0
Base Case - Rs3.45/RPKM 9486.8 0.0 2656.9 0.0
1% 9828.3 3.6 2949.1 11.0
2% 10160.4 7.1 3241.4 22.0
3% 10501.9 10.7 3533.6 33.0
4% 10843.4 14.3 3825.9 44.0
5% 11175.5 17.8 4120.8 55.1
Source: J.P. Morgan estimates
We estimate a 1% change in ATF prices would impact FY12E EBITDAR and PAT
by 2% and 6% respectively.
Table 11: FY12 EBITDAR and FY12 PAT sensitivity to changes in ATF prices
EBITDAR (Rs
MM) % Change
PAT (Rs
MM) % Change
-5% 10350.1 9.1 3400.8 28.0
-4% 10179.3 7.3 3252.0 22.4
-3% 10008.6 5.5 3103.2 16.8
-2% 9837.8 3.7 2954.4 11.2
-1% 9657.6 1.8 2805.6 5.6
Base Case – Rs40.1/litre 9486.8 0.0 2656.9 0.0
1% 9316.0 -1.8 2508.1 -5.6
2% 9135.8 -3.7 2359.3 -11.2
3% 8965.0 -5.5 2210.5 -16.8
4% 8794.3 -7.3 2061.7 -22.4
5% 8623.5 -9.1 1912.9 -28.0
Source: J.P. Morgan estimates
16. 16
Asia Pacific Equity Research
02 December 2010
Princy Singh
(91-22) 6157 3587
princy.singh@jpmorgan.com
Gearing to remain low despite purchase of new airlines
SJET is looking to fund its fleet expansion through US Exim Bank funded loans. As
a result, we expect gearing levels to go up. While the company currently has net cash
of Rs124MM, after the fleet expansion, we estimate net gearing of 0.3x by FY13E.
Overall, we estimate that balance sheet and interest cover will remain healthy despite
purchase of new aircraft.
We estimate strong growth in operating cash flow – we expect operating cash flow to
increase from Rs955MM in FY10 to R3.5B in FY13E.
Figure 18: Spicejet: Net debt to equity trend (x) Figure 19: Spicejet: Operating cash flow trend (Rs MM)
0.15
(0.13)
0.40
(0.03)
(0.77)
(0.11)
0.27
(1.0)
(0.8)
(0.6)
(0.4)
(0.2)
0.0
0.2
0.4
0.6
FY07 FY08 FY09 FY10 FY11E FY12E FY13E
(1,489)
(2,126)
(3,339)
955
2,675
3,901 3,500
(4,000)
(2,000)
0
2,000
4,000
6,000
FY07 FY08 FY09 FY10 FY11E FY12E FY13E
Source: Company reports, J.P. Morgan estimates Source: Company reports, J.P. Morgan estimates
Capital efficiency to improve on higher earnings
We expect ROCE to improve from 8.3% in FY10 to 17.8% in FY13E and ROE to
improve from 14.3% in FY10 to 21.6% in FY13E driven by strong growth in
earnings.
Figure 20: Spicejet: ROCE and ROE trend
(7.4) (11.5)
(30.4)
8.3
27.1 24.0
17.8
(15.9)
(24.2)
(65.0)
14.3
36.5
26.9 21.6
(80.0)
(60.0)
(40.0)
(20.0)
0.0
20.0
40.0
60.0
FY07 FY08 FY09 FY10 FY11E FY12E FY13E
ROCE
ROE
Source: Company reports, J.P. Morgan estimates
Gearing to remain low despite
purchase of new aircraft
18. 18
Asia Pacific Equity Research
02 December 2010
Princy Singh
(91-22) 6157 3587
princy.singh@jpmorgan.com
Table 14: Spicejet: Consolidated cash flow statement
Rs MM, YE March FY09 FY10 FY11E FY12E FY13E
PBT (3,371.3) 733.9 3,272.2 3,321.0 2,842.9
Direct Taxes paid/ Refund (58.9) (31.0) (589.0) (664.2) (710.7)
Depreciation 72.5 76.4 80.2 560.1 897.6
Change in Working Capital 289.4 459.8 (161.2) 563.6 200.3
Other Non Cash Items (270.9) (284.5) 72.6 120.0 270.0
Operating Cash Flows (3,339.1) 954.6 2,674.8 3,900.5 3,500.1
Capex (116.9) (90.2) (212.5) (10,295.6) (6,929.1)
Net Proceeds on Aircrafts 937.7 34.7
Change in Investments 15.6 0.0 0.0 0.0 0.0
Other Investing Activities 5,628.4 235.4
Cash flow from Investing 6,464.8 179.9 (212.5) (10,295.6) (6,929.1)
Change in Debt (1,334.0) 7.2 (3,172.9) 790.0 2,500.0
Equity Issued 60.6 29.0 5,078.8 0.0 0.0
Dividends Paid 0.0 0.0 0.0 0.0 0.0
Interest Paid (99.7) (62.8) (72.6) (120.0) (270.0)
Other
Cash Flow from Financing (1,373.1) (26.6) 1,833.3 670.0 2,230.0
Change in Cash 1,752.6 1,107.9 4,295.6 (5,725.1) (1,199.0)
Cash at Beginng of the Year 66.2 1,818.8 2,926.7 7,222.4 1,497.3
Cash at End of Year 1,818.8 2,926.7 7,222.4 1,497.3 298.3
Add: Margin money held as security 1,238.1 1,557.2 1,557.2 1,557.2 1,557.2
Add: Escrow account 23.1 23.1 23.1 23.1 23.1
Add: Amount in fixed deposit
Cash as reported in Balance sheet 3,080.0 4,507.0 8,802.6 3,077.5 1,878.5
Source: Company reports, J.P. Morgan estimates.
19. 19
Asia Pacific Equity Research
02 December 2010
Princy Singh
(91-22) 6157 3587
princy.singh@jpmorgan.com
Spicejet Ltd: Summary of Financials
Income Statement Cash flow statement
Rs in millions, year end Mar FY09 FY10 FY11E FY12E FY13E Rs in millions, year end Mar FY09 FY10 FY11E FY12E FY13E
Revenues 16,894 21,811 30,006 43,041 50,308 PBT -3,183 734 3,272 3,321 2,843
% change Y/Y 30.5% 29.1% 37.6% 43.4% 16.9% Depr. & amortization 73 76 80 560 898
Gross Profit 3,565 8,854 12,704 17,529 19,794 Change in working capital 289 460 -161 564 200
% change Y/Y 16.7% 148.4% 43.5% 38.0% 12.9% Other -271 -285 73 120 270
EBITDA -4,192 314 2,721 3,755 3,898 Cash flow from operations -3,339 955 2,675 3,901 3,500
% change Y/Y 66.3% -107.5% 766.4% 38.0% 3.8%
EBIT -4,264 238 2,641 3,195 3,001 Capex 821 -55 -212 -10,296 -6,929
% change Y/Y 64.1% NM 1011.4% 21.0% NM Net Interest -160 -114 -73 -120 -270
EBIT Margin -25.2% 1.1% 8.8% 7.4% 6.0% Other 5,628 235 - - -
Net Interest -160 -114 -73 -120 -270 Free cash flow -2,518 899 2,462 -6,395 -3,429
Earnings before tax -3,183 734 3,272 3,321 2,843
% change Y/Y 145.0% -123.1% 345.9% 1.5% -14.4% Equity raised/(repaid) 61 29 5,079 0 0
Tax -33 -64 -589 -664 -711 Debt raised/(repaid) -1,334 7 -3,173 790 2,500
as % of EBT 1.0% 8.7% 18.0% 20.0% 25.0% Other -100 -63 -73 -120 -270
Net income -3,526 614 2,683 2,657 2,132 Dividends paid 0 0 0 0 0
% change Y/Y 164.1% -117.4% 336.7% -1.0% -19.7% Beginning cash 66 1,819 2,927 7,222 1,497
Shares outstanding - - - - - Ending cash 3,080 4,507 8,803 3,078 1,878
EPS (reported) (14.64) 1.56 6.63 6.56 5.27 DPS 0.00 0.00 0.00 0.00 0.00
% change Y/Y 163.9% (110.7%) 325.1% (1.0%) (19.7%)
Balance sheet Ratio Analysis
Rs in millions, year end Mar FY09 FY10 FY11E FY12E FY13E Rs in millions, year end Mar FY09 FY10 FY11E FY12E FY13E
Cash and cash equivalents 3,080 4,507 8,803 3,078 1,878 Gross margin 21.1% 40.6% 42.3% 40.7% 39.3%
Accounts receivable 124 190 242 346 405 EBITDA margin -24.8% 1.4% 9.1% 8.7% 7.7%
Inventories 125 147 188 269 314 Operating margin (25.2%) 1.1% 8.8% 7.4% 6.0%
Others 1,651 1,128 1,436 2,060 2,408 Net margin -20.9% 2.8% 8.9% 6.2% 4.2%
Current assets 4,979 5,971 10,668 5,753 5,006
Sales per share growth 30.3% (21.1%) 33.9% 43.4% 16.9%
LT investments 0 0 0 0 0 Sales growth 30.5% 29.1% 37.6% 43.4% 16.9%
Net fixed assets 2,528 3,919 4,051 13,787 19,818 Net profit growth 164.1% -117.4% 336.7% -1.0% -19.7%
Total Assets 16,346 18,114 20,260 22,424 25,576 EPS growth 163.9% (110.7%) 325.1% (1.0%) (19.7%)
Liabilities Interest coverage (x) 26.16 2.76 37.48 31.29 14.44
Short-term loans 0 0 0 0 0
Payables 5,657 7,422 7,586 8,881 9,450 Net debt to equity 39.8% -2.6% -76.8% -10.9% 26.5%
Others 1,257 1,507 1,583 1,662 1,745 Working Capital to Sales (32.0%) (32.5%) (23.9%) (19.2%) (17.4%)
Total current liabilities 6,914 8,929 9,169 10,543 11,195 Sales/assets 0.97 1.27 1.56 2.02 2.10
Long-term debt 4,888 4,383 1,210 2,000 4,500 Assets/equity 3.60 3.77 2.05 2.27 2.59
Other liabilities 0 0 0 0 0 ROE (71.2%) 13.2% 36.5% 26.9% 21.6%
Total Liabilities 11,802 13,312 10,379 12,543 15,695 ROCE -42.4% 2.6% 26.0% 27.8% 22.9%
Shareholders' equity 4,544 4,802 9,881 9,881 9,881
BVPS 18.86 12.18 24.40 24.40 24.40
Source: Company reports and J.P. Morgan estimates.
20. 20
Asia Pacific Equity Research
02 December 2010
Princy Singh
(91-22) 6157 3587
princy.singh@jpmorgan.com
Analyst Certification:
The research analyst(s) denoted by an “AC” on the cover of this report certifies (or, where multiple research analysts are primarily
responsible for this report, the research analyst denoted by an “AC” on the cover or within the document individually certifies, with
respect to each security or issuer that the research analyst covers in this research) that: (1) all of the views expressed in this report
accurately reflect his or her personal views about any and all of the subject securities or issuers; and (2) no part of any of the research
analyst’s compensation was, is, or will be directly or indirectly related to the specific recommendations or views expressed by the
research analyst(s) in this report.
Important Disclosures
• Client of the Firm: Spicejet Ltd is or was in the past 12 months a client of JPM; during the past 12 months, JPM provided to the
company non-investment banking securities-related service.
• Non-Investment Banking Compensation: JPMS has received compensation in the past 12 months for products or services other
than investment banking from Spicejet Ltd.
0
30
60
90
120
150
Price(Rs)
Oct
07
Jan
08
Apr
08
Jul
08
Oct
08
Jan
09
Apr
09
Jul
09
Oct
09
Jan
10
Apr
10
Jul
10
Oct
10
Jan
11
Spicejet Ltd (SPJT.BO) Price Chart
Source: Bloomberg and J.P. Morgan; price data adjusted for stock splits and dividends.
This chart shows J.P. Morgan's continuing coverage of this stock; the current analyst may or may not have covered it
over the entire period.
J.P. Morgan ratings: OW = Overweight, N = Neutral, UW = Underweight.
Explanation of Equity Research Ratings and Analyst(s) Coverage Universe:
J.P. Morgan uses the following rating system: Overweight [Over the next six to twelve months, we expect this stock will outperform the
average total return of the stocks in the analyst’s (or the analyst’s team’s) coverage universe.] Neutral [Over the next six to twelve
months, we expect this stock will perform in line with the average total return of the stocks in the analyst’s (or the analyst’s team’s)
coverage universe.] Underweight [Over the next six to twelve months, we expect this stock will underperform the average total return of
the stocks in the analyst’s (or the analyst’s team’s) coverage universe.] J.P. Morgan Cazenove’s UK Small/Mid-Cap dedicated research
analysts use the same rating categories; however, each stock’s expected total return is compared to the expected total return of the FTSE
All Share Index, not to those analysts’ coverage universe. A list of these analysts is available on request. The analyst or analyst’s team’s
coverage universe is the sector and/or country shown on the cover of each publication. See below for the specific stocks in the certifying
analyst(s) coverage universe.
Coverage Universe: Princy Singh: Apollo Hospitals Enterprise Ltd. (APLH.BO), Ballarpur Industries Ltd. (BILT.BO),
Deepak Fertilisers & Petrochemicals Corp (DPFE.BO), Dish TV (DSTV.BO), Fortis Healthcare Ltd (FOHE.BO), Jain
Irrigation Systems Ltd (JAIR.BO), Opto Circuits (India) Ltd (OPTO.BO), S.Kumars Nationwide Limited (SKMK.BO),
Sintex Industries Limited (SNTX.BO), Sterlite Technologies Ltd (STTE.BO)
21. 21
Asia Pacific Equity Research
02 December 2010
Princy Singh
(91-22) 6157 3587
princy.singh@jpmorgan.com
J.P. Morgan Equity Research Ratings Distribution, as of September 30, 2010
Overweight
(buy)
Neutral
(hold)
Underweight
(sell)
J.P. Morgan Global Equity Research
Coverage
46% 43% 12%
IB clients* 49% 45% 33%
JPMS Equity Research Coverage 43% 48% 8%
IB clients* 69% 60% 50%
*Percentage of investment banking clients in each rating category.
For purposes only of FINRA/NYSE ratings distribution rules, our Overweight rating falls into a buy rating category; our Neutral rating falls into a hold
rating category; and our Underweight rating falls into a sell rating category.
Valuation and Risks: Please see the most recent company-specific research report for an analysis of valuation methodology and risks on
any securities recommended herein. Research is available at http://www.morganmarkets.com , or you can contact the analyst named on
the front of this note or your J.P. Morgan representative.
Analysts’ Compensation: The equity research analysts responsible for the preparation of this report receive compensation based upon
various factors, including the quality and accuracy of research, client feedback, competitive factors, and overall firm revenues, which
include revenues from, among other business units, Institutional Equities and Investment Banking.
Registration of non-US Analysts: Unless otherwise noted, the non-US analysts listed on the front of this report are employees of non-US
affiliates of JPMS, are not registered/qualified as research analysts under FINRA/NYSE rules, may not be associated persons of JPMS,
and may not be subject to FINRA Rule 2711 and NYSE Rule 472 restrictions on communications with covered companies, public
appearances, and trading securities held by a research analyst account.
Other Disclosures
J.P. Morgan ("JPM") is the global brand name for J.P. Morgan Securities LLC ("JPMS") and its affiliates worldwide. J.P. Morgan Cazenove is a
marketing name for the U.K. investment banking businesses and EMEA cash equities and equity research businesses of JPMorgan Chase & Co.
and its subsidiaries.
Options related research: If the information contained herein regards options related research, such information is available only to persons who
have received the proper option risk disclosure documents. For a copy of the Option Clearing Corporation’s Characteristics and Risks of
Standardized Options, please contact your J.P. Morgan Representative or visit the OCC’s website at
http://www.optionsclearing.com/publications/risks/riskstoc.pdf.
Legal Entities Disclosures
U.S.: JPMS is a member of NYSE, FINRA and SIPC. J.P. Morgan Futures Inc. is a member of the NFA. JPMorgan Chase Bank, N.A. is a
member of FDIC and is authorized and regulated in the UK by the Financial Services Authority. U.K.: J.P. Morgan Securities Ltd. (JPMSL) is a
member of the London Stock Exchange and is authorized and regulated by the Financial Services Authority. Registered in England & Wales No.
2711006. Registered Office 125 London Wall, London EC2Y 5AJ. South Africa: J.P. Morgan Equities Limited is a member of the Johannesburg
Securities Exchange and is regulated by the FSB. Hong Kong: J.P. Morgan Securities (Asia Pacific) Limited (CE number AAJ321) is regulated
by the Hong Kong Monetary Authority and the Securities and Futures Commission in Hong Kong. Korea: J.P. Morgan Securities (Far East) Ltd,
Seoul Branch, is regulated by the Korea Financial Supervisory Service. Australia: J.P. Morgan Australia Limited (ABN 52 002 888 011/AFS
Licence No: 238188) is regulated by ASIC and J.P. Morgan Securities Australia Limited (ABN 61 003 245 234/AFS Licence No: 238066) is a
Market Participant with the ASX and regulated by ASIC. Taiwan: J.P.Morgan Securities (Taiwan) Limited is a participant of the Taiwan Stock
Exchange (company-type) and regulated by the Taiwan Securities and Futures Bureau. India: J.P. Morgan India Private Limited is a member of
the National Stock Exchange of India Limited and Bombay Stock Exchange Limited and is regulated by the Securities and Exchange Board of
India. Thailand: JPMorgan Securities (Thailand) Limited is a member of the Stock Exchange of Thailand and is regulated by the Ministry of
Finance and the Securities and Exchange Commission. Indonesia: PT J.P. Morgan Securities Indonesia is a member of the Indonesia Stock
Exchange and is regulated by the BAPEPAM LK. Philippines: J.P. Morgan Securities Philippines Inc. is a member of the Philippine Stock
Exchange and is regulated by the Securities and Exchange Commission. Brazil: Banco J.P. Morgan S.A. is regulated by the Comissao de Valores
Mobiliarios (CVM) and by the Central Bank of Brazil. Mexico: J.P. Morgan Casa de Bolsa, S.A. de C.V., J.P. Morgan Grupo Financiero is a
member of the Mexican Stock Exchange and authorized to act as a broker dealer by the National Banking and Securities Exchange Commission.
Singapore: This material is issued and distributed in Singapore by J.P. Morgan Securities Singapore Private Limited (JPMSS) [MICA (P)
020/01/2010 and Co. Reg. No.: 199405335R] which is a member of the Singapore Exchange Securities Trading Limited and is regulated by the
Monetary Authority of Singapore (MAS) and/or JPMorgan Chase Bank, N.A., Singapore branch (JPMCB Singapore) which is regulated by the
MAS. Malaysia: This material is issued and distributed in Malaysia by JPMorgan Securities (Malaysia) Sdn Bhd (18146-X) which is a
Participating Organization of Bursa Malaysia Berhad and a holder of Capital Markets Services License issued by the Securities Commission in
Malaysia. Pakistan: J. P. Morgan Pakistan Broking (Pvt.) Ltd is a member of the Karachi Stock Exchange and regulated by the Securities and
Exchange Commission of Pakistan. Saudi Arabia: J.P. Morgan Saudi Arabia Ltd. is authorized by the Capital Market Authority of the Kingdom
22. 22
Asia Pacific Equity Research
02 December 2010
Princy Singh
(91-22) 6157 3587
princy.singh@jpmorgan.com
of Saudi Arabia (CMA) to carry out dealing as an agent, arranging, advising and custody, with respect to securities business under licence number
35-07079 and its registered address is at 8th Floor, Al-Faisaliyah Tower, King Fahad Road, P.O. Box 51907, Riyadh 11553, Kingdom of Saudi
Arabia. Dubai: JPMorgan Chase Bank, N.A., Dubai Branch is regulated by the Dubai Financial Services Authority (DFSA) and its registered
address is Dubai International Financial Centre - Building 3, Level 7, PO Box 506551, Dubai, UAE.
Country and Region Specific Disclosures
U.K. and European Economic Area (EEA): Unless specified to the contrary, issued and approved for distribution in the U.K. and the EEA by
JPMSL. Investment research issued by JPMSL has been prepared in accordance with JPMSL's policies for managing conflicts of interest arising
as a result of publication and distribution of investment research. Many European regulators require a firm to establish, implement and maintain
such a policy. This report has been issued in the U.K. only to persons of a kind described in Article 19 (5), 38, 47 and 49 of the Financial Services
and Markets Act 2000 (Financial Promotion) Order 2005 (all such persons being referred to as "relevant persons"). This document must not be
acted on or relied on by persons who are not relevant persons. Any investment or investment activity to which this document relates is only
available to relevant persons and will be engaged in only with relevant persons. In other EEA countries, the report has been issued to persons
regarded as professional investors (or equivalent) in their home jurisdiction. Australia: This material is issued and distributed by JPMSAL in
Australia to “wholesale clients” only. JPMSAL does not issue or distribute this material to “retail clients.” The recipient of this material must not
distribute it to any third party or outside Australia without the prior written consent of JPMSAL. For the purposes of this paragraph the terms
“wholesale client” and “retail client” have the meanings given to them in section 761G of the Corporations Act 2001. Germany: This material is
distributed in Germany by J.P. Morgan Securities Ltd., Frankfurt Branch and J.P.Morgan Chase Bank, N.A., Frankfurt Branch which are
regulated by the Bundesanstalt für Finanzdienstleistungsaufsicht. Hong Kong: The 1% ownership disclosure as of the previous month end
satisfies the requirements under Paragraph 16.5(a) of the Hong Kong Code of Conduct for Persons Licensed by or Registered with the Securities
and Futures Commission. (For research published within the first ten days of the month, the disclosure may be based on the month end data from
two months’ prior.) J.P. Morgan Broking (Hong Kong) Limited is the liquidity provider for derivative warrants issued by J.P. Morgan Structured
Products B.V. and listed on the Stock Exchange of Hong Kong Limited. An updated list can be found on HKEx website:
http://www.hkex.com.hk/prod/dw/Lp.htm. Japan: There is a risk that a loss may occur due to a change in the price of the shares in the case of
share trading, and that a loss may occur due to the exchange rate in the case of foreign share trading. In the case of share trading, JPMorgan
Securities Japan Co., Ltd., will be receiving a brokerage fee and consumption tax (shouhizei) calculated by multiplying the executed price by the
commission rate which was individually agreed between JPMorgan Securities Japan Co., Ltd., and the customer in advance. Financial Instruments
Firms: JPMorgan Securities Japan Co., Ltd., Kanto Local Finance Bureau (kinsho) No. 82 Participating Association / Japan Securities Dealers
Association, The Financial Futures Association of Japan. Korea: This report may have been edited or contributed to from time to time by
affiliates of J.P. Morgan Securities (Far East) Ltd, Seoul Branch. Singapore: JPMSS and/or its affiliates may have a holding in any of the
securities discussed in this report; for securities where the holding is 1% or greater, the specific holding is disclosed in the Important Disclosures
section above. India: For private circulation only, not for sale. Pakistan: For private circulation only, not for sale. New Zealand: This
material is issued and distributed by JPMSAL in New Zealand only to persons whose principal business is the investment of money or who, in the
course of and for the purposes of their business, habitually invest money. JPMSAL does not issue or distribute this material to members of "the
public" as determined in accordance with section 3 of the Securities Act 1978. The recipient of this material must not distribute it to any third
party or outside New Zealand without the prior written consent of JPMSAL. Canada: The information contained herein is not, and under no
circumstances is to be construed as, a prospectus, an advertisement, a public offering, an offer to sell securities described herein, or solicitation of
an offer to buy securities described herein, in Canada or any province or territory thereof. Any offer or sale of the securities described herein in
Canada will be made only under an exemption from the requirements to file a prospectus with the relevant Canadian securities regulators and only
by a dealer properly registered under applicable securities laws or, alternatively, pursuant to an exemption from the dealer registration requirement
in the relevant province or territory of Canada in which such offer or sale is made. The information contained herein is under no circumstances to
be construed as investment advice in any province or territory of Canada and is not tailored to the needs of the recipient. To the extent that the
information contained herein references securities of an issuer incorporated, formed or created under the laws of Canada or a province or territory
of Canada, any trades in such securities must be conducted through a dealer registered in Canada. No securities commission or similar regulatory
authority in Canada has reviewed or in any way passed judgment upon these materials, the information contained herein or the merits of the
securities described herein, and any representation to the contrary is an offence. Dubai: This report has been issued to persons regarded as
professional clients as defined under the DFSA rules.
General: Additional information is available upon request. Information has been obtained from sources believed to be reliable but JPMorgan
Chase & Co. or its affiliates and/or subsidiaries (collectively J.P. Morgan) do not warrant its completeness or accuracy except with respect to any
disclosures relative to JPMS and/or its affiliates and the analyst’s involvement with the issuer that is the subject of the research. All pricing is as
of the close of market for the securities discussed, unless otherwise stated. Opinions and estimates constitute our judgment as of the date of this
material and are subject to change without notice. Past performance is not indicative of future results. This material is not intended as an offer or
solicitation for the purchase or sale of any financial instrument. The opinions and recommendations herein do not take into account individual
client circumstances, objectives, or needs and are not intended as recommendations of particular securities, financial instruments or strategies to
particular clients. The recipient of this report must make its own independent decisions regarding any securities or financial instruments
mentioned herein. JPMS distributes in the U.S. research published by non-U.S. affiliates and accepts responsibility for its contents. Periodic
updates may be provided on companies/industries based on company specific developments or announcements, market conditions or any other
publicly available information. Clients should contact analysts and execute transactions through a J.P. Morgan subsidiary or affiliate in their home
jurisdiction unless governing law permits otherwise.
“Other Disclosures” last revised September 1, 2010.
Copyright 2010 JPMorgan Chase & Co. All rights reserved. This report or any portion hereof may not be reprinted, sold or
redistributed without the written consent of J.P. Morgan.#$J&098$#*P
23. 23
Asia Pacific Equity Research
02 December 2010
Princy Singh
(91-22) 6157 3587
princy.singh@jpmorgan.com