

Empfohlen
Weitere ähnliche Inhalte
Andere mochten auch
Ähnlich wie Introduction To R
Ähnlich wie Introduction To R (20)
Kürzlich hochgeladen
Kürzlich hochgeladen (20)
Introduction To R
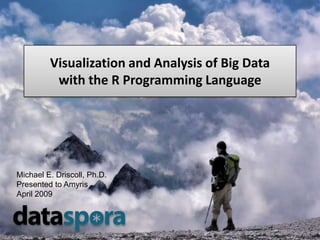
- 1. Visualization and Analysis of Big Data with the R Programming Language Michael E. Driscoll, Ph.D. Presented to Amyris April 2009
- 3. “The sexy job in the next ten years will be statisticians.” – Hal Varian, Chief Economist, Google
- 4. What is R? What can it do? • data manipulation • statistics • visualization Why is it different? • created by statisticians • free, open source • extensible via packages
- 5. What is R? Data Manipulation Data Visualization • database connectivity • slicing & dicing data cubes Statistical Analysis • hypothesis testing • model fitting • clustering • machine learning
- 7. I. Taming Microarray Data with Bioconductor Statistical analysis Visualization of hybridization artifacts • fit models for the distributions of expression values • test hypotheses about outliers • cluster genes with similar patterns http://www.bioconductor.org
- 8. 1million transactions during this presentation
- 9. II. Clustering Product Purchases Statistical analysis Which products are ordered together? • every customer has a history of product purchases • hierarchically cluster products and customers • other approaches (depending on goals): singular value decomposition
- 10. 2 billion clicks during this presentation
- 11. III. Optimizing Online Advertising Statistical analysis How confident are we that B beats A? • estimate posterior distributions for click rates from observed data • test hypothesis that the click-rate of a given ad A is greater than for ad B
- 13. IV. A Tale of Two Pitchers Hamels Webb
- 14. R Nuts and Bolts “The best thing about R is that it was developed by statisticians. The worst thing about R is that… it was developed by statisticians.” – Bo Cowgill, Google
- 15. Data Manipulation Getting Data In Getting Data Out SQL Data formats: • MySQL • Delimited (CSV, Excel) • ODBC (Oracle, MS-SQL) • Matlab Excel Graphic formats: • Vector (PDF, EPS, SVG) Matlab • Raster (PNG, TIFF) driver <- dbDriver(quot;MySQLquot;) con <- dbConnect(driver,user=“tgardner”, password=“julien05”, host=“data.amyris.com”, dbname=“biofx”) resultSet <- dbSendQuery(con, “SELECT * FROM assay”) data <- fetch(resultSet, n=-1)
- 17. Extending R with Packages CRAN http://cran.r-project.org • ~ 2000 packages • organized by field • easy to install > install.package( “lattice”)
- 18. R Packages: Beautiful Colors with Colorspace library(“Colorspace”) red <- LAB(50,64,64) blue <- LAB(50,-48,-48) mixcolor(10, red, blue)
- 19. R Packages: Creating Panel Plots with Lattice library(“Lattice”) xyplot(x ~ y | pitch_type, data = gameday)
- 20. Getting Started Choose a UI Download at R-project.org • Emacs – ESS • JGR – Java GUI for R • Rattle http://www.r-project.org
- 21. Getting Help Online Books • use inline help > ?plot • search /post at R-help http://tolstoy.newcastle.edu.au/R Modern Applied Statistics with S W.N.Venables & B.D. Ripley Use R series includes 20 volumes http://www.springer.com/series/6991
- 22. Data Desktop
- 23. Which is Easier? or Coding Clicking
- 24. R-Based Dashboards A Simple Script setContentType(quot;text/htmlquot;) png(quot;/var/www/hello.pngquot;) plot(sample(100,100),col=1:8,pch=19) dev.off() cat(quot;<html>quot;) cat(quot;<body>quot;) cat(quot;<h1>hello world</h1>quot;) cat('<img src=quot;../hello.pngquot;') cat(quot;</body>quot;) cat(quot;</html>quot;) Download Jeff Horner’s Rapache at http://biostat.mc.vanderbilt.edu/rapache/
- 25. R-Based Dashboards http://labs.dataspora.com/gameday
- 27. Contacting Us 350 Townsend St, Suite 270 San Francisco, CA 415-860-4347 inquire@dataspora.com
Hinweis der Redaktion
- As Tim mentioned, I am the principal of Dataspora LLC, in San Francisco.My overarching theme is “Big Data”. What do we mean by this term? To paraphrase Ben Lorica of O’Reilly Media, it means ‘data big enough that you have to think about it… how to store it, how to analyze it.’
- Kevin Kelly and others have estimated that 100 billion clicks per day on the web.Facebook gets a few percent of these: you can understand why they have data scientists.In any case, that’s 2 billion in the half-hour your listening to me.Many of those clicks are paid for. All of them are recorded.This is the basis of web analytics. It’s a huge step forward for advertising.
- Years ago, John Wanamaker a retail merchant stated, “Half the money I spend on advertising is wasted. The trouble is, I don’t know which half.”Online advertising changes this. Companies measure ad effectiveness at several levels. Given that billions of dollars are spent, this matters.DATA SET: Millions of clicks on thousands of keyword advertisements.Above is a selected data point from data for two ads running for a client of ours, a Fortune 500 company in the home furnishings business. Ad A is the ad they’ve been running for several months now: it’s been viewed 739 times and clicked just 18 times: a click rate of 2.4%.Ad B is a second ad they’ve been running for only a couple of weeks: it’s been viewed 162 times and click 7: a click rate of 4.3%Our basic hypothesis is: is ad B better than ad A?I took a basic approach, using Bayesian analysis, to estimate the posterior distributions for click rates based on our observed data. By comparing these posterior distributions, I can assess the confidence that B outperforms A. The gist here is this: the tighter our posterior distribution, and the more confidence we have in our comparison.Truthfully, this could have been done in any language – but the full process – and the visualization you see here, was made significantly easier in R.Lesson: Because this was done in R, our code is now deployed on their web server: no additional software licenses are needed.[TRANSITION]So we’ve discussed life sciences data, retail and web data, but now let’s discuss a data set that really matters.
- On the left is Cole Hamels, who (I’m told) took the Phillies to victory in this year’s WS.On the right is a diagram of the PitchFX system, which in the 2008 season, used special cameras to record the speed, position, and many other attributes – as seen in the diagram – of over one million pitches thrown.What’s remarkable: this data is made publicly available as XML by Major League Baseball. We can get, pull into R, and crunch it.I talked to one of my friends: asked, who’s interesting to look at? He said ‘Cole Hamels’.Cole Hamels is a finesse pitcher: he doesn’t
- On the top is Cole Hamels, who (I’m told) took the Phillies to victory in this year’s WS.On the bottom is Brandon Webb(among) two ways to beat batters:- vary speed- vary locationCole Hamels is a finesse pitcher, he is able to paint corners; he generally throws his fastballs and change-ups to different places. A may know it’s a fastball, but not where it will end up.Brandon Webb's pitches his fastballs and change-ups to the same location, he varies speed: a batter knows where it will end up, just not how fast.Second, this example shows us how to color multivariate data [draw from color post]:We are looking at six dimensions of color here: 1 and 2. x and y location of the pitch 3. pitch type 4. pitch speed 5. pitch density (lots of pitches make darker luminosity with out changing hue) 6. pitcher (Cole or Hamels)
- Now I’d like to discuss some finer aspects of the R language: it is a functional language, like Lisp and Haskell its syntax is somewhat quirky (‘<--’ is the assignment operator) all objects are stored in memory – for most users, this imposes certain limits yet it has extensive abilities to connect to persistent data stores (files, databases)
- This is a sample of statistical models available within R and via its packages.
- Making Beautiful Colors with the Colorspace packageRoss Ihaka’sColorspace package provides access to useful colorspaces beyond RGB, like LAB and HSV. These colorspaces are preferred by artists and designers for their more intuitive properties.This is the package I used to design the palettes in the PitchFX dashboard. I’ve posted further thoughts on using color in data visualizations at:http://dataspora.com/blog/how-to-color-multivariate-data/
- RenderStatistical Models into Visualizationswith the Lattice PackageOne of the most powerful visualization tools available is DeepayanSarkar’s Lattice package.Lattice translates R’s model syntax (such as ‘x ~ y’) into a visual representation.It is available on CRAN, with great code examples here. http://lmdvr.r-forge.r-project.org/figures/figures.htmlLattice is an R implementation of William Cleveland’s Trellis graphics system, developed at Bell Labs.
- Today I want to talk about data.We live in a world exploding with data. In any given minute, databases somewhere are tracking mouse clicks on web sites, point of sale purchases, rider swipes through subway turnstyles, physician prescriptions, digital video recorder rewinds, and the location of every GPS-enabled car and phone on the planet.Prof. Joe Hellerstein of Berkeley has dubbed it: The Industrial Revolution of Data – machines are generating data.So the world is streaming billions of data points per minute. This is Big Data – capital B, capital D. But capturing data isn’t enough. We need tools to make sense of it.At Facebook, they call their data analysts, ‘data scientists’. I like this term, because it captures the point of collecting this data: testing hypotheses about the world.And to test hypotheses using Big Data, we need statistics.
- Some tips on getting started with R.
- I suggest help in this order: books, inline help, and the R-help list. Lest its title deceive you, “Modern Applied Statistics with S” is about the R programming language.
- Moving Analytics from the Desktop to the CloudThe cloud is an enormous, amorphous place with more data than you could possibly conceive.The ‘cloud’ is just a useful abstraction, like ‘the web.’ What’s new is the scale and scope: Amazon has opened up their infrastructure, allowing – in effect – any one to rent power on their compute farm, dubbed EC2. Google has done the same, albeit allowing access at a higher level with Google App Engine.I. Data is heavy, software is lightData is growing in size and scope, it is getting heavy. Analysis software should “live” near its target data, because of network latencies and storage requirements. For enormous data sets, it’s the fastest way to move data is not the fiber, but FedEx – not the internet, but sneaker net (as the late Jim Gray termed it). The key is to move data as little as possible.II. Analytics can’t (and shouldn’t) be done on the desktopIn an age of Linked Big Data (c.f. http://blog.ted.com/2009/03/tim_berners_lee_web.php , http://dataspora.com/blog/tipping-points-and-big-data/ ) it’s not feasible nor desirable to store terabytes of data on the desktop. Not every firm has hit this breaking point, but many are approaching it.III. CPU power becomes a utility – like electricity or water,pay as you go. It means that (in theory) web applications – like electrical appliances – can plug into any CPU power grid. And those grids, in turn, have vastly fewer idle cycles. It democratizes access to CPU power and drives the price of commodity CPU computing ever lower.With the cloud, no organization should maintain a cluster that runs at less than 50% capacity (this is effectively every academicresearch organization in America).
- I’ve espoused R, but the truth is – I think the world would be an even better place if none of us ever had to use it.That’s not going to happen, but we can approximate this: only where have to do something new.Otherwise, if we’re doing something that everyone always does, we can use R – but indirectly, through a web interface. The problem is that right now, too many of us are repeating the steps in data analysis. We struggle to extract data from some online source.We struggle to format it into a shape we can work with, and import it into our tool of choice.We haggle over color choices.Wouldn’t it be great if there was a platform that facilitated data analysis?Where we could share our data sets.Where we could perform analysis online, without downloading to our desktopWhere we could visualize results1. Merck is onto something with its SAGE platform for life sciences data.We at dataspora are working on it… to be continued….
- Our tool of choice for embedding R within the web is rapache, developed by Jeff Horner at Vanderbilt University. http://biostat.mc.vanderbilt.edu/rapache/Here I show an example of using it to generate a dynamic plot.An alternative approach to printing HTML directly, is to use a templating system, available via the R package brew (also developed by Jeffrey Horner), downloadable on CRAN and at:http://www.rforge.net/brew/
- You can explore this data yourself on a web dashboard I’ve created.This web dashboard has R running on the inside.More than a toy, putting not just data – but analysis – on the web is an important step for several reasons: demonstrates why open source matters: I can embed R inside a web server, without licensing restrictions data and the processing can both live on the server – important when your data set is huge (this one is around 20 Gigabytes) when the data changes, the dashboard updates no software installation neededWeb applications are about moving our analytics from our desktops onto the network.It’s not a new concept: devolving power from the desktop to machines that live on the network. But where is this magical place – where my data and analytics servers run?
- To conclude: we live in a world that is overflowing with data. There are many more Big Data sets that I didn’t talk about today – Geospatial Data, for one – that R can be useful for.This is both a challenge and an opportunity: a challenge to cope with it.An opportunity because – with the right tools such as R – this data can help us engineer the world around us -- whether it be bacterial cells, business processes, or baseball pitchers.
- Enter the programming language R.“The sexy job in the next ten years will be statisticians… The ability to take data—to be able to understand it, to process it, to extract value from it, to visualize it, to communicate it—that’s going to be a hugely important skill.”-Hal Varian, Mckinsey Quarterly, January 2009http://www.mckinseyquarterly.com/Hal_Varian_on_how_the_Web_challenges_managers_2286
- R is an open source programming language for statistical computing, data analysis, and graphical visualization.It has one million users worldwide, and its user base is growing. While most commonly used within academia, in fields such as computational biology and applied statistics, it is gaining currency in commercial areas such as quantitative finance – it is used by Barclay’s – and business intelligence – both Facebook and Google use R within their firms.It was created by two men at the University of Auckland – pictured in the NYT article on the rightOther languages exist that can do some of what R does, but here’s what sets it apart:1. Created by StatisticiansBo Cowgill, who uses R at Google has said: “the great thing about R is that it was created by statisticians.” By this – I can’t speak for him – that R has unparalleled built-in support for statistics. But he also says “the terrible thing about R is… that it was created by statisticians.” The learning curve can be steep, and the documentation for functions is sometimes sparse. Free, open sourcethe importance of this can’t be understated. anyone can improve to the core language, and in fact, a group of few dozen developers around the world do exactly this. the language is constantly vetted, tweaked, and improved.Extensible via packagesthis is related to the open source nature of the language. R has a core set of functions it uses, but just as Excel has ‘add-ons’ and Matlab has ‘toolkits’, it is extensible with ‘packages’. This is where R is most powerful: there are over 1000 different packages that have been written for R. If there’s a new statistical technique or method that has been published, there’s a good chance it has been implemented in R.Audience survey: How many of you use R regularly? Have ever used R? Have ever heard of R?
- Programming languages are merely tools, and while many different languages can do what R does – few combine them into a single environment:data manipulation: this means connecting to databases like MySQL or Oracle, to slice and dice through large, multivariate data sets. I’ve programmed in many languages, but I’ve rarely found a better tool for indexing into data.II. statistical analysis: this is, hands down, the most powerful aspect of R. hypothesis testing: Bayesian analysis or chi-squared tests model fitting: general linear models, linear mixed-effects models, least angle regression approachesclustering: k-means and others machine learning: recursive partitioning, neural networks, support vector machinesclassical statistics functions – such all commonly used probability distributions – are part of the core language. more cutting edge and sophisticated techniques can be found as packages. data visualization – perhaps my favorite part (I’m a visualization nut). visualization is most useful not in testing hypotheses, but in formulating them. nothing helps one understand data than by looking at it.OK, having given you an idea of what R is: I am going to present four case studies of where I’ve used R to tackle Big Data. Let’s begin with one of the most data intensive application in the life sciences:(Slide) Microarrays
- Microarrays: this is a view of a custom microarray I designed in graduate school, manufactured by Santa Clara’s own Affymetrix. This particular chip was used to measure gene expression levels – it targeted ~ 4,000 genes using 100,000 distinct oligonucleotide probes.On the right we have the output of a typical microarray assay: the colors correspond to RNA expression levels.R has a wonderfully powerful suite of packages, called Bioconductor, that can help analyze microarray data.
- Here I give just one example of what Bioconductor can do.The data visualization on the right, called an M-A plot, is a variation of an XY scatter plot, where we are comparing the observed signals for particular microarray, to a composite background distribution – both are ordered by intensity of signal– deviations from the straight line show differences between our array and the background (in this case, our array tends to have higher signals across the board). Typically we generate an M-A plot for every array in our compendium to yield a big picture view of the consistency of our arrays across experiments – the flatter the red lines, the better (remember that in most models of cellular behavior we expect only a small fraction of genes to change in expression).(The IQR is a general measure of spread: in this case we’re looking at the IQR of the M value – the marginal distribution on the left side – basically tells us that the difference between the 25% and 75% is 0.697, and the median is 0.537 – in a perfect situation we’d have a median == 0).TRANSITION: Now I’m going move beyond the realm of life sciences and talk about other places in the world of Big Data.
- Point-of-sale data is generated at an incredible rate. In fact, there will be 1 million transactions logged during this presentation alone.Data collected in a variety of ways: via credit cards, but also via bar code scanners, and loyalty cards at supermarkets that tether you to the baskets of goods you buy. Collecting, storing, and analyzing consumer data a billion dollar business.The data warehouses where this data is stored are useful for running reports, but poor at doing analysis.You could ask many different questions of this data. I recently had a client ask me:Which products do our customers buy together?
- To answer the question, “Which products do our customers buy together?” I used a relatively simple data set: one million customer transactions and a list of products they had purchased.Methods:clean and format their data properlyload it into a relational databasepull data into Rrun hierarchical clustering algorithmOnce the data was properly formatted in R – the hierarchical clustering was accomplished with a single command. How great is that?I delivered this to our client, so that his salespeople could say, “If you liked this, you’re sure to like that.” Lesson: Data clean-up and formatting was 80% of the work.Lesson: R allows me to not reinvent the wheel – and build on other data researchers’ efforts.Lesson: Techniques that are relatively simple in life sciences, are considered rocket science in the business world.(Q to answer: what clustering algorithm did you use here?)