Identifying Subpopulation Least Likely to Use Mosquito Nets after Mass Distribution Campaigns: The Case of Kano State, Nigeria
•
0 gefällt mir•405 views

Presented at the ASTMH Conference in November 2013.
Empfohlen

Empfohlen
Weitere ähnliche Inhalte
Was ist angesagt?
Was ist angesagt? (20)
Ähnlich wie Identifying Subpopulation Least Likely to Use Mosquito Nets after Mass Distribution Campaigns: The Case of Kano State, Nigeria
Ähnlich wie Identifying Subpopulation Least Likely to Use Mosquito Nets after Mass Distribution Campaigns: The Case of Kano State, Nigeria (20)
Mehr von MEASURE Evaluation
Mehr von MEASURE Evaluation (20)
Kürzlich hochgeladen
Kürzlich hochgeladen (20)
Identifying Subpopulation Least Likely to Use Mosquito Nets after Mass Distribution Campaigns: The Case of Kano State, Nigeria
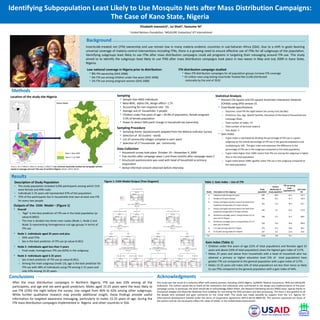
- 1. Background Identifying Subpopulation Least Likely to Use Mosquito Nets after Mass Distribution Campaigns: The Case of Kano State, Nigeria Methods Insecticide-treated net (ITN) ownership and use remain low in many malaria endemic countries in sub-Saharan Africa (SSA). Due to a shift in goals favoring universal coverage of malaria control interventions including ITNs, there is a growing need to ensure effective use of ITNs for all subgroups of the population. Identifying subgroups least likely to use ITNs after mass distribution campaigns could aid programs in targeting their messaging around ITN use. This study aimed to to identify the subgroups least likely to use ITNS after mass distribution campaigns took place in two waves in May and July 2009 in Kano State, Nigeria. Results Sampling • Sample Size=4602 individuals • Beta=80%, alpha=5%, design effect= 1.75 • Accounting for non-response rate: 5% • Average size of household= 5 people • Children under five years of age = 20.0% of population, female pregnant 3.5% of female population • Power to detect 50% point change in household net ownership Sampling Procedure • Sampling frame: Questionnaire adapted from the Malaria Indicator Survey • Selection of 30 clusters - wards • List of community-villages compiled in each ward • Selection of 17 households per community Data Collection • Household survey took place October 19 – November 4, 2009 • Five months after campaign wave 1 and three months after campaign wave 2 • Structured questionnaire was used with head of household as primary respondent • Verbal informed consent obtained before interview Statistical Analysis • Pearson Chi-square and Chi-square Automatic Interaction Detector (CHAID) using SPSS version 21 • Final Model Specifications o Outcome: Used ITN the night before the survey visit (Yes/No) o Predictors: Sex, Age, Wealth Quintile, Education of the Head of Household and Campaign Wave o Total number of nodes: 14 o Total number of terminal nodes:8 o Tree depth: 3 • Gain Index o A gain index is calculated by dividing the percentage of ITN use in a given subgroup by the overall percentage of ITN use in the general population and multiplying by 100 . The gain index and expresses the difference in the percentage of ITN use in the subgroup compared to the total population. o A gain index higher than 100% means that ITN use among the subgroup is higher than in the total population. o A gain index below 100% signifies lower ITN use in the subgroup compared to the total population. Conclusions After the mass distribution campaigns in Northern Nigeria, ITN use was 53% among all the participants, and age and sex were good predictors. Males aged 15-25 years were the least likely to use ITN (23%) the night before the survey. Use ranged from 46% to 62% among other subgroups. While further qualitative research may provide additional insight, these findings provide useful information for targeted awareness messaging, particularly to males 15-25 years of age, during the ITN mass distribution campaigns implemented in Nigeria and other countries in SSA. Acknowledgments This study was the result of a collective effort with several partners including USAID Nigeria, SuNMAP, Malaria Consortium, RMS and MEASURE Evaluation. The authors would like to thank all the institutions and individuals who contributed to the design and implementation of the post- campaign survey. In particular, the team would like to acknowledge Albert Killian, the Research Marketing Service (RMS) team. Special thanks to Emmanuel Adegbe and Olatunde Oladimeji from SuNMap for overseeing the field activities and data processing. The team is also grateful to all the people who reviewed and gave comments on the initial draft. This study was made possible by support from the U.S. Agency for International Development (USAID) under the terms of Cooperative Agreement GPO-A-00-03-00003-00. The opinions expressed are those of the authors and do not necessarily reflect the views of USAID, or the United States Government. Location of the study site-Nigeria Wave 1 May 2009 Wave 2 July 2009 Kano State Warawa Source: Ye Y, Patton E, Kilian A, Dovey S, Eckert E: Can universal insecticide-treated net campaigns achieve equity in coverage and use? The case of northern Nigeria. Malar J 2012, 11:32. Low national coverage in Nigeria prior to distribution: • 8% ITN ownership (DHS 2008) • 6% ITN use among children under five years (DHS 2008) • 5% ITN use among pregnant women (DHS 2008) ITN distribution campaign studied: • Mass ITN distribution campaigns for all population groups increase ITN coverage • 63 million new Long lasting Insecticide Treated Net (LLIN) distributed nationally by the end of 2010 Familyutilizesprotectivemalariabednetsintheirhome.Nigeria. Photo:ArneHoel/WorldBank Nodes Description on the subgroup Study population Percent distribution of study population ITN use among study population (%) Gain index (%) 2 Individual under the age of 5 years 639 20.9 62.1 117.1 4 Females of 25 years and plus 491 16.1 61.7 116.3 8 Primary and higher education level of the head of the household, among males of 25 years and plus 352 11.5 46.3 87.2 9 Primary and higher education level of the head of the household, among males of 25 years and plus 136 4.5 62.5 117.8 10 Distribution campaign waive 1 among females of 5-15 years and 15-25years 358 11.7 47.2 88.9 11 Distribution campaign waive 2 among females of 5-15 years and 15-25years 410 13.4 56.6 106.6 12 5-15 years among males of 5-25years 473 15.5 48.0 90.4 13 15-25 years among males of 5-25years 197 6.4 23.4 44.0 Total 3,056 100 53.1 Description of Study Population • The study population included 3,056 participants among which 51% were female and 49% male. • Individuals 5-25 years old represented 47% of the population. • 75% of the participants live in households that own at least one ITN for every two people. Outputs of the CHAI Model – (Figure 1) • Overall o “Age” is the best predictor of ITN use in the total population (p- value<0.0001) o The tree is divided into three main nodes (Node 1, Node 2 and Node 3) representing homogeneous sub age groups in terms of ITN use • Node 1- Individuals aged 25 years and plus o 56% used ITNs o Sex is the best predictor of ITN use (p-value=0.001) • Node 2- Individuals aged less than 5 years o Final node, homogenous ITN use (62%) in the subgroup • Node 3- Individuals aged 5-25 years o Sex is best predictor of ITN use (p-value<0.001). o Among the male subgroup (node 13), age is the best predictor for ITN use with 48% of individuals using ITN among 5-15 years and only 23% among 15-25 years. Gain Index (Table 1) • Children under five years of age (21% of total population) and females aged 25 years and above (16% of total population) share the highest gain index of 117%. • Males 25 years and above from households with a head of household who has attained a primary or higher education level (5% of total population) have greater ITN use compared to the general population with a gain index of 117%. • Males 15-25 years old males (6% of total population) are less than twice as likely to use ITNs compared to the general population with a gain index of 44%. Figure 1: CHAI Model Output (Tree Diagram) Table 1: Gain Index – Use of ITN Elizabeth Ivanovich1, Jui Shah2, Yazoume Ye2 1United Nations Foundation, 2MEASURE Evaluation/ ICF International