More Related Content Similar to Investigation06 en (20) 1. Biology teacher support material
Investigation 6
Comparing leaf adaptations in two groups of Ilex aquifolium in terms of number
of prickles per leaf
Background
A leaf's form and function reflects the environment in which that plant lives in, for
plants tend to adapt to their habitat. Leaf adaptations happen in terms of
competition and environmental conditions. Temperature, light intensity, carbon
dioxide availability, humidity, water availability among others can act as limiting
factors in the growth and development of plants by influencing the rate of cell
division, cell metabolism and photosynthesis. It is for this reason that the same
plants are not found in all geographical ranges.
Plants tend to modify their features to guarantee survival; such modifications can be
carried through genes leading to successful evolution.
Surface area has a great impact on a leaf's activities because the main substances
needed to carry out important reactions such as photosynthesis and cellular
respiration. Substances need to diffuse into and out of the cell The larger the
surface area, therefore, the greater the amounts of substances that enter and leave
the cell, and at a higher rate: diffusion is more effective. Similarly, the surface area
has an impact on capturing energy from the sun, which is vital for cell functioning.
Aim
To compare the number of prickles per leaf on branches of Ilex aquifolium coming
from the east side and west side of a holly tree as an indication of leaf adaptations.
Hypotheses
The leaves on the branches on the eastern side of the Ilex aquifolium bush receive
sunlight from the time when the sun rises until noon; the leaves on the branches on
the western side of the tree receive sunlight from noon until the sun sets. Since the
time period for receiving sunlight is almost the same for both sides of the tree there
would be no need for special adaptations in either the east or the west. Thus, the
average number of prickles in both wood sectors of the tree would be the same. If
there are no limitations for either the west or east leaves then no special surface
area adaptations are required and so the average number of prickles for each
should be equal
HO: There is no significant difference between the number of prickles in the leaves
from the east and the west sides of the Ilex aquifolium tree.
HA: There is a significant difference between the number of prickles per leaf in Ihe
east and west sides of the tree.
Variables
-Independent: location of the branch when attached to the bush: east or
west.
-Dependent: Number of prickles per leaf.
-Controlled: species of the tree and the tree itself.
© International Baccalaureate Organization 2007
2. Biology teacher support material
Investigation 6
Materials
5 branches of Ilex aquifolium from the east side of the tree
5 branches of Ilex aquifolium from the west side of the tree
Paper
Pen
Calculator
Procedure
1.Separate the branches from the east side from those from the west side to
make sure they do not get mixed.
2. Label each type 'east' and 'west' to identify them.
3. Notice any striking feature that may differentiate one side form the other and
record the observations.
4. Draw a label on the piece of paper to collect the data, separating the east side
from the west side.
5. Collect the data: count the number of prickles per leaf for each branch and
record the information in the table. Do this for the five branches for each side.
6. Study the average number of prickles per leaf on each side.
7. Study if there is a significant difference between the number of prickles of the
two populations using the t-test.
© International Baccalaureate Organization 2007
3. Biology teacher support material
Investigation 6
Raw data
Table 1
© International Baccalaureate Organization 2007
4. Biology teacher support material
Investigation 6
Graphs
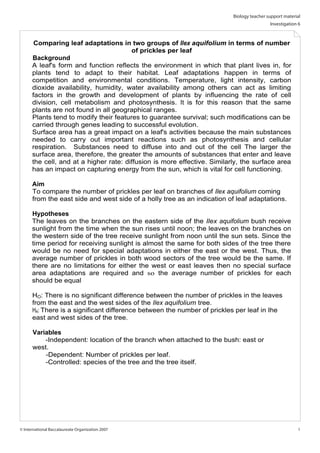
Graph 1: Frequency distribution of the number of prickles per leaf in the west side.
Frequency distribution of the number of prickles per
leaf in the west side
0
10
20
30
1 2 3 4 5 6 7 8 9 10 11 12 13 14 15 16 17 18
Number of prickles per leaf
Frequency
Graph 2: Frequency distribution of the number of prickles per leaf in the east side.
Frequency distribution of the number of prickles per
leaf in the east side
0
10
20
30
1 2 3 4 5 6 7 8 9 10 11 12 13 14 15 16 17 18
Number of prickles per leaf
Frequency
© International Baccalaureate Organization 2007
5. Biology teacher support material
Investigation 6
Data Processing
Table 2: The student's t-test
Student's t-test
Frequency X-Mean (X - Mean2
)
Prickles West East West East West East
1 3 0 -7.8 60.84
2 1 1 -6.8 -8.65 46.24 74.82
3 7 1 -5.8 -7.65 33.64 58.52
4 5 4 -4.8 -6.65 23.04 44.22
5 10 3 -3.8 -5.65 14.44 31.92
6 6 9 -2.8 -4.65 7.84 21.62
7 10 8 -1.8 ·3.65 3.24 13.32
8 15 5 -0.8 -2.65 0.64 7.02
9 8 16 0.2 -1.65 0.04 2.72
10 20 15 1.2 -0.65 1.44 0.42
11 15 25 2.2 0.35 4.84 0.12
12 13 16 3.2 1.35 10.24 1.82
13 4 10 4.2 2.35 17.64 5.52
14 7 11 5.2 3.35 27.04 11.22
15 2 9 6.2 4.35 38.44 18.92
16 2 7 7.2 5.35 51.84 28.62
17 0 1 6.35 40.32
18 0 1 7.35 54.02
Total 128 142
Mean 8.80 10.65
© International Baccalaureate Organization 2007
6. Biology teacher support material
Investigation 6
West Side
(X - mean)2
=1488.12
Variance = 1488.12 / n - 1, where n is the number of observations, 128
Variance = 11.72
Variance/n =0.092
East Side
(X - mean)2
=1467.74
Variance = 1467.74 / n – 1, where n is the number of observations. 142
Variance =10.41
Variance/n = 0.073
Difference between the means = 10.65 - 8.80 = 1.85
Calculating the t value
west
west
east
east
n
Variance
n
Variance
meansbetweenthedifference
t
+
=
073.0092.0
85.1
+
=t
t = 4.58
Degrees of freedom = neast + nwest - 2 = 268
The critical t value at 268 degrees of freedom and when P = 0.05 = 1.64
© International Baccalaureate Organization 2007
7. Biology teacher support material
Investigation 6
Results
The critical t value for 268 degrees of freedom at P = 0.05 is less than the t value
found 1.64 4.58. As t is greater than the critical value, the null hypothesis is rejected
and it is accepted that there is a significant difference between the number of prickles
per leaf at the east and west sides of an Ilex aquifolium tree.
The mean number of prickles per leaf on the west side of the tree (8.80) was less than
the mean for the east side (10.65). The t value measures the amount of overlap
between sets of data -east and west-; a t value greater than the critical value proves
that the difference between the means is significant.
Conclusion and Evaluation
The t value measures the amount of overlap between two sets of data. The larger the
t value, compared to the critical value, the more certain it is that there is a significant
difference between the two populations. In this case, the t-test shows that the number
of prickles per leaf on the east side of the Ilex aquifolium tree is significantly different to
the number of prickles per leaf on the west side of the same tree. Considering that
prickles are a leaf's adaptation to the conditions of the environment and that the
eastern and western leaves seem to adapt in the different way. It can be concluded
that the conditions are different. This, however, can be linked to the availability of
many abiotic factors and it is hard to define precisely. In general, a higher number of
prickles increases surface area, and facilitates diffusion of carbon dioxide and oxygen
and, above all, the capturing of solar energy for photosynthesis. The eastern side
leaves showed a greater number of prickles, and thus a greater surface area. This can
be explained as follows: during day time there is more sunlight available. Plants need
to take advantage of the conditions to carry out their metabolic processes. A higher
surface area allows the plants to be fully efficient because it allows them to use as
much energy from the sun as if is available. Having a greater number of prickles is a
modification that shows how plants adapt to their environment to guarantee survival.
Similarly, the leaves on the western side of the tree have a smaller number of prickles
because the conditions do not require them to increase surface area.
Yet this experiment limits itself to compare the number of prickles per leaf on each
side of the tree; it does not provide an explanation for the observed data. Its biggest
limitation, therefore, is that it does not directly account for the effect abiotic factors
have on the adaptations of the tree. Further investigations could provide an insight
and confirmation to the results here obtained.
Nonetheless, it is important to consider the amount of error involved in this
experiment. Five branches per side were taken as representatives of the whole tree, a
larger sample would have been needed to give more accurate results and reach
more asserted conclusions. Also, collection error should be accounted for: the
data was collected by counting each prickle and there is a chance that
miscounting occurred. This could have affected the results in some way. In
addition the error introduced by the t-test has to be taken into consideration.
Figures need to be rounded up when worked with and this leads to a loss in
accuracy.
Leaf adaptations were considered mainly in relation to light availability, but other
factors that play a role in leaf adaptations, such as carbon dioxide availability,
were not taken into consideration. The study of the effect of other abiotic factors
and limitations in leaf distribution of the same species would complement this
investigation. For example, the rate of photosynthesis could be measured for both
sides to compare their efficiency. Also, for further investigations it is suggested
that a more precise sample is studied; it could be either a larger sample or one
that is a representative as possible of the whole tree. Also, the results found could
© International Baccalaureate Organization 2007
8. Biology teacher support material
Investigation 6
be compared to those of other trees of the same species, to determine if the
modification in the leaves is an adaptation of this tree or of the species in general.
Sources
Green, Stout Taylor, Biological Science 2: Systems, Maintenance and Change.
Great Britain: Cambridge University Press, 1989.
The Leaf. Published at: www.encarta.msn.com. Last modification: 2003.
© International Baccalaureate Organization 2007