Using Grammatical Signals Suitable to Patterns of Idea Development
MCC actuarial report 3.21.11
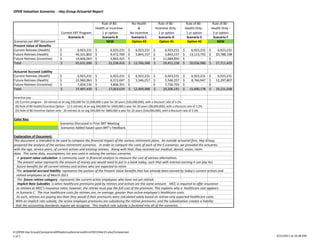
1. OPEB Valuation Scenarios - Hay Group Actuarial Report
Rule of 80 - No Health Rule of 80 - Rule of 80 - Rule of 80 -
Health or Incentive - & Incentive Only - Health Only - Health Only -
Current ERT Program 1 yr option No Incentive 1 yr option 1 yr option 3 yr option
Scenario A Scenario B Scenario C Scenario D Scenario E Scenario F
Scenarios per BRT Document NEW Option #3 Option #1 Option #2 NEW
Present Value of Benefits
Current Retirees (Health) $ 6,923,231 $ 6,923,231 $ 6,923,231 $ 6,923,231 $ 6,923,231 $ 6,923,231
Future Retirees (Health) $ 44,101,802 $ 9,472,760 $ 5,843,157 $ 5,843,157 $ 13,113,755 $ 20,788,198
Future Retirees (Incentive) $ 14,606,063 $ 5,842,425 $ - $ 11,684,850 $ - $ -
Total $ 65,631,096 $ 22,238,416 $ 12,766,388 $ 24,451,238 $ 20,036,986 $ 27,711,429
Actuarial Accrued Liability
Current Retirees (Health) $ 6,923,231 $ 6,923,231 $ 6,923,231 $ 6,923,231 $ 6,923,231 $ 6,923,231
Future Retirees (Health) $ 22,960,063 $ 6,272,047 $ 5,546,257 $ 5,546,257 $ 8,766,947 $ 12,297,807
Future Retirees (Incentive) $ 7,604,136 $ 3,868,351 $ - $ 7,736,703 $ - $ -
Total $ 37,487,430 $ 17,063,629 $ 12,469,488 $ 20,206,191 $ 15,690,178 $ 19,221,038
Incentive pay -
(A) Current program - 20 retirees at an avg $50,000 for $1,000,000 a year for 20 years ($20,000,000), with a discount rate of 3.2%
(B) Rule of 80 Health/Incentive Option - 12.5 retirees at an avg $40,000 for $400,000 a year for 20 years ($8,000,000), with a discount rate of 3.2%
(D) Rule of 80 Incentive Option only - 20 retirees at an avg $40,000 for $800,000 a year for 20 years ($16,000,000), with a discount rate of 3.2%
Color Key:
Scenarios Discussed in Prior BRT Meeting
Scenarios Added based upon BRT's Feedback.
Explanation of Document:
This document is intended to be used to compare the financial impact of the various retirement plans. An outside actuarial firm, Hay Group,
prepared the analysis of the various retirement scenarios. In order to compute the costs of each of the 6 scenarios, we provided the actuaries
with the age, service years, of current actives and existing retirees. Along with that, they received our medical, dental, vision, claim
data. This same data, assumptions, etc was used in valuing the various scenarios.
A present value calculation is commonly used in financial analysis to measure the cost of various alternatives.
The present value represents the amount of money you would need to put in a bank today, such that with interest earning it can pay ALL
future benefits for all current retirees and actives who are expected to retire.
The actuarial accrued liability represents the portion of the Present Value benefits that has already been earned by today's current actives and
retired employees as of March 2011.
The future retiree category represents the current active employees who have not yet retired.
Implicit Rate Subsidies is when healthcare premiums paid by retirees and actives are the same amount. MCC is required to offer insurance
to retirees at MCC's insurance rates; however, the retiree must pay the full cost of the premium. This explains why a healthcare cost appears
in Scenario C. The true healthcare costs for retirees are, on average, greater than active employee's healthcare costs.
As such, retirees are paying less than they would if their premiums were calculated solely based on retiree-only expected healthcare costs.
With an implicit rate subsidy, the active employee premiums are subsidizing the retiree premiums, and the subsidization creates a liability
that the accounting standards require we recognize. This implicit rate subsidy is factored into all of the scenarios.
H:OPEB Hay GroupComparionsOfHayGroupScenariosAthruF2011Mar15.xlsx/Comparison
1 of 1 3/21/2011 at 10:28 AM