SlideShare ist ein Scribd-Unternehmen logo
1 von 7
Turning Point Student Response Clickers


   •   Click the TurningPoint Software Icon to open the student response clicker software. (This can also be
       found in the Program menu or from opening PowerPoint itself).


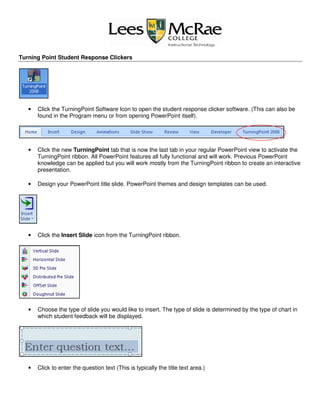
   •   Click the new TurningPoint tab that is now the last tab in your regular PowerPoint view to activate the
       TurningPoint ribbon. All PowerPoint features all fully functional and will work. Previous PowerPoint
       knowledge can be applied but you will work mostly from the TurningPoint ribbon to create an interactive
       presentation.

   •   Design your PowerPoint title slide. PowerPoint themes and design templates can be used.


   •   Click the Insert Slide icon from the TurningPoint ribbon.


   •   Choose the type of slide you would like to insert. The type of slide is determined by the type of chart in
       which student feedback will be displayed.


   •   Click to enter the question text (This is typically the title text area.)
•   Click to enter answer text. (This is typically the bulleted text area.)


•   Click drop down boxes for each answer to supply answer values.

To supply Correct Answer Indicators


•   Click Insert Object


•   Choose Correct Answer Indicator

•   While there are more advanced features, at this point you can use the presentation with anonymous
    participants.
To Show Presentation

   •   Plug in the USB adapter
   •   Give each student a response clicker (for anonymous participants give any clicker to any student)


   •   Click the Slide Show tab (typical slide show mode in PowerPoint)


   •   Click From Beginning


   •   A toolbar will appear at the top of the slide show presentation view.
   •   Polling Open means students are currently responding to the slide
   •   Responses will display the number of students who have responded by pressing an answer on the
       clicker.
   •   From this point mouse clicks control the progression of information.


           1. Click to close polling
           2. Click again to display correct answer indicator
           3. Click a third time to display the chart of student responses

Reset Session

Resetting a session erases the current student response information. All charts are reset to 0% for all answers.
Use this feature any time you want to start a presentation over without saving the student response data.


   •   Click Reset
•   Click Session

   •   You will see a box flash in the right hand corner that says “Please wait while session resets.”

                                               Advanced Features

Use the Countdown feature

   The Countdown feature inserts a 10 second timer. At the end of 10 seconds polling is closed.


   •   Click Insert Object


   •   Click Countdown


   •   Click the type of Counter you want

Using Participant Lists

Participant lists allow you to identify student users for grading or other user specific purposes.

Participant lists are generated based on an identification number on the back of each card. Assign each
student a specific card to track their answers. Participant lists are available to download online.
Participant list is set to Auto or Anonymous by default
   •   Download the appropriate participant list for the kit you have reserved from
       http://www.lmc.edu/web/academics/tlc/Clickers.htm


   •   Click Participants


   •   Click Import a Participant List
   •   Browse to find where you saved the downloaded Participant list for your reserved kit


   •   Select (click on) on the participant list you just imported


   •   Click Use Selected List


   •   To assign student names to specific response cards, click Participants


   •   Click Edit a Participant List
•   Choose the Participant List you just imported


   •   Supply a Student name for each clicker
           o   You can type in each name
           o   You can import a comma delimited file or .CSV file

Saving a Session

Saving a session will allow you to keep the student response information for the entire presentation for grading
purposes or other research. Saving a session is different that saving the presentation. To save your actual
presentation save as you would for any other file.


   •   Click Save Session
   •   Choose where to save session
   •   Provide file name for session
   •   Click Save
Report Features


   •   Click Tools
•   Click Turning Reports


•   Select the types of reports you would like to view


•   Click Generate Report

•   An Excel document will be generated with statistics based on your student responses and
    report category choices.

Weitere ähnliche Inhalte

Ähnlich wie Clicker software s09

Turning Point 2008 Training
Turning Point 2008 TrainingTurning Point 2008 Training
Turning Point 2008 Trainingjuliebenton
 
UIC Blackboard Learn Quick Start Guide
UIC Blackboard Learn Quick Start GuideUIC Blackboard Learn Quick Start Guide
UIC Blackboard Learn Quick Start GuideElizabeth Romero
 
The VLE @ GSA - assessment tools
The VLE @ GSA - assessment toolsThe VLE @ GSA - assessment tools
The VLE @ GSA - assessment toolsvlegsa
 
Connect virtual labs instructor
Connect virtual labs instructor Connect virtual labs instructor
Connect virtual labs instructor Paco Muñoz
 
Lapeer TurningPointTraining Presentation
Lapeer TurningPointTraining PresentationLapeer TurningPointTraining Presentation
Lapeer TurningPointTraining Presentationrdmayberr
 
Student welcome presentation coach catalfino - online hope
Student welcome presentation   coach catalfino - online hopeStudent welcome presentation   coach catalfino - online hope
Student welcome presentation coach catalfino - online hopeMattPryer
 
Swayam nptel - july 2019
Swayam nptel - july 2019Swayam nptel - july 2019
Swayam nptel - july 2019Ankit Dubey
 
New Administrator Training Tutorial for CourseSites
New Administrator Training Tutorial for CourseSitesNew Administrator Training Tutorial for CourseSites
New Administrator Training Tutorial for CourseSitesabchiocco
 
Boost Engagement: Include Academic Content in Online Discussions
Boost Engagement: Include Academic Content in Online DiscussionsBoost Engagement: Include Academic Content in Online Discussions
Boost Engagement: Include Academic Content in Online DiscussionsFred Feldon
 
Elluminate training intermediate
Elluminate training intermediateElluminate training intermediate
Elluminate training intermediateSusie Macfarlane
 
What are Clickers?
What are Clickers?What are Clickers?
What are Clickers?smceuen
 
Ali g zoho show time 17-18
Ali g zoho show time 17-18Ali g zoho show time 17-18
Ali g zoho show time 17-18AliGhanawi1
 
Blackboard Overview V1
Blackboard Overview V1Blackboard Overview V1
Blackboard Overview V1Tim Horgan
 
Orientation Session 2014 2015
Orientation Session 2014 2015Orientation Session 2014 2015
Orientation Session 2014 2015npeducation
 
COURSEEPLUS Instructor guide
COURSEEPLUS Instructor guideCOURSEEPLUS Instructor guide
COURSEEPLUS Instructor guideCourseeplus
 
StoryPulse- LivePoll guide for Administrator/Presenter
StoryPulse- LivePoll guide for Administrator/PresenterStoryPulse- LivePoll guide for Administrator/Presenter
StoryPulse- LivePoll guide for Administrator/PresenterFOCALCXM
 

Ähnlich wie Clicker software s09 (20)

Drafting Board self-guided training
Drafting Board self-guided trainingDrafting Board self-guided training
Drafting Board self-guided training
 
Turning Point 2008 Training
Turning Point 2008 TrainingTurning Point 2008 Training
Turning Point 2008 Training
 
The Live Online Class
The Live Online ClassThe Live Online Class
The Live Online Class
 
UIC Blackboard Learn Quick Start Guide
UIC Blackboard Learn Quick Start GuideUIC Blackboard Learn Quick Start Guide
UIC Blackboard Learn Quick Start Guide
 
The VLE @ GSA - assessment tools
The VLE @ GSA - assessment toolsThe VLE @ GSA - assessment tools
The VLE @ GSA - assessment tools
 
Connect virtual labs instructor
Connect virtual labs instructor Connect virtual labs instructor
Connect virtual labs instructor
 
Buzinski 3 Design Of Host Training
Buzinski 3 Design Of Host TrainingBuzinski 3 Design Of Host Training
Buzinski 3 Design Of Host Training
 
Lapeer TurningPointTraining Presentation
Lapeer TurningPointTraining PresentationLapeer TurningPointTraining Presentation
Lapeer TurningPointTraining Presentation
 
Student welcome presentation coach catalfino - online hope
Student welcome presentation   coach catalfino - online hopeStudent welcome presentation   coach catalfino - online hope
Student welcome presentation coach catalfino - online hope
 
Teacher Guide (1).pdf
Teacher Guide (1).pdfTeacher Guide (1).pdf
Teacher Guide (1).pdf
 
Swayam nptel - july 2019
Swayam nptel - july 2019Swayam nptel - july 2019
Swayam nptel - july 2019
 
New Administrator Training Tutorial for CourseSites
New Administrator Training Tutorial for CourseSitesNew Administrator Training Tutorial for CourseSites
New Administrator Training Tutorial for CourseSites
 
Boost Engagement: Include Academic Content in Online Discussions
Boost Engagement: Include Academic Content in Online DiscussionsBoost Engagement: Include Academic Content in Online Discussions
Boost Engagement: Include Academic Content in Online Discussions
 
Elluminate training intermediate
Elluminate training intermediateElluminate training intermediate
Elluminate training intermediate
 
What are Clickers?
What are Clickers?What are Clickers?
What are Clickers?
 
Ali g zoho show time 17-18
Ali g zoho show time 17-18Ali g zoho show time 17-18
Ali g zoho show time 17-18
 
Blackboard Overview V1
Blackboard Overview V1Blackboard Overview V1
Blackboard Overview V1
 
Orientation Session 2014 2015
Orientation Session 2014 2015Orientation Session 2014 2015
Orientation Session 2014 2015
 
COURSEEPLUS Instructor guide
COURSEEPLUS Instructor guideCOURSEEPLUS Instructor guide
COURSEEPLUS Instructor guide
 
StoryPulse- LivePoll guide for Administrator/Presenter
StoryPulse- LivePoll guide for Administrator/PresenterStoryPulse- LivePoll guide for Administrator/Presenter
StoryPulse- LivePoll guide for Administrator/Presenter
 

Clicker software s09

  • 1. Turning Point Student Response Clickers • Click the TurningPoint Software Icon to open the student response clicker software. (This can also be found in the Program menu or from opening PowerPoint itself). • Click the new TurningPoint tab that is now the last tab in your regular PowerPoint view to activate the TurningPoint ribbon. All PowerPoint features all fully functional and will work. Previous PowerPoint knowledge can be applied but you will work mostly from the TurningPoint ribbon to create an interactive presentation. • Design your PowerPoint title slide. PowerPoint themes and design templates can be used. • Click the Insert Slide icon from the TurningPoint ribbon. • Choose the type of slide you would like to insert. The type of slide is determined by the type of chart in which student feedback will be displayed. • Click to enter the question text (This is typically the title text area.)
  • 2. Click to enter answer text. (This is typically the bulleted text area.) • Click drop down boxes for each answer to supply answer values. To supply Correct Answer Indicators • Click Insert Object • Choose Correct Answer Indicator • While there are more advanced features, at this point you can use the presentation with anonymous participants.
  • 3. To Show Presentation • Plug in the USB adapter • Give each student a response clicker (for anonymous participants give any clicker to any student) • Click the Slide Show tab (typical slide show mode in PowerPoint) • Click From Beginning • A toolbar will appear at the top of the slide show presentation view. • Polling Open means students are currently responding to the slide • Responses will display the number of students who have responded by pressing an answer on the clicker. • From this point mouse clicks control the progression of information. 1. Click to close polling 2. Click again to display correct answer indicator 3. Click a third time to display the chart of student responses Reset Session Resetting a session erases the current student response information. All charts are reset to 0% for all answers. Use this feature any time you want to start a presentation over without saving the student response data. • Click Reset
  • 4. Click Session • You will see a box flash in the right hand corner that says “Please wait while session resets.” Advanced Features Use the Countdown feature The Countdown feature inserts a 10 second timer. At the end of 10 seconds polling is closed. • Click Insert Object • Click Countdown • Click the type of Counter you want Using Participant Lists Participant lists allow you to identify student users for grading or other user specific purposes. Participant lists are generated based on an identification number on the back of each card. Assign each student a specific card to track their answers. Participant lists are available to download online.
  • 5. Participant list is set to Auto or Anonymous by default • Download the appropriate participant list for the kit you have reserved from http://www.lmc.edu/web/academics/tlc/Clickers.htm • Click Participants • Click Import a Participant List • Browse to find where you saved the downloaded Participant list for your reserved kit • Select (click on) on the participant list you just imported • Click Use Selected List • To assign student names to specific response cards, click Participants • Click Edit a Participant List
  • 6. Choose the Participant List you just imported • Supply a Student name for each clicker o You can type in each name o You can import a comma delimited file or .CSV file Saving a Session Saving a session will allow you to keep the student response information for the entire presentation for grading purposes or other research. Saving a session is different that saving the presentation. To save your actual presentation save as you would for any other file. • Click Save Session • Choose where to save session • Provide file name for session • Click Save Report Features • Click Tools
  • 7. Click Turning Reports • Select the types of reports you would like to view • Click Generate Report • An Excel document will be generated with statistics based on your student responses and report category choices.