
Empfohlen
Empfohlen
Weitere ähnliche Inhalte
Empfohlen
Empfohlen (20)
Energy Briefing 06.2012 Update
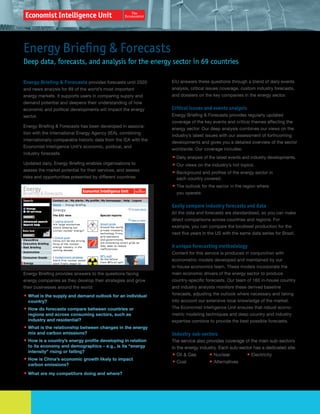
- 1. Energy Briefing & Forecasts Deep data, forecasts, and analysis for the energy sector in 69 countries Energy Briefing & Forecasts provides forecasts until 2020 EIU answers these questions through a blend of daily events and news analysis for 69 of the world’s most important analysis, critical issues coverage, custom industry forecasts, energy markets. It supports users in comparing supply and and dossiers on the key companies in the energy sector. demand potential and deepens their understanding of how economic and political developments will impact the energy Critical issues and events analysis sector. Energy Briefing & Forecasts provides regularly updated coverage of the key events and critical themes affecting the Energy Briefing & Forecasts has been developed in associa- energy sector. Our deep analysis combines our views on the tion with the International Energy Agency (IEA), combining industry’s latest issues with our assessment of forthcoming internationally-comparable historic data from the IEA with the developments and gives you a detailed overview of the sector Economist Intelligence Unit’s economic, political, and worldwide. Our coverage includes: industry forecasts. • Daily analysis of the latest events and industry developments. Updated daily, Energy Briefing enables organisations to • Our views on the industry’s hot topics. assess the market potential for their services, and assess • Background and profiles of the energy sector in risks and opportunities presented by different countries. each country covered. • The outlook for the sector in the region where you operate. Easily compare industry forecasts and data All the data and forecasts are standardised, so you can make direct comparisons across countries and regions. For example, you can compare the biodiesel production for the next five years in the US with the same data series for Brazil. A unique forecasting methodology Content for this service is produced in conjunction with econometric models developed and maintained by our in-house economics team. These models incorporate the Energy Briefing provides answers to the questions facing main economic drivers of the energy sector to produce energy companies as they develop their strategies and grow country-specific forecasts. Our team of 160 in-house country their businesses around the world: and industry analysts monitors these derived baseline • What is the supply and demand outlook for an individual forecasts, adjusting the outlook where necessary and taking country? into account our extensive local knowledge of the market. • How do forecasts compare between countries or The Economist Intelligence Unit ensures that robust econo- regions and across consuming sectors, such as metric modeling techniques and deep country and industry industry and residential? expertise combine to provide the best possible forecasts. • What is the relationship between changes in the energy mix and carbon emissions? Industry sub-sectors • How is a country’s energy profile developing in relation The service also provides coverage of the main sub-sectors to its economy and demographics – e.g., is its “energy in the energy industry. Each sub-sector has a dedicated site. intensity” rising or falling? • Oil & Gas • Nuclear • Electricity • How is China’s economic growth likely to impact • Coal • Alternatives carbon emissions? • What are my competitors doing and where? 86280_Economist_EBF.indd 1 5/30/12 6:53 PM
- 2. Which data series are included? Energy mix Combustible renewables Gasoline: Nominal spot price ($), Nominal Gross domestic energy consumption and waste Price (LCU), Real Price (Constant 2005 LCU), by fuel: Index (2005=100) Demand: Petroleum products (ktoe, % change, % of Combustible renewables and waste Gasoil: Nominal spot price ($), Nominal Price total) consumption (ktoe, % of total, % change) (LCU), Real Price (Constant 2005 LCU), Index Biofuel use in transport sector (ktoe) (2005=100) Natural gas (ktoe, % change, % of total) Electricity (GWh, % change, % of total) Biogasoline, Biodiesel, Other Liquid Biofuels Coal (South African): Nominal spot price ($), Nominal Price (LCU), Real Price Coal (ktoe, % change, % of total) CO2 emissions (Constant 2005 LCU), Index (2005=100) Nuclear (ktoe, % change, % of total) Total CO2 emissions from fuel combustion Hydro (ktoe, % change, % of total) Natural gas (Europe): Nominal spot price (Mt CO2, % of total, % change): Coal, Oil, Geothermal (ktoe, % change, % of total) ($), Nominal Price (LCU), Real Price (Constant Natural gas, Other 2005 LCU), Index (2005=100) Combustible renewables and waste (ktoe, Kyoto indicators: Natural gas (Russia): Nominal spot price % change, % of total) Total CO2 emissions from fuel combustion ($), Nominal Price (LCU), Real Price (Constant Solar/wind/other (ktoe, % change, % (kg per US$ 2005 GDP, tonnes per capita, % 2005 LCU), Index (2005=100) of total) of 1990 level); Gross domestic energy con- UK base electricity: Nominal spot price ($), By sector: sumption (% of 1990 level) Nominal Price (LCU), Real Price (Constant Electricity: (ktoe, % of total) Industry: (ktoe, % of total) Nuclear 2005 LCU), Index (2005=100) Demand: Carbon prices: Transport: (ktoe, % of total) Nuclear: Gross domestic energy consump- EUA emissions: Nominal spot price ($), Residential: (ktoe, % of total) tion (ktoe, % of total, % change) Nominal Price (LCU), Real Price (Constant Commercial and public services: (ktoe, % Supply: 2005 LCU), Index (2005=100) of total) Total number of reactors (units) Other: (ktoe, % of total) Energy indices Energy and carbon prices Energy intensity: Total energy consump- Electricity tion, Petroleum consumption, Natural gas Energy prices: Demand: consumption, Coal consumption, Nuclear Oil (Brent): Nominal spot price (US$), Nomi- Gross domestic electricity consumption (GWh, power consumption: (toe per US$m 2005 nal Price (LCU), Real Price (2005 LCU), Index % change) GDP, consumption per capita) (2005=100) Industry, Transport, Residential, Commercial Oil (WTI): Nominal spot price (US$), Nominal Energy security: and Public Services, Other Price (LCU), Real Price (Constant 2005 LCU), Crude oil: Stocks on national territory (days Capacity: Index (2005=100) of net imports), Stocks on national territory Net maximum electrical capacity (Mwe) Oil (Dubai): Nominal spot price (US$), (days of consumption) Nuclear, Hydro, Other Non-Hydro Renew- Nominal Price (LCU), Real Price (Constant Gasoline: Stocks on national territory (days of ables, Geothermal, Solar, Tide/Wave/Ocean, 2005 LCU), Index (2005=100) consumption) Combustible Fuels Natural gas (Henry Hub): Nominal spot Distillates: Stocks on national territory (days price (US$), Nominal Price (LCU), Real Price Supply: of consumption) (Constant 2005 LCU), Index (2005=100) Gross electricity generation Combustible Crude oil: Net imports (% of total consumption) Coal (Australian): Nominal spot price (US$), Fuels, Coal, Oil, Natural Gas, Nuclear, Hydro, Natural gas: Net imports (% of total Nominal Price (LCU), Real Price (Constant Other Non-Hydro Renewables, Geothermal, consumption) 2005 LCU), Index (2005=100) Solar, Tide/Wave/Ocean, Other Heating oil: Nominal spot price ($), Nominal Coal: Net imports (% of total consumption) Foreign trade: Price (LCU), Real Price (Constant 2005 LCU), Electricity: Net imports (% of total Imports, exports, net imports (GWh) Index (2005=100) consumption) 86280_Economist_EBF.indd 2 5/16/12 6:05 PM
- 3. Global energy indicators: Inventories: Total gross domestic energy consumption Crude oil stocks on national territory (% of world total): Petroleum products, Natu- (thousand bbl) ral gas, Coal, Nuclear, Hydro, Geothermal, Gasoline stocks on national territory Combustible renewables and waste, Solar/ (thousand bbl) wind/other, Total CO2 emissions from fuel Distillates stocks on national territory combustion (thousand bbl) CO2 emissions: Coal, Natural gas, Oil Macroeconomy Coal Economic structure and stability: Energy intensity: GDP (US$, % change) Gross domestic energy consumption (ktoe, % Share of world GDP (%) of total, % change) GDP per head (US$, at PPP) Electricity sector, Industry, Transport, Residential, Commercial and Public Services, Nominal GDP (US$) Other Real GDP (US$ at 2005 prices) Real private consumption (US$ at 2005 Supply: prices) Coal Production (ktoe) Real government consumption (US$ at Foreign trade: 2005 prices) Total imports, Total exports, Net imports (ktoe) Real gross fixed investment (US$ at 2005 prices) Oil and petroleum products Real exports of G&S (US$ at 2005 prices) Demand: Real imports of G&S (US$ at 2005 prices) Gross domestic consumption (ktoe, % of Real domestic demand (US$ at 2005 prices) total, % change) Consumer prices (% change; average) Transport, Electricity, Residential, Industrial, Exchange rate LCU (US$, average) Commercial, Other Gasoline demand (kb/d) Industry: Distillates demand (kb/d) Labour force (units) Average real wages (% change) Supply: Employment (%) Crude oil production (kb/d) Commercial vehicle registrations (units) Gasoline production (kb/d) Unemployment (%) Distillates production (kb/d) Overall productivity of labour (US$ GDP, Transformation: at PPP, per worker) Observed crude oil refinery intake (kb/d) Productivity of capital (ICOR) Number of refineries (kb/d) Transport: Crude refinery capacity (kb/d) Passenger car registrations (units) Foreign trade: Passenger cars (stock per 1,000 pop) Crude oil: Imports, Exports, Net imports Commercial vehicle registrations (units) (kb/d) Total length of roads (km) Petroleum products: Imports, Exports, Net Air transport: freight and passengers, imports (kb/d) (tonnes/km, units) 86280_Economist_EBF.indd 3 5/16/12 6:05 PM
- 4. In-depth coverage of key energy themes • Forecasts until 2020. The service includes coverage of important themes (for example, • Semi-annual energy industry profiles for each country. the saga of competing European-Russian pipelines); major industry events (for example, our analysis of major trends or Access choices: mergers); as well as perennial issues (for example, our ongoing • Enterprise access via IP control or username: analysis and background information on emerging markets). - Full Energy Briefing data and analysis at viewswire.com/energy Risk ratings weighted to the energy sector - EIU Data Tool for series selection at data.eiu.com Risk ratings are available for energy sub-sectors at a global and • Energy Indicators (data only) are also available separately country level. These ratings allow you to rank and benchmark on our partners’ platforms: the operational risk in the countries or regions where you - Bureau van Dijk at eiu.bvdep.com operate. Derived from the Economist Intelligence Unit’s own - Alacra at eiu.alacra.com standard operational risk model, Risk Briefing, ratings are • Online Store—semi-annual reports available at weighted according to their impact on the energy industry. For store.eiu.com example, the risk of disruption in the local infrastructure is weighted more heavily in the Oil sub-sector of Energy Briefing & Interface features: Forecasts than in our standard model. • Archives to 2002. Understand global and local issues with extensive • One click reports. country coverage • Downloadable Excel® tables. Energy Briefing & Forecasts provides 69 industry-specific • Series codes (Data Tool only). country pages. Every country page incorporates sub-sections on • Series definitions. (Data Tool only). the energy industry in that country: • Analyst name and forecast date. • Latest analysis—up-to-date analysis on key developments. • Colour coding (Data Tool only). • Data—access to a data tool that provides key industry • Automatic graphing (Data Tool only). indicators and forecasts. • Preset searches and saved searches (Data Tool only). • Reports—the latest overview for the industry in each country. • Forecasts—our latest industry forecast. Which countries are covered? • Country sub-sectors—our analysis of industry sub-sectors • Algeria • Angola • Argentina • Australia • Austria • Azerbaijan in each country. • Brazil • Belgium • Bulgaria • Canada • Chad • Chile • China • Colombia • Czech Republic • Denmark • Ecuador • Egypt Energy Briefing & Forecasts delivers • Equatorial Guinea • Finland • France • Germany • Greece • Daily updates for 69 countries. • Hong Kong • Hungary • India • Indonesia • Iran • Iraq • Ireland • Regional and global outlook reports, updated • Israel • Italy • Japan • Kazakhstan • Kuwait • Libya • Malaysia semi-annually, highlighting up-coming trends. • Mexico • Netherlands • New Zealand • Nigeria • Norway • Oman • Industry analysis by sector. • Pakistan • Philippines • Peru • Poland • Portugal • Qatar • Romania • Russia • Saudi Arabia • Singapore • Slovakia • South Africa • Special industry reports. • South Korea • Spain • Sweden • Switzerland • Taiwan • Thailand • 41 company profiles updated regularly. • Trinidad & Tobago • Turkey • Venezuela • Vietnam • Ukraine • 252 series for 69 countries from 1990-present. • United Arab Emirates • United Kingdom • United States of America Americas Europe, Middle East, & Africa Asia & Australasia Economist Intelligence Unit The Economist Intelligence Unit Limited Economist Intelligence Unit 750 Third Ave, 5th Floor 26 Red Lion Square 6001 Central Plaza New York, NY 10017 USA London WC1R 4HQ 18 Harbour Road, Wanchai Tel: +1 212 698 9717 United Kingdom Hong Kong Fax: +1 212 586 0248 Tel: +44 (0)20 7576 8181 Tel: + 852 2585 3888 e-mail: americas@eiu.com Fax: +44(0)20 7576 8476 Fax: +852 2802 7638 e-mail: emea@eiu.com e-mail: asia@eiu.com © 2012 The Economist Group. 86280_Economist_EBF.indd 4 5/30/12 6:52 PM