Market Expert Handout - North Shore Real Estate Market - May 2011
•
1 gefällt mir•3,368 views

This handout is provided to members of the @properties Market Expert program in conjunction with Keeping Current Matters. The enclosed information discusses factual information about the Chicago North Shore real estate market specifically - as well as local North Shore neighborhoods.

Empfohlen
Weitere ähnliche Inhalte
Andere mochten auch
Andere mochten auch (13)
Mehr von Matt Dollinger
Mehr von Matt Dollinger (6)
Kürzlich hochgeladen
Kürzlich hochgeladen (20)
Market Expert Handout - North Shore Real Estate Market - May 2011
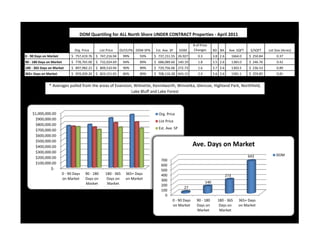
- 1. DOM Quartiling for ALL North Shore UNDER CONTRACT Properties - April 2011 # of Price Org. Price List Price OLP/LP% DOM SP% Est. Ave. SP DOM Changes BD BA Ave. SQFT $/SQFT Lot Size (Acres) 0 - 90 Days on Market $ 757,419.76 $ 747,216.94 99% 93% $ 737,151.55 26.927 0.3 3.8 2.6 1664.0 $ 250.84 0.37 90 - 180 Days on Market $ 778,765.00 $ 732,024.69 94% 89% $ 688,089.66 140.19 1.8 3.5 2.6 1383.0 $ 246.76 0.42 180 - 365 Days on Market $ 897,982.21 $ 809,510.94 90% 89% $ 729,756.06 272.73 1.6 3.7 2.6 1303.5 $ 236.53 0.89 365+ Days on Market $ 959,209.26 $ 824,151.65 86% 89% $ 708,110.28 643.15 2.4 3.6 2.6 1581.1 $ 259.85 0.81 * Averages pulled from the areas of Evanston, Wilmette, Kennilworth, Winnetka, Glencoe, Highland Park, Northfield, Lake Bluff and Lake Forest $1,000,000.00 Org. Price $900,000.00 List Price $800,000.00 $700,000.00 Est. Ave. SP $600,000.00 $500,000.00 $400,000.00 Ave. Days on Market $300,000.00 643 DOM $200,000.00 700 $100,000.00 600 $- 500 0 - 90 Days 90 - 180 180 - 365 365+ Days 400 273 on Market Days on Days on on Market 300 Market Market 140 200 27 100 0 0 - 90 Days 90 - 180 180 - 365 365+ Days on Market Days on Days on on Market Market Market