1. GLOBAL AD MARKETS
KEY METRICS
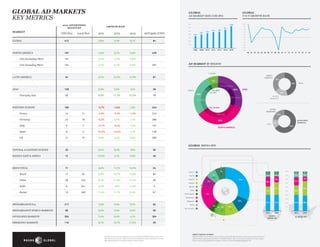
GLOBAL
AD MARKET SIZE (USD BN)
2012 ADVERTISING
REVENUES
MARKET
USD (bn)
Local (bn)
700
GROWTH RATE
2012
2013
GLOBAL
Y-O-Y GROWTH RATE
600
2014
Ad/Capita (USD)
500
400
10%
649
404
354
472
434
486
8%
541
6%
4%
2%
0%
300
GLOBAL
472
3,9%
3,0%
6,1%
84
-2%
200
-4%
100
0
NORTH AMERICA
167
4,8%
0,7%
5,6%
USA (Excluding P&O)
151
2,7%
2,3%
USA (Including P&O)
154
4,7%
0,4%
5,9%
-8%
2000
2005
2010
2012
2013
2015
2018
-10%
3,8%
-6%
478
491
00 01 02 03 04 05 06 07 08 09 10 11 12 13 14 15 16 17 18
AD MARKET BY REGION
LATAM
LATIN AMERICA
34
9,7%
12,5%
12,9%
NORTH
AMERICA
67
35%
7%
G-14
46%
12% emerging
APAC
138
Emerging Asia
5,6%
5,9%
8,9%
59
11,3%
7,4%
12,0%
38
EMEA
28%
18
19%
100
14
23
France
Germany
-2,7%
-1,6%
1,5%
243
11
-2,9%
-3,3%
-1,2%
214
18
-0,5%
0,6%
1,7%
286
Italy
9
7
-13,1%
-9,4%
1,0%
6
5
-16,3%
-10,4%
1,1%
21
13
3,6%
2,2%
2,5%
OTHER
EMERGING
22%
33% USA
35%
BRIC
DEVELOPED
MARKETS
13%
129
UK
3% Canada
151
Spain
WORLD
MARKETS
17% mature
21% WE
WESTERN EUROPE
APAC
30%
2% MEA
4% CEE
335
65%
NORTH AMERICA
GLOBAL MEDIA MIX
CENTRAL & EASTERN EUROPE
20
6,5%
8,0%
7,9%
50
MIDDLE EAST & AFRICA
12
12,8%
4,1%
9,9%
48
BRICS TOTAL
71
8,6%
11,1%
12,0%
24
Brazil
17
32
6,8%
10,7%
13,6%
84
China
38
242
9,3%
11,6%
12,1%
28
Search
Russia
6
10
341
295
4,9%
7,8%
11,4%
11,7%
11,9%
8,9%
5
67
7%
7%
7%
Pay TV
Display
India
7%
Free TV
31%
7%
24%
Mobile
Video
Other Digital
21%
7%
6%
15%
31%
2,5%
3,6%
5,7%
62
MEDIABRAND‘S WORLD MARKETS
88
6,0%
5,9%
8,0%
50
DEVELOPED MARKETS
354
2,4%
0,4%
4,1%
118
8,7%
10,7%
11,5%
Out-of-home
10%
3%
2% 6%
1%
21%
5%
9%
15%
60%
24%
37%
30%
41%
41%
9%
26
41%
39%
2012
2018
0
2018
GLOBAL
MEDIA MIX
MAGNA GLOBAL is the investment and research entity of IPG Mediabrands. Global Advertising Forecasts are
updated twice a year (June, December). All MAGNA GLOBAL reports and data are available on http://magna.
mbww.com for any Mediabrands employee. Contact: vincent.letang@magnaglobal.com.
20%
10%
2012
ABOUT MAGNA GLOBAL
Net Media Owners Advertising Revenues, as estimated by MAGNA GLOBAL in June 2013.
P&O: Political and Olympic Spending. Only the US estimates are provided with or without
P&O; P&O spending is included by default in other markets
4%
10%
40%
304
EMERGING MARKETS
Radio
80%
50%
17%
Magazine
217
90%
70%
Newspaper
MEDIABRAND‘S G14
100%
US MEDIA MIX