What's your State of Place™ ? A decision-making tool for walkability interventions, investments, and policy that maximize the triple bottom line
•
3 likes•995 views

A step by step approach for quantifying walkability, diagnosing communities' walkability strengths and weakness, and prioritizing walkability interventions, investments and policies that will maximize the triple bottom line in the face of fiscal constraints. State of Place™ is a streamlined decision-making tool that offers a cost-efficient, effective, transparent, and accountable approach to boost walkability, sustainability, and profitability.

Recommended
More Related Content
Similar to What's your State of Place™ ? A decision-making tool for walkability interventions, investments, and policy that maximize the triple bottom line
Similar to What's your State of Place™ ? A decision-making tool for walkability interventions, investments, and policy that maximize the triple bottom line (20)
More from State of Place
More from State of Place (11)
Recently uploaded
Recently uploaded (20)
What's your State of Place™ ? A decision-making tool for walkability interventions, investments, and policy that maximize the triple bottom line
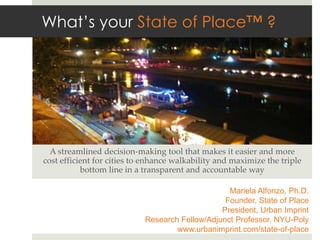
- 1. What’s your State of Place™ ? A streamlined decision-‐‑making tool that makes it easier and more cost efficient for cities to enhance walkability and maximize the triple bo;om line in a transparent and accountable way Mariela Alfonzo, Ph.D. Founder, State of Place President, Urban Imprint Research Fellow/Adjunct Professor, NYU-Poly www.urbanimprint.com/state-of-place
- 2. In the stiff competitive “place market” walkability is no longer an “intangible luxury”
- 3. But…there is a shortage of walkability Public policy hurdles + Legal issues + NIMBYism + Lack of benchmarks and metrics = More difficult to finance/underwrite/create/deliver Lack effective, cost efficient methods that demystify the process of identifying, differentiating, and creating the quality places people want
- 4. Enter, State of Place™ ? ¤ Art à Science: Quantifying walkability ¤ Comprehensive, Objective, Reliable ¤ Captures “Micro-‐‑scale” & “Sensory” features ¤ Diagnostic, Empirically-‐‑Based ¤ Ties Place Quality, Economic Impact ¤ Facilitates Evidence-‐‑based decision making, Accountability ¤ Provides empirically-‐‑based ROI predictions, Customizable
- 5. First step: Quantifying Walkability Collect street-level built environment data on 250+ micro-scale features • Sidewalk presence, street trees, street benches, parks, street facades, land uses, etc. Using Irvine Minnesota Inventory • Reliable, used widely in research
- 6. Raters receive walkability training Raters receive full day training; tested for accuracy/reliability Data can be collected for sample of blocks in a neighborhood or on a select number of blocks • 10-12 min/block Neighborhood defined based on existing boundaries
- 7. Next step: Calculate State of Place™ Index
- 8. Next Step: Create State of Place™ Diagnosis 0% 10% 20% 30% 40% 50% 60% 70% 80% 90% 100% Density Form Proximity Connectivity Parks & Public Space Pedestrian Amenities Safety from Crime Traffic Safety Aesthetics Physical Activity Facilities
- 9. Index & Diagnosis based on State of Place™ Algorithm Dimensions Description/Example Items Density Measure of enclosure based on building concentrations and height Proximity Presence of non-residential land uses Connectivity Measure of disconnectivty; Potential Barriers (e.g., six-lane roads) Form Measure of streetscape discontinuity (e.g. drive- thrus) Parks and Public Space Parks, Playgrounds, Plazas, Playing Fields Pedestrian Infrastructure/ Curbcuts, Sidewalks, Street Furniture, Bike Racks Amenities Personal Safety Graffiti, Litter, Windows with Bars Traffic Measures Traffic Signals, Speed Limit, Traffic Calming Aesthetics (Pleasurability & Attractiveness, Open Views, Outdoor Dining, Maintenance) Maintenance Physical Activity Facilities Gym/Fitness Facilities, Other Recreational Uses
- 10. Uniquely, the State of Place™ diagnosis allows users to identify neighborhood assets & areas in need of improvement 0% 10% 20% 30% 40% 50% 60% 70% 80% 90% 100% Density Form Proximity Connectivity Parks & Public Space Pedestrian Amenities Safety from Crime Traffic Safety Aesthetics Physical Activity Facilities
- 11. Density Dimensions - Assets State of Place™ Pedestrian Amenities Form Traffic Safety
- 12. State of Place™ Dimensions – Need improvement Connectivity Aesthetics Safety
- 13. But another key value proposition = State of Place™ is tied to economic performance Correlated Economic Performance + $9 sf office rents + $7 sf retail rents +80% retail revenues + $300/unit res. rent +81 sf for-sale res. value From Brookings Institution report, “Walk this Way”
- 14. State of Place™ is a powerful decision-making tool
- 15. Evaluate neighborhoods based on State of Place™ Index Like a credit or bond rating for neighborhoods; Helps guide investment & underwriting; Aids branding; Siting *Risk averse investors; Steady ROI *Regional retailer siting *Risk tolerant investors; Higher ROI *Aggressive developer enters market *Target for social equity advocates
- 16. State of Place™ = Economic Indicator Can quantify the value of place…. The State of Place™ index is linked to premiums of up to: +74% residential rents/unit +$1200/unit residential rent +108% office rents +84% retail rents +23% premium valuation before recession; +44% premium post For DC, this translates into up to: +$744 mill in residential property taxes/ neighborhood +$96 mill in retail taxes generated/ neighborhood
- 17. And because State of Place™ dimensions are each tied to distinct ROI !"#"$%&'(%)*' !"# $!"# %!"# &!"# '!"# (!"# )!"# *!"# +!"# ,!"# $!!"# -./0# 1234# Very Good ROI 5246# 7214# 6/5-# Good ROI 7/.8# 75/94# :.33# 45-2# Fair ROI 75-#
- 18. !"#"$%&'(%)*' !"# $!"# %!"# &!"# '!"# (!"# )!"# *!"# +!"# ,!"# $!!"# -./0# Very Good 1234# ROI 5246# 7214# 6/5-# Good 7/.8# ROI 75/94# :.33# Fair 45-2# ROI 75-# Next Step: Assess current performance against estimated ROI Assess current performance Predict ROI Balance Costs, Benefits
- 19. Intervention Sidewalk Façade Scenario Analysis - EXAMPLE Options improvement improvement Project Costs $500,000.00 $250,000.00 SoP Dimension Ped. Amenities Aesthetics Current 50% 25% Performance State of Place™ ROI Impact Factor 6 7 Predicted SoP Performance 10% 15% Increase Walkability Impact 7 4 Baseline Indicator Office Rents $25 Predicted $3.13/sf $1.89/sf Economic Upside
- 20. Next Step: Prioritize Planned Interventions based on State of Place™ Diagnosis ¤ FIRST PHASE: !"#"$%&'(%)*' ¤ Add grid of streets !"# $!"# %!"# &!"# '!"# (!"# )!"# *!"# +!"# ,!"# $!!"# FORM -./0# ¤ Add Commercial 1234# office, retail, DENS 5246# 7214# housing (as market 6/5-# bears) 7/.8# 75/94# ¤ Add infill Metrorail PROX :.33# station 45-2# CONN 75-# ¤ Add BRT Transit Line
- 21. Prioritize Planned Interventions ¤ SECOND PHASE: !"#"$%&'(%)*' ¤ Add sidewalks, buffers -./0# !"# $!"# %!"# &!"# '!"# (!"# )!"# *!"# +!"# ,!"# $!!"# ¤ Add street furniture PEDS 1234# 5246# ¤ Add plaza, public 7214# space TRAF 6/5-# 7/.8# ¤ Streetscape AEST 75/94# improvements :.33# 45-2# ¤ Traffic calming 75-#
- 22. Metropolitan Washington Council of Governments, DC Metro Region !"#$%$#& '()#(* +#*,#(-$" .)%(/#0()# 12,) !"# $#%&'( )'*+,*- ./01#/#(2,2&'( !''1 !"#$%&' !("')%"* ¤ Diagnosing 95 neighborhoods in the +'%%",)- .#//,''%% !"#$%&' ()&*#++ ,%%')-. !"#$%&' 0%(/ region /%5'%60%"7 / ' 0 12 3412 ¤ Creating place profiles – based on assets and areas in need of improvement ¤ Informing Strategic Investment Plan for region
- 23. Conservation Law Foundation Ventures, Boston, MA ¤ CLFV à Creating Healthy Neighborhood Equity Fund ¤ Piloting State of Place™ as project & neighborhood screening tool ¤ Creating estimated State of Place™ scores based on proposed projects ¤ Calculating potential upside
- 24. State of Place™ current & future “imprint”… ¤ Applicable across urban, suburban, & rural communities ¤ IMI data has been collected in California, Minneapolis, Houston, Iowa, North Carolina RT, Denver, Salt Lake City, Kansas, Arkansas, Michigan, Illinois… ¤ Rolling out State of Place in other metros ¤ San Francisco/Bay area – Spring 2013 ¤ Houston, Phoenix, Seattle, Los Angeles ¤ Incorporating a broader set of economic indicators ¤ Job creation, retention, firm recruitment ¤ Health Metrics ¤ App – available soon! ¤ Partnering with universities ¤ Working with underprivileged community ¤ Brownsville + NYU-Poly ¤ China – in progress!
- 25. Let’s boost your State of Place™ !
- 26. What’s your State of Place™ ? www.urbanimprint.com/state-of-place
Editor's Notes
- Introduction
- In light of the competitive “place” marketplace, “walkability” is no longer an “intangible luxury.” Walkability contributes to quality of place – and it is increasingly in demand. Many Americans are choosing which place to “consume” based on the physical features of the neighborhood that allow them to walk and not have to rely on an automobile. Many planners, developers, investors, and city officials have begun to realize that addressing the demand for walkability is a critical factor in ensuring the economic growth and prosperity of places.
- Cities want for a tool that facilitates cost-efficient, transparent, and accountable decision-making regarding how best to deliver sustainable, walkable places.
- In the past, designing the built environment was generally considered to be more of an “art” than a “science.” But State of Place™™ has now not only quantified walkability – a critical component of what customers are increasingly demanding of places — but also its economic impact. Providing both a rating and a diagnosis, State of Place™™ is an empirically-based tool that makes it easier and more cost effective to identify quality places and make them better – from a triple bottom line (people, planet, and profit) perspective.
- So state of place puts these researchprinciples into practiceAs a rating system:Guide investment decisionsUnderwrite debt/equityBusinesses/Developers choose locationsAdvocates/social equity agencies (like HUD) identify places that need investment/helpFor example, a lender may choose to fund a new development in a AAA neighborhood over an A because it’s less risky; OR on the flip side, an investor may choose to develop in a level A over a level AAA because he or she sees more potential for up-side.
- Found 5 levels of walkability – attached to econ perf
- So state of place puts these researchprinciples into practiceAs a rating system:Guide investment decisionsUnderwrite debt/equityBusinesses/Developers choose locationsAdvocates/social equity agencies (like HUD) identify places that need investment/helpFor example, a lender may choose to fund a new development in a AAA neighborhood over an A because it’s less risky; OR on the flip side, an investor may choose to develop in a level A over a level AAA because he or she sees more potential for up-side.
- Translates into econ dev $$
- Will update this to reflect our conversation yesterday
- Will update this to reflect our conversation yesterday
- Will update this to reflect our conversation yesterday
- Aim = improve places like this!