
Empfohlen
Weitere ähnliche Inhalte
Ähnlich wie Aluminum beverage can facts
Ähnlich wie Aluminum beverage can facts (20)
Kürzlich hochgeladen
Kürzlich hochgeladen (20)
Aluminum beverage can facts
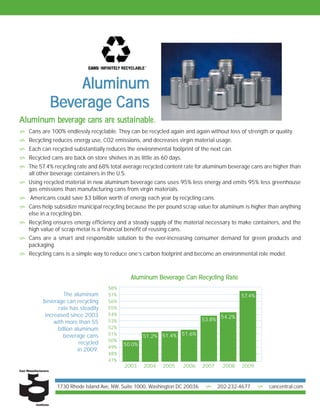
- 1. Aluminum Bev Beverage Cans are Aluminum beverage cans are sustainable. Cans are 100% endlessly recyclable. They can be recycled again and again without loss of strength or quality. Recycling reduces energy use, CO2 emissions, and decreases virgin material usage. Each can recycled substantially reduces the environmental footprint of the next can. Recycled cans are back on store shelves in as little as 60 days. The 57.4% recycling rate and 68% total average recycled content rate for aluminum beverage cans are higher than all other beverage containers in the U.S. Using recycled material in new aluminum beverage cans uses 95% less energy and emits 95% less greenhouse gas emissions than manufacturing cans from virgin materials. Americans could save $3 billion worth of energy each year by recycling cans. Cans help subsidize municipal recycling because the per pound scrap value for aluminum is higher than anything else in a recycling bin. Recycling ensures energy efficiency and a steady supply of the material necessary to make containers, and the high value of scrap metal is a financial benefit of reusing cans. Cans are a smart and responsible solution to the ever-increasing consumer demand for green products and packaging. Recycling cans is a simple way to reduce one’s carbon footprint and become an environmental role model. Bev Recy ecycling Rate Aluminum Beverage Can Recycling Rate 58% The aluminum 57% 57.4% beverage can recycling 56% rate has steadily 55% increased since 2003 54% with more than 55 53% 53.8% 54.2% billion aluminum 52% beverage cans 51% 51.2% 51.4% 51.6% 50% recycled 50.0% 49% in 2009. 48% 47% 2003 2004 2005 2006 2007 2008 2009 1730 Rhode Island Ave, NW, Suite 1000, Washington DC 20036 202-232-4677 cancentral.com
- 2. Aluminum Bev Beverage Cans Aluminum beverage cans provide environmental provide many environmental benefits. Findings based on the recent Aluminum Beverage Can Life Cycle Analysis show that: The carbon footprint for aluminum cans has been reduced 44% over a 17 year period. Energy used to make aluminum cans has been reduced 30% over a 17 year period. The aluminum can has a 68 % total recycled content, the highest of any beverage package material. GHG emissions associated with producing 1,000 12 ounce beverage cans are approximately 129.1 kilograms, which is equal to the emissions of .025 cars per year. Of the total carbon footprint for beverage cans, about 19% is associated with the can manufacturing process (versus aluminum production and recycling UBCs). Can manufacturing (including the impacts of direct and indirect emissions) accounts for approximately 24.6 kilograms of GHG per 1,000 12 ounce cans, which is equal to the emissions from 2.8 gallons of gasoline. Beverage Can Source Reduction (ounces per can) Bev Source Reduction 0.80 Since the 0.70 early 1970s, 0.719 0.676 can manufacturers 0.60 have reduced the 0.50 0.623 0.566 0.543 weight of aluminum 0.484 0.474 0.40 0.468 0.468 0.465 beverage cans by 0.30 approximately thirty-five 0.20 percent. 0.10 0.00 1973 1978 1983 1988 1993 1998 2003 2007 2008 2009 Source: Aluminum Association, Can Manufacturers Institute 1730 Rhode Island Ave, NW, Suite 1000, Washington DC 20036 202-232-4677 cancentral.com
- 3. Aluminum Beverage Cans Bev Emerging beverage Emerging Unit Volume Energy Drink Unit Volume can categories are growing. are growing. 5,000 Energy Drinks Drinks.The energy drink category has grown at an amazing rate for the past decade, and in 2008, unit 4,000 4,024 4,044 Unit Volume volume exceeded 4 billion. Most energy drinks are sold 3,762 in aluminum cans, and use mostly custom sizes. In the 3,000 early part of the decade, 8.4oz cans dominated the 2,805 2,000 market, but in recent years there has been a shift to larger 1,953 cans such as 16oz, 24oz and even some 32oz. Cans have 1,000 come to define the energy drink market, with very few brands introducing products in glass or plastic bottles. The 0 durability and portability of the can combined with its sleek 2005 2006 2007 2008 2009 and masculine image, has helped solidify cans as the Source: Beverage Marketing Corporation, package of choice for energy drinks. “Beverage Packaging in the U.S.” Beer. Since 2007, cans have increased their market share in the beer market, reaching a 51.4% share in 2009. One Beer. reason for the increase is the availability of craft brews, once the exclusive domain of glass and draft, now available in cans. Craft brewers choose aluminum cans because they are portable and unbreakable, allowing consumers to take their beer to places glass is not allowed or where lightweight containers are more preferable such as boating, camping, sporting events or concerts. Beer is one of the most flavor-sensitive beverages around, so good packaging is key to maintaining flavor integrity. Cans protect beer flavor very well because they are a complete barrier to air and light. Also, cans offer the best shipping efficiencies of any beverage package. This is due to the cans’ superior cube efficiency and the fact that they require less secondary packaging. The availability of higher quality, eye-catching graphics and creative designs of the craft brew cans make them stand out on store shelves. The future is bright for craft beer in aluminum cans. 60% 2005 2006 40% 2007 2008 2009 20% 0% Cans Bottles Draft Source: Beer Institute 1730 Rhode Island Ave, NW, Suite 1000, Washington DC 20036 202-232-4677 cancentral.com
- 4. Aluminum Beverage Bev Cans can’s make The aluminum beverage can’s many new innovations make it the best choice. Re-sealable Cans Both beer and soft drinks cans have a big billboard for product branding and screw top cans offer consumers convenience and on-shelf differentiation. For beer, resalable bottle cans allow consumers to have their favorite beers in venues such as golf courses and sporting events. Soft drink cans with screw on tops allow for on-the-go consumption, providing more convenience and portability for consumers Portion Control Soft drink companies and others are leveraging the 8-ounce and 7.5 ounce cans to ride the portion-control wave as Americans are becoming increasingly concerned about intake and nutrition. To many consumers these smaller can sizes make the contents seem innately appealing as they aesthetically indicate less consumption. Big Cans for Big Thirst Larger 16-ounce, 24-ounce and 32-ounce cans make an impression among consumers looking to quench a big thirst. These larger cans not only provide more product for consumers, but also allow the product to stand out on shelves with a much larger surface for brand recognition. Sleek Cans These elongated cans give a sleek look to prestige brands, providing category definition and enhanced shelf appeal. Red Bull defined the market but the boom continues with others brands for both beer and soft drinks as well as a new re-sealable 12 ounce slim can. Canny Brand Differentiation Can makers have introduced a wide range of finishes and printing techniques such as fluorescent inks that glow under ultraviolet light and tactile inks that give cans texture and “touchability.” 1730 Rhode Island Ave, NW, Suite 1000, Washington DC 20036 202-232-4677 cancentral.com
- 5. Bev Aluminum Beverage Cans People prefer aluminum beverage cans. prefer Packaging Net Material Favorable Unfavorable Favorability In a recently commissioned national survey by the Aluminum can 74% 22% +52 Aluminum Association, the aluminum can is by far the most favorably viewed of the three beverage packages, Glass bottle 58% 39% +19 significantly outdistancing either glass or plastic bottles. Plastic bottle 54% 43% +11 The following table shows the net favorability of each type of packaging: Seven in ten adults say they would purchase a product because its packaging is better for the environment. Americans perceive that aluminum cans have the highest percentage of recycled material in them. When asked, adults estimate that about 58 percent of the aluminum in a can comes from recycled materials, compared to the actual rate of 68 percent. economy. Can manufacturing has a significant impact on the U.S. economy. U.S. companies that manufacture metal cans are an important part of the national economy. Manufacturers of cans along with the companies that provide supplies and materials for the cans provide well paying jobs throughout the U.S. and pay significant amounts in tax to the Federal Government. Direct Supplier Induced Total Jobs (FTE) 32,900 93,400 99,300 225,600 Wages $2,001,514,000 $5,210,100,200 $3,865,360,800 $11,076,975,000 Economic Impact $14,940,656,600 $21,806,270,200 $12,510,655,800 $ 49,257,582,600 Additionally, the United States benefits from the taxes Taxes Generated in the U.S. by the Metal Can Industry paid by the industry. Not only does the metal can industry create jobs, it also generates sizable tax Tax Impact Business Taxes revenues. Nationally, the industry and its employees Federal Taxes $2,646,839,788 pay over $2.65 billion in federal taxes and an additional $1.84 billion in state taxes. State Taxes $1,839,948,852 Total Taxes $ 4,486,788,640 Source: Can Manufacturers Institute 1730 Rhode Island Ave, NW, Suite 1000, Washington DC 20036 202-232-4677 cancentral.com