

Empfohlen
Weitere ähnliche Inhalte
Mehr von Eduard Costa
Mehr von Eduard Costa (20)
Kürzlich hochgeladen
Kürzlich hochgeladen (20)
Ind Cohesio Cat
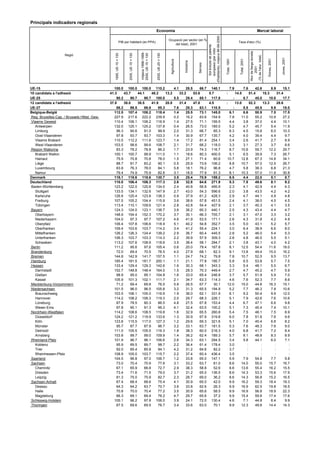
- 1. Principals indicadors regionals Economia Mercat laboral d'habitants), mitjana 98-99-2000 Ocupació per sector (en % PIB per habitant (en PPA) Taxa d'atur (%) del total), 2001 Sol·licituds de patents europees (per milió Atur de llarga durada mitjana 1998-1999- 1995, UE-15 = 100 2000, UE-15 = 100 2000, UE-15 = 100 2000, UE-25 = 100 Regió (% de l'atur total) Joves, 2001 Dones, 2001 Total, 1991 Total, 2001 Agricultura Indústria Serveis 2001 UE-15 100.0 100.0 100.0 110.2 4.1 28.5 66.7 140.1 7.9 42.6 7.6 8.9 15.1 10 candidats a l'adhesió 41.3 43.7 44.1 48.2 13.2 33.2 53.6 5.7 : 14.5 51.4 15.3 31.4 UE-25 90.2 90.7 90.7 100.0 5.5 29.4 65.1 117.8 : 8.7 45.0 10.0 17.7 12 candidats a l'adhesió 37.8 38.0 38.5 41.9 20.8 31.4 47.8 4.5 : 13.0 52.3 13.3 28.6 UE-27 86.2 86.5 86.6 95.3 7.6 29.3 63.1 110.5 : 8.8 45.8 9.9 18.0 Belgique-België 112.5 107.4 108.2 118.4 1.4 25.5 73.1 145.0 6.1 6.6 50.9 7.5 17.5 Reg. Bruxelles-Cap. / Brussels Hfdst. Gew. 227.9 217.6 222.2 239.9 0.2 16.2 83.6 154.9 7.8 11.0 55.2 10.9 27.2 Vlaams Gewest 110.4 106.1 106.2 116.9 1.4 27.5 71.1 159.5 4.4 3.8 37.0 4.4 10.1 Antwerpen 132.0 125.1 125.2 137.8 0.4 26.5 73.0 185.0 5.2 4.7 45.7 5.4 11.9 Limburg 96.3 90.6 91.0 99.9 2.0 31.3 66.7 85.3 6.3 4.5 15.8 6.0 10.3 Oost-Vlaanderen 97.8 93.7 93.7 103.3 1.4 30.9 67.7 135.7 4.2 4.0 39.4 4.4 9.7 Vlaams Brabant 110.5 112.2 111.6 123.7 1.4 17.2 81.4 254.1 3.4 2.6 41.7 2.7 8.9 West-Vlaanderen 103.5 98.6 99.6 108.7 2.1 31.7 66.2 118.0 3.3 3.1 27.3 3.7 8.6 Région Wallonne 83.3 78.2 78.8 86.2 1.7 23.9 74.3 116.7 8.7 10.6 59.7 12.2 29.7 Brabant Wallon 100.1 100.7 99.9 111.0 1.1 18.6 80.3 400.5 5.1 6.5 39.9 7.3 26.7 Hainaut 75.9 70.8 70.8 78.0 1.5 27.1 71.4 60.6 10.7 12.8 67.3 14.8 34.1 Liège 88.7 81.7 83.2 90.1 0.5 25.9 73.6 106.2 8.8 10.7 57.0 12.5 26.7 Luxembourg 83.8 76.3 78.0 84.1 5.8 18.1 76.2 96.8 4.7 5.8 38.3 6.8 21.3 Namur 79.4 74.9 75.9 82.6 3.1 18.9 77.9 91.3 8.1 10.3 57.0 11.9 30.8 Danmark 118.1 118.6 118.6 130.7 3.5 25.4 70.9 159.2 8.5 4.4 22.0 5.1 8.7 Deutschland 110.0 106.4 106.3 117.3 2.6 32.8 64.6 271.9 5.3 7.8 49.6 8.1 9.2 Baden-Württemberg 123.2 122.0 120.8 134.5 2.4 40.8 56.8 495.9 2.3 4.1 42.9 4.4 4.3 Stuttgart 133.5 134.1 132.6 147.9 2.7 43.0 54.3 596.6 2.0 3.8 43.5 4.2 4.2 Karlsruhe 126.8 125.4 123.8 138.3 0.9 37.9 61.2 428.3 2.9 4.7 44.1 4.9 4.8 Freiburg 107.5 105.2 104.4 115.9 3.6 38.6 57.8 451.5 2.4 4.1 38.0 4.5 4.5 Tübingen 113.4 110.1 109.6 121.4 2.8 42.8 54.4 427.9 2.1 3.7 45.3 4.1 3.5 Bayern 124.3 124.0 123.1 136.7 3.6 36.2 60.3 440.1 2.5 4.3 43.4 4.4 4.7 Oberbayern 148.9 154.4 152.3 170.2 3.7 30.1 66.3 705.7 2.1 3.1 47.0 3.3 3.2 Niederbayern 104.0 97.3 97.7 107.2 4.6 41.9 53.5 171.1 2.6 4.3 31.8 4.2 4.9 Oberpfalz 106.4 107.8 106.6 118.9 5.1 40.2 54.8 352.7 3.5 5.0 43.1 5.2 5.7 Oberfranken 109.4 103.6 103.7 114.2 3.4 41.2 55.4 224.1 3.0 6.4 38.9 6.6 8.0 Mittelfranken 126.2 126.3 124.4 139.2 2.9 36.7 60.4 445.5 2.8 5.2 46.0 5.4 5.3 Unterfranken 106.3 103.7 103.3 114.3 2.2 39.9 57.9 309.3 2.8 4.8 46.5 5.5 5.1 Schwaben 113.2 107.6 108.9 118.6 3.5 38.4 58.1 294.7 2.1 3.8 43.1 4.0 4.2 Berlin 111.2 95.6 97.6 105.4 0.6 20.0 79.4 167.8 8.1 12.5 54.4 11.6 18.0 Brandenburg 72.0 69.4 70.5 76.5 4.0 27.9 68.1 62.3 9.1 13.8 49.4 15.0 16.2 Bremen 144.8 142.9 141.7 157.5 1.1 24.7 74.2 79.8 7.8 10.7 52.5 9.5 13.7 Hamburg 185.4 181.5 181.7 200.1 1.1 21.1 77.8 195.7 5.8 6.5 53.8 5.7 7.5 Hessen 133.4 129.4 129.3 142.6 1.6 30.3 68.1 343.3 3.3 5.4 48.1 5.5 6.7 Darmstadt 152.7 148.8 148.4 164.0 1.5 28.3 70.3 449.4 2.7 4.7 45.2 4.7 5.9 Gießen 98.9 95.0 95.1 104.8 1.6 33.0 65.4 246.8 3.7 5.7 51.9 5.9 7.0 Kassel 105.9 101.3 102.1 111.7 2.1 34.7 63.3 114.3 4.6 7.6 52.3 7.7 8.6 Mecklenburg-Vorpommern 71.2 69.4 69.8 76.5 5.8 26.5 67.7 30.1 12.0 15.0 44.8 16.3 15.1 Niedersachsen 101.5 96.0 96.5 105.8 3.2 31.3 65.5 194.9 5.2 7.7 46.3 7.8 10.6 Braunschweig 103.5 106.1 105.0 116.9 1.9 36.0 62.1 331.9 6.1 9.2 50.4 9.9 12.0 Hannover 114.2 108.2 108.3 119.3 2.0 29.7 68.3 226.1 5.1 7.9 42.6 7.6 10.6 Lüneburg 87.9 78.5 80.3 86.5 4.8 27.5 67.8 153.4 4.4 6.7 47.1 6.6 9.8 Weser-Ems 97.8 90.1 91.3 99.3 4.1 32.4 63.5 100.2 5.1 7.3 45.4 7.4 10.1 Nordrhein-Westfalen 114.2 108.6 108.5 119.8 1.6 32.9 65.5 260.8 5.4 7.5 48.1 7.5 8.9 Düsseldorf 124.2 121.2 119.9 133.6 1.3 30.9 67.9 319.8 6.0 7.8 51.8 7.6 9.6 Köln 123.8 115.5 117.0 127.3 1.2 29.6 69.3 321.6 5.1 7.0 45.4 6.8 8.2 Münster 95.7 87.7 87.9 96.7 3.2 33.1 63.7 181.5 5.3 7.6 48.3 7.6 9.0 Detmold 111.0 105.5 105.5 116.3 1.8 38.3 60.0 216.3 4.0 6.8 41.7 7.2 8.4 Arnsberg 103.8 99.7 99.0 109.9 1.4 36.2 62.4 189.3 5.7 8.1 48.8 8.3 8.9 Rheinland-Pfalz 101.9 96.7 96.1 106.6 2.6 34.3 63.1 294.5 3.4 5.8 44.1 6.0 7.1 Koblenz 95.9 89.5 89.7 98.7 2.2 36.4 61.4 178.4 3.0 : : : : Trier 92.0 85.4 85.8 94.1 4.2 31.2 64.6 82.2 3.7 : : : : Rheinhessen-Pfalz 108.9 105.0 103.7 115.7 2.2 37.4 60.4 436.4 3.5 : : : : Saarland 104.5 96.8 97.0 106.7 1.2 33.8 65.0 147.1 5.9 7.9 54.8 7.7 9.8 Sachsen 73.0 70.4 70.9 77.6 3.1 33.2 63.7 81.0 8.6 14.0 55.0 15.7 16.7 Chemnitz 67.1 65.9 66.8 72.7 2.9 38.3 58.8 52.6 8.6 13.6 55.4 16.2 15.5 Dresden 73.4 71.6 71.5 79.0 3.7 31.2 65.0 136.5 8.6 14.3 53.3 15.6 17.9 Leipzig 81.3 75.0 75.9 82.7 2.3 28.7 69.0 36.2 8.6 14.3 56.8 15.2 16.5 Sachsen-Anhalt 67.4 68.4 68.6 75.4 4.1 30.9 65.0 42.0 9.9 16.2 59.3 18.4 19.3 Dessau 64.3 64.2 63.7 70.7 3.6 33.8 62.6 26.3 9.9 16.9 62.5 19.8 18.5 Halle 70.8 70.0 70.4 77.2 3.5 30.9 65.6 58.5 9.9 16.9 56.8 18.9 22.3 Magdeburg 66.3 69.1 69.4 76.2 4.7 29.7 65.6 37.2 9.9 15.4 59.8 17.4 17.6 Schleswig-Holstein 105.1 96.2 97.8 106.0 3.9 24.1 72.0 130.4 4.6 7.1 44.8 6.4 9.9 Thüringen 67.5 69.6 69.5 76.7 3.4 33.6 63.0 70.1 9.9 12.3 49.8 14.4 14.3
- 2. Demografia Educació Nivell d'educació de la Taxa d'ocupació (% de la pobl. % de la població per població de 25 a 59 anys 15-64 anys), 2001 edats : (2000) (% del total), 2001 1000 habitants, 2000 Densitat de població (hab./km²), 2000 Regió més de 65 anys 15-64 anys <15 anys Homes Dones Total Elevat Mitjà Baix 64.3 55.1 73.5 378914 118.7 16.8 66.9 16.3 34.2 43.5 22.3 UE-15 56.8 51.1 62.7 74855 101.8 18.3 68.7 12.9 17.2 68.6 14.2 10 candidats a l'adhesió 63.1 54.4 71.7 453769 115.6 17.1 67.2 15.7 30.7 48.7 20.6 UE-25 57.8 52.4 63.3 105460 97.2 18.2 68.6 13.2 19.1 66.8 14.0 12 candidats a l'adhesió 62.9 54.5 71.3 484374 113.3 17.1 67.3 15.6 30.4 49.4 20.2 UE-27 59.7 50.7 68.6 10246 335.7 17.6 65.6 16.8 38.2 32.6 29.2 Belgique-België 53.9 46.4 61.5 961 5956.4 17.8 65.4 16.8 38.4 26.3 35.3 Reg. Bruxelles-Cap. / Brussels Hfdst. Gew. 63.0 54.0 71.7 5943 439.8 17.1 66.2 16.7 36.1 34.2 29.7 Vlaams Gewest 60.0 48.9 70.9 1644 573.3 17.2 65.9 16.9 36.7 32.1 31.3 Antwerpen 60.0 50.5 69.2 793 327.2 17.4 68.8 13.8 41.7 33.9 24.4 Limburg 64.9 56.4 73.2 1362 456.7 16.6 66.3 17.1 39.5 34.2 26.4 Oost-Vlaanderen 65.7 59.1 72.2 1016 482.4 17.1 66.1 16.8 26.7 35.0 38.4 Vlaams Brabant 64.6 56.4 72.5 1129 360.1 17.0 64.9 18.1 35.9 36.8 27.3 West-Vlaanderen 55.4 46.1 64.8 3341 198.4 18.6 64.6 16.8 41.8 31.7 26.6 Région Wallonne 59.1 51.2 67.1 351 321.6 19.7 65.6 14.7 27.8 30.1 42.1 Brabant Wallon 52.3 43.4 61.2 1279 337.8 18.2 64.6 17.3 45.7 32.4 21.9 Hainaut 56.0 45.9 66.1 1019 263.9 18.1 64.6 17.2 43.7 29.8 26.5 Liège 61.5 51.5 71.0 248 55.8 20.4 63.4 16.2 38.8 33.0 28.2 Luxembourg 57.1 47.1 67.0 445 121.3 19.0 64.7 16.3 39.0 34.3 26.7 Namur 75.9 71.4 80.2 5338 123.9 18.4 66.8 14.8 18.5 54.2 27.3 Danmark 65.7 58.7 72.6 82188 230.2 15.7 68.1 16.3 16.1 59.7 24.2 Deutschland 69.9 62.4 77.5 10499 293.7 16.8 67.7 15.5 20.0 54.3 25.7 Baden-Württemberg 70.7 62.8 78.4 3926 371.9 16.8 68.0 15.3 20.8 53.5 25.7 Stuttgart 68.5 61.1 76.0 2680 387.3 15.9 68.1 16.0 18.2 55.0 26.8 Karlsruhe 69.0 61.7 76.4 2131 227.8 17.1 67.0 15.9 20.5 56.1 23.5 Freiburg 71.5 64.1 78.7 1762 197.6 18.0 67.2 14.8 20.2 53.1 26.7 Tübingen 71.4 63.9 78.7 12187 172.7 16.4 67.6 16.0 18.5 58.3 23.3 Bayern 73.4 66.1 80.6 4056 231.4 15.7 69.0 15.4 17.7 54.6 27.7 Oberbayern 72.0 64.3 79.5 1173 113.6 17.1 67.0 15.9 19.6 61.0 19.5 Niederbayern 70.0 62.8 76.9 1076 111.0 17.2 67.0 15.9 18.6 64.1 17.4 Oberpfalz 69.4 63.2 75.6 1113 154.0 16.1 66.4 17.4 19.5 60.1 20.5 Oberfranken 69.3 62.9 75.6 1685 232.6 16.0 67.7 16.4 18.6 56.7 24.7 Mittelfranken 69.2 59.9 78.3 1334 156.4 17.1 66.8 16.1 17.7 61.9 20.4 Unterfranken 71.8 63.3 80.2 1749 175.0 17.5 66.5 16.1 19.4 59.0 21.6 Schwaben 60.2 57.1 63.2 3384 3796.1 13.8 72.1 14.2 16.7 50.8 32.6 Berlin 61.3 58.1 64.5 2600 88.2 14.1 71.1 14.9 5.0 65.2 29.8 Brandenburg 61.9 56.0 67.9 661 1636.3 14.0 67.9 18.1 20.5 59.2 20.3 Bremen 66.9 60.9 72.8 1710 2264.2 13.5 69.8 16.7 17.5 55.6 26.8 Hamburg 67.9 60.6 75.1 6058 286.9 15.5 68.3 16.2 16.8 57.9 25.4 Hessen 69.2 62.0 76.3 3727 500.7 15.1 69.3 15.7 17.0 55.3 27.7 Darmstadt 66.8 59.6 73.7 1063 197.5 16.4 67.4 16.2 17.0 60.1 22.9 Gießen 64.9 57.0 72.6 1268 153.0 16.0 66.1 17.8 15.9 64.1 20.0 Kassel 59.8 56.1 63.3 1783 76.9 14.5 71.0 14.5 8.0 63.6 28.4 Mecklenburg-Vorpommern 65.0 57.3 72.4 7911 166.1 16.6 66.8 16.6 16.0 63.9 20.1 Niedersachsen 63.2 55.8 70.4 1669 206.1 15.5 66.8 17.7 14.7 65.7 19.6 Braunschweig 65.3 59.2 71.2 2156 238.4 15.4 67.1 17.5 16.4 62.2 21.5 Hannover 66.3 58.6 73.9 1666 107.4 17.1 66.8 16.1 16.0 62.9 21.1 Lüneburg 64.9 55.8 73.8 2419 161.7 18.3 66.5 15.2 16.5 64.9 18.6 Weser-Ems 63.5 54.7 72.2 17998 528.1 16.3 67.1 16.6 19.2 59.9 20.8 Nordrhein-Westfalen 63.4 54.4 72.5 5257 993.8 15.5 67.3 17.2 20.9 59.2 19.8 Düsseldorf 63.7 55.0 72.4 4270 579.8 16.1 68.2 15.7 19.3 56.3 24.4 Köln 62.4 53.6 71.0 2610 378.0 17.6 66.6 15.9 16.9 64.3 18.8 Münster 67.7 60.0 75.3 2052 314.8 17.6 65.6 16.8 16.5 60.9 22.6 Detmold 61.8 52.9 70.6 3809 476.0 16.1 66.8 17.1 19.9 61.4 18.7 Arnsberg 66.4 57.4 75.3 4030 203.1 16.4 66.6 17.0 18.2 59.9 21.9 Rheinland-Pfalz 63.7 54.9 72.2 1518 188.0 16.8 65.7 17.5 : : : Koblenz 63.5 52.9 74.0 511 103.8 16.5 65.8 17.7 : : : Trier 66.0 57.5 74.2 2002 292.2 16.1 67.4 16.5 : : : Rheinhessen-Pfalz 61.6 51.7 71.4 1070 416.2 15.0 67.2 17.8 17.8 64.7 17.5 Saarland 62.2 58.8 65.5 4442 241.3 13.0 69.1 18.0 4.7 65.2 30.2 Sachsen 62.5 58.1 66.9 1630 267.4 12.7 68.2 19.1 3.9 68.0 28.1 Chemnitz 62.2 59.8 64.6 1718 216.7 13.4 69.2 17.4 5.2 62.3 32.5 Dresden 61.7 58.4 64.9 1094 249.4 12.8 70.0 17.2 5.1 65.4 29.5 Leipzig 59.4 55.2 63.4 2633 128.8 13.5 69.7 16.9 7.5 66.9 25.6 Sachsen-Anhalt 58.2 53.4 62.8 548 128.1 13.1 69.8 17.1 8.2 66.6 25.2 Dessau 57.1 52.5 61.5 870 196.4 13.1 69.6 17.3 6.3 66.8 26.8 Halle 61.5 57.9 64.9 1214 103.5 13.8 69.7 16.5 8.0 67.1 24.9 Magdeburg 66.6 59.5 73.6 2782 176.5 16.1 67.6 16.4 15.4 63.4 21.2 Schleswig-Holstein 63.7 58.4 68.8 2440 150.9 13.5 70.3 16.3 6.2 63.5 30.3 Thüringen
- 3. Economia Mercat laboral d'habitants), mitjana 98-99-2000 Ocupació per sector (en % PIB per habitant (en PPA) Taxa d'atur (%) del total), 2001 Sol·licituds de patents europees (per milió Atur de llarga durada mitjana 1998-1999- 1995, UE-15 = 100 2000, UE-15 = 100 2000, UE-15 = 100 2000, UE-25 = 100 (% de l'atur total) Regió Dones, 2001 Total, 1991 Total, 2001 Agricultura Joves, 2001 Indústria Serveis 2001 Ellada 65.9 67.7 67.6 74.6 16.0 22.8 61.2 6.7 6.9 10.2 52.8 15.4 28.0 Voreia Ellada 61.2 64.2 64.4 70.8 23.3 24.0 52.8 4.6 5.7 11.0 50.7 17.1 28.1 Anatoliki Makedonia, Thraki 55.6 54.6 54.9 60.2 33.2 22.3 44.5 1.2 4.8 9.0 43.7 13.7 19.9 Kentriki Makedonia 64.4 67.9 68.4 74.9 17.8 25.7 56.5 7.4 5.5 10.8 48.0 16.7 28.7 Dytiki Makedonia 63.0 67.0 67.5 73.9 18.4 34.5 47.2 1.1 7.2 15.8 61.6 22.2 39.1 Thessalia 57.1 61.4 60.8 67.7 30.8 17.1 52.2 1.8 6.2 11.6 56.6 19.5 30.2 Kentriki Ellada 58.9 59.1 59.6 65.2 30.1 20.5 49.4 1.4 6.5 10.1 60.3 16.0 32.9 Ipeiros 43.0 47.1 46.7 51.9 23.4 22.6 54.1 0.9 8.8 11.9 71.4 20.5 36.3 Ionia Nisia 56.2 59.2 59.8 65.2 26.8 13.6 59.6 0.0 3.5 6.7 32.1 7.4 17.7 Dytiki Ellada 52.7 51.1 51.3 56.3 32.5 18.0 49.6 3.2 7.8 9.9 64.9 14.8 33.9 Sterea Ellada 82.7 76.4 78.7 84.2 24.0 31.4 44.6 0.5 6.3 13.3 59.6 22.0 40.2 Peloponnisos 51.8 57.7 57.1 63.6 37.1 16.1 46.8 1.2 5.0 8.1 54.6 13.5 27.3 Attiki 75.7 77.1 76.1 85.0 1.4 24.5 74.1 14.0 8.9 10.4 54.8 14.7 27.4 Nisia Aigaiou, Kriti 66.3 69.7 70.2 76.8 24.5 16.9 58.6 2.8 4.3 6.8 28.6 10.9 21.0 Voreio Aigaio 58.9 65.6 65.3 72.3 18.7 19.9 61.4 0.0 7.9 6.1 50.0 11.3 20.5 Notio Aigaio 73.9 79.8 80.8 87.9 7.9 21.0 71.1 0.0 3.2 9.7 11.7 14.6 21.3 Kriti 65.2 66.1 66.6 72.9 32.9 14.4 52.7 5.0 3.6 5.8 35.1 9.4 20.9 España 78.2 82.2 81.2 90.6 6.5 31.6 61.9 22.0 16.0 13.1 31.0 19.0 24.9 Noroeste 65.8 68.1 67.3 75.1 12.6 31.7 55.7 7.8 13.6 14.4 33.0 20.9 29.4 Galicia 63.2 64.7 64.4 71.3 15.4 31.4 53.2 6.9 12.4 14.7 35.5 20.5 30.3 Principado de Asturias 68.9 70.9 69.9 78.1 7.1 32.1 60.9 9.5 16.1 14.4 24.7 22.3 30.4 Cantabria 72.7 80.3 77.2 88.5 7.8 32.8 59.4 8.8 15.3 13.3 34.6 20.4 22.6 Noreste 91.4 97.4 95.6 107.3 4.5 36.8 58.7 32.6 14.6 9.4 33.0 14.6 19.9 Pais Vasco 93.3 101.5 99.3 111.9 1.6 37.2 61.2 34.3 19.1 11.2 41.8 16.8 23.9 Comunidad Foral de Navarra 99.1 105.3 103.1 116.1 6.5 37.8 55.6 48.2 10.5 6.1 14.0 9.1 15.0 La Rioja 89.8 91.2 91.5 100.5 9.9 38.8 51.3 9.4 9.1 7.3 23.1 10.3 13.8 Aragón 84.8 87.9 86.6 96.9 7.7 35.1 57.3 27.9 9.4 8.4 20.2 13.7 16.1 Comunidad de Madrid 102.9 110.0 108.9 121.2 0.8 25.0 74.3 37.1 11.8 9.8 33.6 13.3 21.5 Centro 66.1 68.2 67.3 75.2 11.3 31.9 56.8 7.3 16.2 14.5 26.5 23.9 27.6 Castilla y León 74.5 75.9 74.8 83.7 9.9 32.5 57.7 9.5 14.5 12.2 34.8 20.3 30.0 Castilla-la Mancha 64.2 66.8 66.0 73.6 11.1 34.5 54.4 6.8 13.6 12.9 23.8 22.4 22.6 Extremadura 49.3 53.0 51.9 58.4 15.0 26.0 58.9 3.2 24.2 22.1 18.5 34.1 31.5 Este 87.9 92.0 90.8 101.4 3.2 37.2 59.6 39.0 13.0 9.6 35.1 13.7 17.8 Cataluña 95.5 99.5 98.2 109.7 2.5 39.2 58.3 51.2 11.8 8.8 42.4 11.9 16.6 Comunidad Valenciana 74.2 79.2 78.1 87.3 4.6 36.6 58.8 24.8 15.9 11.4 28.2 17.5 20.0 Illes Balears 97.1 98.3 98.4 108.4 1.7 25.1 73.2 13.5 8.6 6.6 20.4 9.1 15.0 Sur 59.1 62.3 61.4 68.6 11.1 26.3 62.6 6.5 23.7 20.8 29.4 30.1 34.9 Andalucía 58.0 61.2 60.2 67.4 11.1 25.7 63.2 5.9 24.7 22.3 29.6 31.9 37.1 Región de Murcia 65.2 68.7 68.2 75.7 12.0 31.0 57.0 11.3 16.5 11.4 20.2 18.3 21.2 Ceuta y Melilla 65.3 68.1 69.0 75.1 0.4 14.3 85.3 0.0 29.8 21.9 58.5 34.3 40.0 Canarias 75.2 77.5 77.6 85.5 5.5 22.9 71.6 7.0 24.4 13.1 28.0 17.7 24.7 France 103.8 101.1 99.8 111.5 4.0 25.5 68.6 128.7 9.0 8.5 36.8 10.5 19.0 Île de France 160.3 158.3 155.3 174.5 0.3 18.5 81.2 290.4 7.6 7.6 42.0 8.5 12.4 Bassin Parisien 93.5 90.1 89.3 99.3 5.6 31.1 63.3 86.8 9.0 8.6 34.8 10.9 22.8 Champagne-Ardenne 95.2 94.6 94.4 104.2 8.7 30.4 60.8 66.8 8.9 9.2 31.2 12.0 22.0 Picardie 87.7 82.3 82.4 90.7 5.0 33.1 61.9 90.5 9.2 10.2 35.0 12.9 29.7 Haute-Normandie 97.4 95.2 92.8 105.0 2.7 30.3 66.9 103.5 11.2 9.7 41.1 11.8 26.4 Centre 96.2 90.8 90.3 100.1 4.6 33.4 61.9 98.6 8.3 6.6 31.3 8.4 15.9 Basse-Normandie 88.7 85.3 83.7 94.1 8.5 27.6 63.9 53.9 8.1 9.4 34.6 11.6 23.6 Bourgogne 94.4 92.7 92.3 102.2 6.5 28.7 64.9 92.0 8.6 7.7 35.8 10.3 21.2 Nord - Pas-de-Calais 82.5 80.6 79.5 88.9 2.6 29.1 68.3 42.3 11.6 12.6 43.6 15.1 29.8 Est 96.6 90.9 90.3 100.2 3.0 34.2 62.7 118.9 6.9 5.8 29.7 7.5 12.6 Lorraine 89.7 83.5 83.0 92.0 2.8 31.9 65.3 79.3 8.4 6.7 36.0 8.8 15.6 Alsace 108.9 102.9 102.1 113.4 2.5 35.3 62.2 173.2 4.8 4.8 20.1 6.0 9.5 Franche-Comté 92.2 87.6 87.2 96.6 4.4 37.2 58.4 116.7 7.3 5.2 27.8 7.1 12.1 Ouest 88.6 87.1 85.8 96.0 6.8 29.2 64.0 61.9 9.2 7.5 28.8 9.6 17.5 Pays de la Loire 91.3 90.0 88.4 99.3 5.9 32.5 61.6 58.3 9.0 7.5 28.6 9.7 17.4 Bretagne 87.0 86.2 85.1 95.0 7.4 26.4 66.2 71.6 8.6 6.6 26.4 8.2 15.8 Poitou-Charentes 86.1 82.9 82.0 91.4 7.5 28.3 64.2 51.8 10.9 9.2 32.6 12.0 21.2 Sud-Ouest 90.9 88.6 87.9 97.7 6.8 24.4 68.8 68.5 9.0 8.4 35.4 11.0 19.3 Aquitaine 92.3 90.4 90.1 99.6 7.1 22.8 70.1 50.0 10.4 8.3 33.8 11.0 19.2 Midi-Pyrénées 91.4 88.5 87.4 97.6 6.0 26.0 68.0 97.0 8.0 9.0 38.4 11.8 20.8 Limousin 84.1 82.0 80.8 90.4 8.7 25.5 65.8 42.7 7.9 6.4 32.8 8.0 14.7 Centre-Est 101.1 100.0 99.1 110.3 4.4 29.8 65.8 197.6 8.4 7.2 30.7 9.0 17.0 Rhône-Alpes 104.7 103.1 102.2 113.7 3.5 30.3 66.2 222.6 8.0 7.0 29.4 8.7 15.9 Auvergne 86.2 86.5 85.6 95.3 8.5 27.1 64.2 89.7 10.0 8.2 37.1 10.7 22.8 Méditerranée 89.6 86.0 85.0 94.8 4.5 17.0 78.5 80.5 11.9 13.4 42.1 16.1 27.0 Languedoc-Roussillon 79.8 77.7 77.0 85.6 8.5 15.8 75.7 58.0 12.7 14.1 45.8 16.9 26.9 Provence-Alpes-Côte d'Azur 95.3 90.8 89.7 100.1 2.6 17.5 79.9 96.2 11.6 13.2 40.6 15.7 27.0 Corse 75.2 76.0 75.1 83.8 3.9 17.5 78.9 7.0 11.3 12.5 33.2 17.1 28.3 Départements d'Outre-Mer 56.6 56.4 56.3 62.2 4.9 14.5 80.6 2.4 : 29.4 : 32.5 45.7 Guadeloupe 56.2 57.6 57.2 63.5 3.6 14.6 81.8 4.3 : 29.0 : 33.8 Martinique 64.2 67.4 66.7 74.3 6.5 13.0 80.5 0.6 : 26.3 : 31.3 37.0 Guyane 55.2 53.7 54.7 59.2 3.3 18.2 78.6 0.7 : 20.5 : 25.6 25.8 Réunion 52.8 50.4 50.4 55.6 5.0 14.6 80.4 2.5 : 33.3 : 34.0 50.0
- 4. Demografia Educació Nivell d'educació de la Taxa d'ocupació (% de la pobl. % de la població per població de 25 a 59 anys d'habitants, 2000 15-64 anys), 2001 edats : (2000) (% del total), 2001 Densitat de població (hab./km²), 2000 Regió més de 65 anys 15-64 anys <15 anys Homes Dones Total Elevat Mitjà Baix 1000 i 55.6 41.2 71.0 10558 80.2 15.2 67.6 17.3 44.6 36.9 18.5 Ellada 55.4 40.3 71.7 3422 60.6 15.4 67.6 17.0 49.7 32.5 17.8 Voreia Ellada 59.6 45.4 75.2 564 39.8 16.0 66.2 17.9 59.3 26.6 14.1 Anatoliki Makedonia, Thraki 54.5 39.4 71.0 1809 96.2 15.3 68.6 16.1 45.1 35.4 19.5 Kentriki Makedonia 53.7 39.5 68.7 304 32.2 15.8 66.3 17.9 53.9 31.0 15.1 Dytiki Makedonia 55.1 38.8 72.0 744 53.0 15.2 66.7 18.2 52.8 29.8 17.4 Thessalia 55.5 39.2 72.2 2657 49.3 14.0 66.6 19.4 56.7 30.4 13.0 Kentriki Ellada 52.7 36.4 69.6 376 40.9 13.2 67.2 19.6 57.7 26.4 16.0 Ipeiros 61.2 48.5 74.7 205 89.0 14.8 64.7 20.5 56.8 30.6 12.6 Ionia Nisia 54.5 37.5 71.6 741 65.3 15.5 67.1 17.4 57.9 29.6 12.5 Dytiki Ellada 51.6 33.8 69.7 664 42.7 13.2 67.7 19.1 59.5 30.1 10.5 Sterea Ellada 60.3 44.7 76.3 671 43.3 13.2 65.3 21.5 52.0 33.9 14.2 Peloponnisos 54.8 41.8 68.7 3456 907.6 15.3 68.8 15.9 32.8 44.5 22.6 Attiki 60.3 45.5 75.8 1023 58.6 16.8 65.6 17.6 56.7 30.5 12.8 Nisia Aigaiou, Kriti 52.1 33.1 72.6 183 47.8 15.4 61.6 23.0 52.3 36.3 11.4 Voreio Aigaio 57.0 39.8 75.9 273 51.7 17.5 67.5 15.0 61.6 28.1 10.3 Notio Aigaio 64.6 52.5 76.9 566 67.9 16.9 66.1 17.1 55.7 29.8 14.5 Kriti 60.6 44.4 77.1 39927 79.1 14.9 68.4 16.8 57.6 17.6 24.9 España 57.3 43.4 71.5 4295 94.8 12.0 68.2 19.8 61.0 16.6 22.5 Noroeste 58.8 45.8 72.3 2714 92.2 12.3 68.0 19.7 63.4 14.6 22.0 Galicia 53.0 38.0 68.1 1053 99.7 10.9 68.3 20.8 58.4 19.7 21.9 Principado de Asturias 57.7 41.8 74.2 528 99.7 12.7 68.8 18.6 53.9 20.3 25.8 Cantabria 63.1 47.2 79.1 4036 57.4 12.6 68.8 18.6 48.7 19.1 32.2 Noreste 63.0 47.9 78.4 2064 284.3 12.1 70.7 17.2 45.0 19.9 35.1 Pais Vasco 67.5 51.6 82.9 538 51.6 13.7 68.3 18.0 48.3 18.0 33.7 Comunidad Foral de Navarra 66.3 48.3 83.5 265 52.6 13.3 67.4 19.3 56.2 17.8 26.1 La Rioja 60.6 43.9 77.5 1169 24.5 12.8 65.9 21.4 54.2 18.4 27.4 Aragón 63.8 49.8 78.4 5150 644.2 14.6 70.1 15.4 45.5 20.2 34.3 Comunidad de Madrid 56.7 37.9 75.1 5256 24.4 14.5 65.4 20.1 61.6 16.7 21.7 Centro 58.3 40.9 75.0 2470 26.2 12.4 66.0 21.6 54.9 19.2 25.9 Castilla y León 57.1 36.1 78.4 1713 21.6 16.1 64.7 19.2 67.0 14.8 18.3 Castilla-la Mancha 52.4 33.9 70.4 1074 25.8 16.6 65.3 18.1 68.6 14.2 17.2 Extremadura 68.9 53.2 84.8 10998 182.5 14.5 68.7 16.8 58.3 17.8 23.9 Este 71.6 57.4 85.9 6170 193.2 13.9 68.6 17.5 55.1 18.7 26.3 Cataluña 63.8 46.4 81.9 4039 173.3 15.1 68.9 16.1 62.9 15.6 21.4 Comunidad Valenciana 74.0 57.2 91.4 790 157.5 16.4 68.3 15.3 60.2 21.9 17.9 Illes Balears 51.2 33.7 69.1 8502 86.2 17.9 68.1 14.1 63.8 15.6 20.7 Sur 49.9 32.7 67.7 7237 82.9 17.8 68.1 14.1 64.5 15.2 20.3 Andalucía 59.8 41.3 78.2 1125 99.4 18.0 67.8 14.3 60.8 16.6 22.6 Región de Murcia 49.6 28.8 71.9 140 4516.2 21.4 66.5 12.2 50.7 26.5 22.8 Ceuta y Melilla 60.3 42.0 79.7 1689 233.2 17.1 71.0 11.9 61.4 18.8 19.7 Canarias 62.7 55.7 69.8 60589 111.4 18.9 65.1 16.0 34.6 41.7 23.7 France 66.6 61.6 71.8 11001 915.8 19.8 68.1 12.1 31.1 34.5 34.4 Île de France 62.8 55.3 70.5 10492 72.0 19.2 64.4 16.4 40.0 42.4 17.6 Bassin Parisien 61.3 52.1 70.8 1343 52.4 19.2 65.1 15.7 43.3 40.3 16.4 Champagne-Ardenne 60.9 52.1 69.6 1865 96.2 20.6 65.2 14.2 44.5 39.5 16.0 Picardie 61.8 54.3 69.6 1789 145.3 20.3 65.2 14.5 40.1 39.4 20.6 Haute-Normandie 65.0 58.4 71.8 2454 62.7 18.4 63.8 17.8 38.4 45.5 16.1 Centre 64.2 58.6 69.8 1429 81.3 19.1 63.6 17.3 36.7 44.7 18.6 Basse-Normandie 63.3 55.7 70.9 1612 51.1 17.7 63.4 18.9 36.5 44.9 18.7 Bourgogne 54.0 44.1 64.0 4009 323.0 21.3 64.8 13.9 43.6 39.0 17.5 Nord - Pas-de-Calais 64.4 55.8 73.0 5189 108.0 19.1 65.9 15.0 33.8 45.9 20.3 Est 62.7 53.7 71.6 2313 98.2 19.0 65.6 15.4 34.4 46.6 19.0 Lorraine 66.4 57.7 75.0 1754 211.8 19.2 66.8 13.9 31.0 46.8 22.3 Alsace 65.1 57.2 73.1 1121 69.2 19.1 65.0 15.9 36.7 43.3 20.1 Franche-Comté 64.2 57.8 70.6 7834 92.1 18.4 63.9 17.7 31.7 47.0 21.3 Ouest 64.5 57.7 71.4 3255 101.5 19.2 64.4 16.4 33.1 46.9 20.1 Pays de la Loire 63.7 57.7 69.8 2929 107.6 18.3 63.8 18.0 29.3 46.7 24.0 Bretagne 64.5 58.0 70.7 1651 63.9 17.0 63.1 19.9 34.2 47.9 18.0 Poitou-Charentes 62.4 55.3 69.5 6220 60.0 16.6 63.8 19.6 30.7 45.9 23.4 Sud-Ouest 61.1 54.0 68.4 2932 71.0 16.9 64.0 19.1 33.3 45.4 21.3 Aquitaine 63.6 55.9 71.2 2576 56.8 16.7 64.1 19.2 27.4 45.4 27.3 Midi-Pyrénées 63.5 59.8 67.4 711 42.0 14.6 62.4 23.0 31.4 50.2 18.4 Limousin 64.5 57.8 71.4 7008 100.5 18.9 65.3 15.8 31.1 43.8 25.2 Centre-Est 64.8 58.1 71.6 5697 130.4 19.5 65.5 15.0 30.8 43.2 26.1 Rhône-Alpes 63.3 56.1 70.7 1310 50.4 16.2 64.3 19.6 32.6 46.6 20.8 Auvergne 55.9 48.7 63.7 7137 105.8 17.8 63.5 18.7 39.1 39.8 21.1 Méditerranée 54.8 47.5 62.6 2325 84.9 17.5 63.2 19.3 39.2 40.6 20.2 Languedoc-Roussillon 57.0 49.8 64.8 4551 144.9 18.0 63.7 18.4 38.5 40.0 21.5 Provence-Alpes-Côte d'Azur 42.4 36.1 49.0 261 30.1 16.9 64.4 18.7 53.5 24.8 21.7 Corse 41.3 35.5 47.4 1699 19.0 27.6 64.3 8.1 : : : Départements d'Outre-Mer 42.2 38.3 46.6 428 251.0 25.2 65.2 9.6 : : : Guadeloupe 45.4 40.5 50.9 385 341.0 23.5 65.1 11.5 : : : Martinique 41.6 33.0 50.4 164 2.0 35.6 60.6 3.8 : : : Guyane 38.5 31.7 45.6 722 286.6 29.5 64.2 6.3 : : : Réunion
- 5. Economia Mercat laboral d'habitants), mitjana 98-99-2000 Ocupació per sector (en % PIB per habitant (en PPA) Taxa d'atur (%) Sol·licituds de patents del total), 2001 europees (per milió Atur de llarga durada (% de l'atur total) mitjana 1998-1999- 1995, UE-15 = 100 2000, UE-15 = 100 2000, UE-15 = 100 2000, UE-25 = 100 Regió Dones, 2001 Total, 2001 Agricultura Joves, 2001 Indústria Total 1991 Serveis 2001 , Ireland 93.2 115.2 111.2 126.9 7.0 29.0 63.6 70.8 14.6 3.7 : 3.6 6.2 Border, Midland and Western 70.5 83.8 81.3 92.4 12.0 32.6 55.0 42.1 13.6 4.6 : 4.8 7.4 Southern and Eastern 101.5 126.4 121.9 139.3 5.3 27.8 66.4 80.8 15.0 3.4 : 3.3 5.8 Italia 103.4 102.0 102.9 112.4 5.2 31.7 63.1 68.1 8.7 9.5 62.9 12.9 28.2 Nord Ovest 117.9 116.5 117.3 128.5 3.9 33.8 62.3 94.2 5.5 5.3 49.7 7.5 17.1 Piemonte 121.6 119.6 120.3 131.8 3.9 37.7 58.4 110.5 5.2 5.2 49.3 7.3 14.6 Valle d'Aosta 139.7 123.1 128.5 135.7 6.2 22.5 71.3 17.8 2.9 3.5 17.9 4.7 10.8 Liguria 106.8 108.1 108.5 119.1 3.7 23.1 73.2 56.9 6.7 6.0 52.2 8.3 25.3 Lombardia 137.6 134.5 136.5 148.3 2.1 40.4 57.5 146.9 2.9 4.0 45.6 5.9 11.1 Nord Est 123.5 120.6 121.7 132.9 4.5 36.4 59.1 93.8 3.5 3.4 29.7 5.4 8.9 Trentino-Alto Adige 137.3 136.3 137.3 150.2 7.4 27.1 65.4 53.1 2.9 3.0 20.1 4.0 5.5 Veneto 121.9 119.0 120.2 131.2 4.2 40.0 55.9 98.2 3.5 3.7 29.5 6.0 7.1 Friuli-Venezia Giulia 118.9 114.1 115.1 125.8 3.3 30.3 66.5 109.0 4.3 3.8 37.0 6.7 7.6 Emilia-Romagna 132.6 129.1 130.3 142.3 5.7 36.1 58.2 146.8 3.6 4.6 29.9 5.9 11.6 Centro 108.7 108.8 108.9 119.9 4.1 36.2 59.8 54.9 6.4 5.0 43.6 7.6 16.2 Toscana 112.6 113.5 113.4 125.1 4.2 34.1 61.7 59.2 6.4 5.0 41.0 7.9 17.3 Umbria 101.6 100.6 100.6 110.9 4.2 33.1 62.7 35.2 8.0 4.8 52.5 7.7 12.1 Marche 103.1 102.1 102.7 112.5 3.6 43.0 53.4 55.9 5.5 4.5 45.4 5.9 11.8 Lazio 117.1 112.9 115.3 124.4 3.1 19.2 77.8 44.0 8.8 10.3 75.7 13.8 33.3 Abruzzo-Molise 86.0 82.7 83.1 91.2 6.3 32.0 61.7 49.3 9.0 7.4 56.3 12.3 26.2 Abruzzo 88.3 83.7 84.3 92.3 5.5 32.8 61.8 59.6 8.0 4.3 49.6 6.8 18.5 Molise 77.4 78.8 78.7 86.8 9.7 29.0 61.4 9.2 12.8 13.1 64.7 20.3 37.8 Campania 65.3 65.3 66.0 72.0 6.9 24.7 68.5 9.8 17.8 22.4 76.2 30.7 59.9 Sud 65.4 66.2 66.2 73.0 11.4 25.1 63.6 9.0 15.2 18.3 66.2 27.6 45.0 Puglia 66.7 67.1 66.9 74.0 11.7 26.5 61.8 9.4 13.2 14.3 66.4 21.8 37.5 Basilicata 70.4 73.4 74.0 80.9 10.4 34.7 54.9 13.3 17.0 15.7 65.4 25.2 42.5 Calabria 61.2 62.1 62.3 68.5 10.8 18.8 70.3 7.0 18.6 24.8 66.0 36.4 58.5 Sicilia 65.9 65.4 66.0 72.1 9.9 19.4 70.7 13.8 18.7 20.8 71.5 30.3 51.5 Sardegna 76.0 75.5 76.6 83.2 8.5 23.3 68.2 9.7 15.7 19.1 62.9 27.4 51.9 Luxembourg (Grand-Duché) 170.6 195.3 187.0 215.3 1.5 21.4 76.8 171.6 1.5 2.4 27.6 3.1 7.2 Nederland 109.2 111.2 113.6 122.6 3.0 20.4 71.2 196.8 5.7 2.3 37.7 2.6 5.0 Noord-Nederland 104.5 101.6 103.7 112.0 3.8 24.1 66.8 73.2 7.1 3.8 39.2 4.5 9.3 Groningen 129.7 124.3 125.9 137.0 2.9 20.7 71.3 78.7 7.6 4.3 43.3 4.9 9.4 Friesland 91.1 91.5 93.7 100.8 4.8 25.7 64.5 65.4 6.9 3.6 44.5 4.6 9.7 Drenthe 91.6 87.9 90.3 96.9 3.8 26.2 64.2 77.0 6.8 3.4 31.8 3.9 8.4 Oost-Nederland 94.1 94.3 96.6 103.9 3.1 23.1 68.3 133.1 5.9 2.3 35.1 2.9 4.5 Overijssel 93.8 94.4 96.4 104.1 3.5 26.3 65.2 136.5 6.4 2.5 31.1 2.9 5.8 Gelderland 95.8 96.6 99.2 106.5 2.5 22.2 69.8 136.5 5.6 2.2 36.1 2.9 3.8 Flevoland 83.3 79.9 82.1 88.1 6.0 18.3 70.0 100.2 5.8 1.9 40.4 2.7 4.1 West-Nederland 119.9 123.4 125.9 136.0 2.5 15.8 76.1 134.7 5.5 2.0 37.5 2.0 4.2 Utrecht 130.4 140.3 142.7 154.7 1.1 14.9 79.4 173.1 4.7 1.2 45.3 1.1 2.1 Noord-Holland 125.8 130.2 133.2 143.5 2.0 14.4 77.8 118.8 6.0 2.0 39.9 1.8 5.7 Zuid-Holland 113.8 115.7 118.1 127.6 3.3 16.3 74.5 139.1 5.4 2.1 36.0 2.2 4.3 Zeeland 105.7 97.5 99.1 107.5 3.4 24.3 67.8 89.6 4.5 2.3 23.6 4.3 Zuid-Nederland 102.8 106.0 108.2 116.8 3.3 26.1 65.1 449.8 5.5 2.2 39.4 2.8 5.2 Noord-Brabant 106.4 110.0 112.0 121.3 3.2 26.0 65.1 577.8 5.4 2.0 36.6 2.7 4.8 Limburg 95.6 97.6 100.3 107.6 3.6 26.3 65.1 187.0 5.7 2.5 44.6 3.0 6.2 Österreich 110.3 114.3 111.7 126.0 5.8 29.4 64.8 144.5 3.8 3.4 26.1 4.1 5.5 Ostösterreich 118.9 123.1 120.2 135.7 4.8 25.1 70.1 124.3 4.0 3.8 30.5 4.1 5.7 Burgenland 71.4 73.2 72.4 80.7 7.0 31.8 61.2 58.5 3.1 3.2 22.8 3.9 5.3 Niederösterreich 88.8 96.8 94.8 106.7 8.8 29.5 61.7 124.5 2.9 2.8 25.0 3.3 4.4 Wien 155.7 157.0 152.8 173.1 0.9 20.0 79.1 135.6 5.2 4.9 34.2 4.9 7.2 Südösterreich 92.8 95.9 94.0 105.7 7.8 32.5 59.7 130.9 4.3 3.7 20.3 4.8 6.3 Kärnten 94.4 96.0 94.4 105.8 6.3 30.7 63.0 128.1 4.7 4.3 18.5 5.9 7.7 Steiermark 92.0 95.9 93.7 105.7 8.5 33.3 58.3 132.3 4.2 3.5 21.1 4.4 5.7 Westösterreich 110.8 115.0 112.7 126.8 5.8 32.6 61.6 176.9 3.3 2.7 22.6 3.7 4.9 Oberösterreich 103.4 109.4 106.9 120.6 7.8 34.6 57.7 178.5 3.0 2.1 25.6 2.6 3.8 Salzburg 127.9 130.8 128.0 144.2 4.6 27.5 67.9 117.1 3.1 3.0 12.3 3.8 5.6 Tirol 111.2 112.8 111.7 124.4 4.5 28.6 66.9 123.3 4.5 4.0 21.7 5.8 7.1 Vorarlberg 114.7 117.9 114.7 130.0 2.6 39.7 57.7 362.4 2.5 2.6 22.8 3.7 4.3 Portugal 69.7 68.0 70.7 75.0 13.0 34.0 53.0 3.7 3.6 4.0 38.0 5.1 9.0 Continente 70.3 68.2 71.0 75.2 12.9 34.2 52.9 3.8 3.6 4.1 37.6 5.1 9.2 Norte 59.0 56.0 58.1 61.7 12.7 43.9 43.4 2.8 2.7 3.7 44.4 4.7 6.1 Centro 57.0 54.2 56.4 59.7 27.3 31.2 41.5 3.4 2.3 2.4 29.7 3.0 8.1 Lisboa e Vale do Tejo 90.7 90.9 94.6 100.2 4.8 28.0 67.2 5.6 4.4 5.3 35.0 6.4 13.5 Alentejo 59.2 54.5 56.9 60.0 14.5 22.3 63.3 1.3 9.1 5.7 39.9 8.4 15.3 Algarve 71.7 66.0 69.8 72.7 8.7 21.1 70.2 2.6 3.9 3.6 25.0 5.0 9.4 Açores 51.5 51.7 52.6 57.0 13.8 29.8 56.5 0.7 3.7 2.2 30.6 4.2 6.3 Madeira 66.2 74.4 75.9 82.1 13.1 30.3 56.6 2.6 3.0 2.8 62.6 3.4 4.5