
Empfohlen
Weitere ähnliche Inhalte
Was ist angesagt?
Was ist angesagt? (18)
Ähnlich wie 4 vital signs lab
Ähnlich wie 4 vital signs lab (20)
Mehr von lvilleDrFox
Mehr von lvilleDrFox (13)
4 vital signs lab
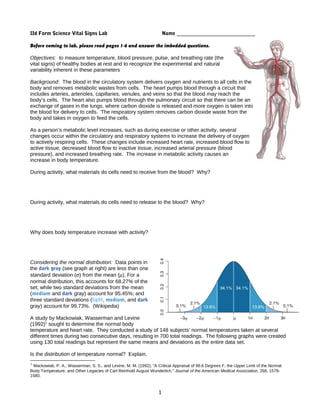
- 1. IId Form Science Vital Signs Lab Name ___________________________ Before coming to lab, please read pages 1-6 and answer the imbedded questions. Objectives: to measure temperature, blood pressure, pulse, and breathing rate (the vital signs) of healthy bodies at rest and to recognize the experimental and natural variability inherent in these parameters Background: The blood in the circulatory system delivers oxygen and nutrients to all cells in the body and removes metabolic wastes from cells. The heart pumps blood through a circuit that includes arteries, arterioles, capillaries, venules, and veins so that the blood may reach the body’s cells. The heart also pumps blood through the pulmonary circuit so that there can be an exchange of gases in the lungs, where carbon dioxide is released and more oxygen is taken into the blood for delivery to cells. The respiratory system removes carbon dioxide waste from the body and takes in oxygen to feed the cells. As a person’s metabolic level increases, such as during exercise or other activity, several changes occur within the circulatory and respiratory systems to increase the delivery of oxygen to actively respiring cells. These changes include increased heart rate, increased blood flow to active tissue, decreased blood flow to inactive tissue, increased arterial pressure (blood pressure), and increased breathing rate. The increase in metabolic activity causes an increase in body temperature. During activity, what materials do cells need to receive from the blood? Why? During activity, what materials do cells need to release to the blood? Why? Why does body temperature increase with activity? Considering the normal distribution: Data points in the dark gray (see graph at right) are less than one standard deviation (σ) from the mean (µ). For a normal distribution, this accounts for 68.27% of the set; while two standard deviations from the mean (medium and dark gray) account for 95.45%; and three standard deviations (light, medium, and dark gray) account for 99.73%. (Wikipedia) A study by Mackowiak, Wasserman and Levine (1992)1 sought to determine the normal body temperature and heart rate. They conducted a study of 148 subjects' normal temperatures taken at several different times during two consecutive days, resulting in 700 total readings. The following graphs were created using 130 total readings but represent the same means and deviations as the entire data set. Is the distribution of temperature normal? Explain. 1 Mackowiak, P. A., Wasserman, S. S., and Levine, M. M. (1992), "A Critical Appraisal of 98.6 Degrees F, the Upper Limit of the Normal Body Temperature, and Other Legacies of Carl Reinhold August Wunderlich," Journal of the American Medical Association, 268, 1578- 1580. 1
- 2. vital signs data set - heart rate and temp text Dot Plot Distribution of human body temperature (y-axis is frequency) The mean temperature is 98.25°F. Draw a line on the graph at left to show the mean. The standard deviation is ±0.73°F. Add and subtract two standard deviations to the mean. Show this range on the graph at left. This area is where 95.45% of all future measurements should fall. What does this suggest about the “normal” body temperature 93 94 95 96 97 98 99 100 101 98.6°F? Temperature_F Dot Plot vital signs data set - heart rate and temp text Is the distribution of heart rate normal? Explain. Distribution of human body heart rate (y-axis is frequency) 55 60 65 70 75 80 85 90 Heartrate_beatsm in To measure temperature, turn the thermometer on, reset it if necessary, and cover it with a new sheath. Hold the bulb of the thermometer under the tongue, close the mouth, read the temperature when the thermometer beeps. Dispose of the sheath when done. Normal temperature is considered 37°C (98.6°F). Think about it… then research it… What does a temperature lower than normal tell a physician? What might it indicate for the patient? What does a temperature higher than normal tell a physician? What might it indicate for the patient? To measure breathing rate, have the subject watch the clock while a helper counts his/her breaths. After 30 seconds, multiply the number of breaths by 2 to get the rate per minute. Normal breathing rate at rest is 12-18 breaths per minute. Think about it… then research it… What does a breathing rate lower than normal tell a physician? What might it indicate for the patient? What does a breathing rate higher than normal tell a physician? What might it indicate for the patient? 2
- 3. To measure pulse rate, or heart rate, follow the detailed directions on p. 5. People who are physically fit have a higher stroke volume (volume of blood pumped per heart beat) than those who are less fit, so resting heart rate is usually lower than that of a less physically fit individual. Normal pulse at rest is 60-80 beats per minute (bpm). Think about it… then research it… What does a pulse rate lower than normal tell a physician? What might it indicate for the patient? What does a pulse rate higher than normal tell a physician? What might it indicate for the patient? To measure blood pressure, use the automatic sphygmomanometer (which essentially does what is pictured in Figure 1 – see detailed directions on p. 5). When the heart’s ventricles contract, sending blood through the body, pressure is increased throughout all the arteries carrying the blood. Arterial blood pressure is directly dependent on the amount of blood pumped by the heart per minute and the resistance to blood flow through the arterioles. This is called systolic pressure. The pressure that remains in the blood vessels when the heart is at rest is called diastolic pressure. The sphygmomanometer consists of an inflatable cuff connected by rubber hoses to a pump and to a pressure gauge (graduated in millimeters of mercury). The cuff is wrapped around the upper arm and inflated to a pressure that shuts off blood flow to the artery in the arm. Normal systolic blood pressure at rest is less than 120 mm Hg; normal diastolic blood pressure is less than 80 mm Hg. Table 1. Normal blood pressure for males and females of different ages age (years) systolic diastolic male female male female 13 108 108 72 73 14 110 110 73 74 15 112 112 75 76 16 118 116 73 72 Think about it… then research it… What does a blood pressure lower than normal tell a physician? What might it indicate for the patient? What does a blood pressure higher than normal tell a physician? What might it indicate for the patient? 3
- 4. Figure 1. Measurement of blood pressure (from Biology, Campbell, 1996) Lab Activities: Have one partner play the role of subject throughout the entire activity, then switch roles and have the examiner be the subject. Record your data in the data table below and later on the teacher’s computer in class. Spend 5 minutes per station and do not move onto the next station until you are instructed. The data will be available on Blackboard after lab for you to use to complete the homework. Data table Subject M/F Age Temperature Resting Mean resting Resting Resting (°F) breathing heart rate systolic diastolic rate (BPM) pressure pressure (mm (Br/min.) (mm Hg) Hg) Once all the data are available, find the average and standard deviation for each data set. Incidentally, in Excel, the formula for average is =average() and the formula for standard deviation is =stdev(), where the range of the appropriate data is inside the parentheses. Recall that about 2/3 of a normally distributed data set lies within 1 standard deviation of the mean, and that a normal distribution (bell curve) has symmetric variance around the mean and the contributing data decrease in frequency as distance from the mean increases (see figure on p. 1). 1. Connect the Blood Pressure Sensor to Channel 1 of the Vernier computer interface. 4 Figure 2
- 5. 2. Open the file “10b Heart Rate and BP” from the Human Physiology with Vernier folder if it is not already open on your laptop. 3. Attach the Blood Pressure cuff firmly around the upper left arm, approximately 2 cm above the elbow. The two rubber hoses from the cuff should be positioned over the biceps muscle (brachial artery) and not under the arm (see Figure 2). 4. Have the subject sit quietly in a chair with forearms resting on his/her lap, or on a table surface. The person having his or her blood pressure measured must remain still during data collection; there should be no movement of the arm or hand during measurements. 5. With the subject sitting quietly, click to begin data collection. a. At 40 seconds, pump the bulb pump of the Blood Pressure Sensor until the cuff pressure reaches at least 160 mm Hg. Stop pumping. b. As data collection continues, the cuff will slowly deflate and the pressure will fall. During this time, the systolic, diastolic, and mean arterial pressures will be calculated by the software. When the cuff pressure drops below 50 mm Hg, the program will stop calculating blood pressure. 6. Enter the systolic and diastolic pressures in the data table. 7. a. Connect the receiver of the Heart Rate Monitor to Channel 1 (removing the Blood Pressure sensor). The Heart Rate receiver and one of the handles are marked with a white alignment arrow as shown in Figure 3. Locate these two arrows. b. Have the subject grasp the handles of the Hand-Grip Heart Rate Monitor so that their fingers are in the reference areas indicated in Figure 3 Figure 4 Figure 4. Hold the handles vertically. c. Have someone else hold the receiver near the handles so that the two alignment arrows are pointing in the same direction and are at approximately the same height as shown in Figure 3. Note: The receiver must stay within 60 cm of the handles during data collection. d. With the subject sitting quietly, click to begin data collection. The subject should remain seated and allow data collection to continue for the full 40 s data-collection period. 8. Click and drag over the area of the heart rate graph where the resting (“baseline”) heart rate is displayed (15–40 s). Click the Statistics button, . The Statistics box will appear with the statistics calculated for the selected region. Record the mean resting heart rate, to the nearest whole number, in the data table. Data 1 To make the histograms for homework- divide the data into 7 1 7 equally-sized categories. For example, if your data spanned 2 6 a range from 3 to 333, your categories might be 0-49, 50-99, 2 frequency 100-149, 150-199, 200-249, 250-299, 300-349. The height of 5 3 the bar for each category reflects the number of data points in 4 3 that category (the frequency). For example, the following 3 4 data set (far right) can be shown in the histogram to the right. 2 4 1 4 0 4 1-2 3-4 5-6 5 6 categories 6 5
- 6. 6
- 7. Lab follow-up homework Name _______________________________________ 1. Use the axes (A) to the right to show a histogram of temperature for the group. 2. Write the mean and standard deviation of the temperature data as x ± SD here. ________________ 3. Use the axes (B) to the right to show a histogram of breathing rate for the group. 4. Write the mean and standard deviation of the breathing rate data as x ± SD here. ________________ 5. Use the axes (C) to the right to show a histogram of heart rate for the group. A 6. Write the mean and standard deviation of the heart rate data as x ± SD here. ________________ 7. Use the axes (D) to the right to show a histogram of systolic pressure for the group. 8. Write the mean and standard deviation of the systolic pressure data as x ± SD here. ________________ 9. Use the axes (E) to the right to show a histogram of diastolic pressure data for the group. 10. Write the mean and standard deviation of the diastolic pressure data as x ± SD here. ________________ 11. Which data set shows the greatest variation around the mean? What is the significance of a data set having large variance around the mean? How does the histogram help you visualize high variance? B 12. Which data set shows the smallest variation around the mean? What is the significance of a data set having small variance around the mean? How does the histogram help you visualize low variance? C 7
- 8. D E 13. List one source of natural variability for each data set and explain how it could have affected the data. Temperature Breathing rate Heart rate Blood pressure 14. List one source of experimental variability for each data set and explain how it could have affected the data. Temperature Breathing rate Heart rate Blood pressure 8