SlideShare ist ein Scribd-Unternehmen logo
1 von 4
Downloaden Sie, um offline zu lesen
Massachusetts Institute of Technology
Leaders for Manufacturing Program
Use of a Queueing Model to Design a Lean System
Prepared as a basis for class discussion by Jamie Flinchbaugh1
.
Toyota has evolved the design of their vehicle assembly plants for 50 years.
Much of the work coincided with the development of the Toyota Production System2
and
has evolved through periods of trial and error. In this case, with the corresponding model
found in lean_factory.xls, you have the opportunity to use a queueing model to explore
the relationship that Toyota discovered when developing the Toyota Production System.
A brief explanation of the factory dynamics
In a factory using the andon process3
, buffers are used to create independence
among departments attempting to push decision making further down in the hierarchy
and create mini-companies within the factory. This is attained by physically promoting
significantly more independent departments or line segments than a traditional assembly
plant would have, as depicted in
the figure. A line segment may
consist of somewhere between 20-
40 workstations. Separating each
line segment is an accumulating
buffer that can hold several work
cycles of product. The buffers
allow each of the teams to make
decisions regarding stopping the
line to fix problems. The buffers
also increase the independence in
operating metrics. These buffers
seem to violate the principle that
inventory is waste and should be
eliminated; instead these buffers
de-couple one line segment from another, and thus prevent downtime at one segment
from shutting down downstream segments on account of no inventory.
1
Jamie Flinchbaugh is a Fellow in the Leaders for Manufacturing Program, Class of 1998, and is sponsored
by Chrysler Corporation. This case is extracted from Implementing Lean Manufacturing Through Factory Design,
an MIT Thesis by Jamie Flinchbaugh, 1998.
2
This case requires a working knowledge of the Toyota Production System. An adequate understanding
can be reached by reviewing Harvard Business School case study Toyota Motor Manufacturing, U.S.A.,
Inc. (case number 9-693-019, September 5, 1995, prepared by Kazuhiro Mishina).
3
The andon process: each line worker can signal for help from the team leader if there is a quality problem.
The team leader makes a decision on whether or not to stop the line, but if at all possible, will make sure
that the quality problem is fixed before leaving the workstation. This results in problem solving closer to
the problem and very little rework, resulting in a better quality product.
As far as managing the line, one group leader leads the team in each line segment.
Under the group leader may be three or four team leaders who support teams of 6-10
team members. Both team members and the team leader are union jobs. The group
leader has much more broad responsibility than in a traditional assembly plant, to the
extent that they act as the president of a mini-company, with the upstream line segment as
the supplier and the downstream line segment as the customer.
What about the factory designer?
The factory designer must relate this operational understanding into the physical
design parameters of a factory. The designer must balance investment cost decisions
with the operating performance of the factory such as cost, quality, and throughput. You,
as factory designer, must be concerned with the relationships between the operation of
the andon system (fix quality in-station) and throughput losses.
If a series of processes or workstations have equal capacity, but their production
varies (either within cycle times or through downtime), the output will never equal
capacity. Said another way, the system’s realized capacity, or system throughput, will
always be lower than the capacity of the process with the minimum stand-alone capacity.
In order to get the desired capacity, there are three compensating techniques that can be
used independently or in combination:
Reduce processing variation
Provide excess capacity so that realized throughput equals customer
demand
Provide decoupling buffers between processes to reduce the impact
adjacent processes have on each other
Each of these solutions has other factors or trade-offs to consider. Providing
buffers increases system lead-time, which in turn increases work-in-process inventory,
hurts problem solving capabilities, and allows more opportunities for in-system damage.
Providing excess capacity could be restated as allowing for lower plant efficiency.
Excess capacity is costly both to investment and variable costs. Reducing processing
variation, which would mean both variance within cycle times and improving equipment
uptime, is perhaps the least costly, but requires significant and specific skills within the
organization. Although Toyota uses all three solution points to some degree, reducing
processing variation is their primary focus.
The three compensating techniques are not a complete factory design, but they do
compose the strategic factory design. While these design factors exist for any factory, we
need to relate them to the design of a vehicle assembly plant. Achieving strategic goals
relating to variation, capacity, and buffers will be achieved through management of the
physical design features described in the following table.
Table of design features
Physical design parameters What they represent Base case values
Number of line segments
The total number of workstations is
broken up into line segments. The size
of the line segments is determined by
how many pieces the total is broken up
into, which is the number of buffers
plus one.
This value does not show up
explicitly in the model. It is
represented in the length of the line
segments. It should be considered,
however, because each new line
segment represents significant cost.
The base case represented six line
segments.
Length of line segments (or
# stations / segment)
The length of the line segments is the
total number of workstations, typically
250-500 for an assembly plant, divided
by the number of line segments.
We settled on a value of 33, which is
in the ballpark of Toyota’s factories.
If there were no buffers, i.e. a
traditional assembly plant, this value
would reach 200-500.
Size of buffers (or
accumulator size)
The size of the buffers represents how
many vehicles can be held in each
buffer between line segments.
We settled on a value of 15. Buffer
size drives conveyor length and
sometimes floor space, requiring
investment dollars.
Plant uptime (or
P[downstream segment
starved])
This represents the percent of available
time to produce final product. The
factory only loses final product when
the last downstream segment is
starved. No factory has 100 percent
uptime. The realized capacity, which
must meet customer demand, is the
plant uptime times the segment’s
minimum theoretical capacity process.
This is an output of the math model.
It is the primary performance metric
to evaluate the overall design. We
settled on a probability of starvation
of 8 percent, which can be restated
as 92 percent uptime.
Percent over-speed If the upstream line segment runs at a
faster pace than the downstream
segment, it can partially make up for
lost production from downtime.
The model includes the takt time4
of
both the upstream and downstream
line segments. Our values are 103
seconds for the downstream
segment, and 100 seconds for the
upstream segment, which results in a
percent over-speed of 3 percent.
Shift structure The plant can run with one, two, or
three shifts per day. Few assembly
plants run with one, but one or two
shifts represents windows of
opportunity to run overtime, reset
buffers, or do preventive maintenance.
A three-shift policy runs shifts back-
to-back not allowing for these
activities.
We settled on a two-shift policy,
followed by Toyota, which allows
for the possibilities stated at left.
What happens to uptime if these
activities are hampered?
Variation (or E[# cycles
before failure])
This value represents the number of
expected completed jobs before an
andon signal results in a line stop.
Based on data from Toyota5
, we
settled on a value of 550. Is it fair to
use Toyota’s quality data for another
automotive producer?
4
Takt time is a term used by Toyota that is consistent, but not equal to, cycle time. The true definition of
takt time is the available minutes of production in a day divided by the daily customer demand. Here the
value substituted is more represented by the pace of the conveyor (or the available time per workstation),
which can be set independently for each line segment.
5
Mishina, Kazuhiro. Toyota Motor Manufacturing, U.S.A., Inc. Harvard Business School case # 9-693-
019, September 5, 1995.
Instructions for class
1) Open the Excel 97 spreadsheet titled lean_factory.xls that contains the model.
2) Using the shaded cells in the sheet Results Page, examine the relationship between
factory performance and the following parameters:
a) Line segment length (vary # stations per segment for both segments)
b) Percent over-speed (vary the upstream takt time)
c) Reduce process variation (vary the E[# cycles before failure] for both segments)
Note – the spreadsheet permits you to change other parameters: the probability the
upstream segment is starved (currently at 0.07); the mean time to repair (MTTR) for both
segments; the hours per shift. You should leave these as is.
3) Use the Tradeoff Curves sheet to determine the correct buffer size for each solution
set. Maintaining the downstream segment takt time at 103 seconds and shifts at 2/day
and 8 hours / shift, the factory’s throughput (or E[# finished cars/day]) must meet
demand of 480 vehicles.
Questions for reflection
The following set of questions is not to be answered for class. However, to give you
a feel for the kinds of questions that a person who is implementing this model must
address, we have included several of the key questions that the design team had to think
about.
1) What seems a reasonable design solution for the factory?
2) Where does the role of variation reduction fit into the model? Can this be considered
an input to the design? What must be in place to change this parameter?
3) What are the limitations of the model? What assumptions are included?
4) How would you manage an understanding of the investment costs when using this
model?
5) How can we communicate our insights generated from using the model to others both
inside and outside manufacturing?

Weitere ähnliche Inhalte

Was ist angesagt?

Cad lecture-5
Cad lecture-5Cad lecture-5
Cad lecture-527273737
 
Project On Facility Layout
Project On Facility LayoutProject On Facility Layout
Project On Facility LayoutMOHD ARISH
 
Group Technology
Group TechnologyGroup Technology
Group TechnologyAamir Ali
 
Redesigning of Manufacturing Layout for Performance Improvements Using VIP Pl...
Redesigning of Manufacturing Layout for Performance Improvements Using VIP Pl...Redesigning of Manufacturing Layout for Performance Improvements Using VIP Pl...
Redesigning of Manufacturing Layout for Performance Improvements Using VIP Pl...IJESM JOURNAL
 
Group technology
Group technologyGroup technology
Group technologyjntuhcej
 
Group technology, Production flow Analysis
Group technology, Production flow AnalysisGroup technology, Production flow Analysis
Group technology, Production flow AnalysisKEERTHIVASAN RAVI
 
Layout
LayoutLayout
LayoutFNian
 
Group Technology (Cell Manufacturing)
Group Technology (Cell Manufacturing)Group Technology (Cell Manufacturing)
Group Technology (Cell Manufacturing)Aishwary Kumar Gupta
 
Value stream mapping using simulation with ARENA
Value stream mapping using simulation with ARENAValue stream mapping using simulation with ARENA
Value stream mapping using simulation with ARENAhrishik26
 
Layout strategy ppt @ bec doms
Layout strategy ppt @ bec domsLayout strategy ppt @ bec doms
Layout strategy ppt @ bec domsBabasab Patil
 

Was ist angesagt? (10)

Cad lecture-5
Cad lecture-5Cad lecture-5
Cad lecture-5
 
Project On Facility Layout
Project On Facility LayoutProject On Facility Layout
Project On Facility Layout
 
Group Technology
Group TechnologyGroup Technology
Group Technology
 
Redesigning of Manufacturing Layout for Performance Improvements Using VIP Pl...
Redesigning of Manufacturing Layout for Performance Improvements Using VIP Pl...Redesigning of Manufacturing Layout for Performance Improvements Using VIP Pl...
Redesigning of Manufacturing Layout for Performance Improvements Using VIP Pl...
 
Group technology
Group technologyGroup technology
Group technology
 
Group technology, Production flow Analysis
Group technology, Production flow AnalysisGroup technology, Production flow Analysis
Group technology, Production flow Analysis
 
Layout
LayoutLayout
Layout
 
Group Technology (Cell Manufacturing)
Group Technology (Cell Manufacturing)Group Technology (Cell Manufacturing)
Group Technology (Cell Manufacturing)
 
Value stream mapping using simulation with ARENA
Value stream mapping using simulation with ARENAValue stream mapping using simulation with ARENA
Value stream mapping using simulation with ARENA
 
Layout strategy ppt @ bec doms
Layout strategy ppt @ bec domsLayout strategy ppt @ bec doms
Layout strategy ppt @ bec doms
 

Andere mochten auch

Workshop für Freiwilligenagenturen
Workshop für Freiwilligenagenturen Workshop für Freiwilligenagenturen
Workshop für Freiwilligenagenturen KaP
 
ಉಪಕಾರಗಲ್ಲನ್ನು ಆಡಿಕೊಳ್ಳುವವನು
ಉಪಕಾರಗಲ್ಲನ್ನು ಆಡಿಕೊಳ್ಳುವವನುಉಪಕಾರಗಲ್ಲನ್ನು ಆಡಿಕೊಳ್ಳುವವನು
ಉಪಕಾರಗಲ್ಲನ್ನು ಆಡಿಕೊಳ್ಳುವವನುFAHIM AKTHAR ULLAL
 
Using Commercial Electric Vehicles for Vehicle-to-Grid
Using Commercial Electric Vehicles for Vehicle-to-GridUsing Commercial Electric Vehicles for Vehicle-to-Grid
Using Commercial Electric Vehicles for Vehicle-to-GridCALSTART
 
Horario e tabela de preços pedra de itaúna
Horario e tabela de preços pedra de itaúnaHorario e tabela de preços pedra de itaúna
Horario e tabela de preços pedra de itaúnaDouglas Nery
 
Transformadores de media
Transformadores de mediaTransformadores de media
Transformadores de medialuismairymmq
 

Andere mochten auch (6)

Workshop für Freiwilligenagenturen
Workshop für Freiwilligenagenturen Workshop für Freiwilligenagenturen
Workshop für Freiwilligenagenturen
 
ಉಪಕಾರಗಲ್ಲನ್ನು ಆಡಿಕೊಳ್ಳುವವನು
ಉಪಕಾರಗಲ್ಲನ್ನು ಆಡಿಕೊಳ್ಳುವವನುಉಪಕಾರಗಲ್ಲನ್ನು ಆಡಿಕೊಳ್ಳುವವನು
ಉಪಕಾರಗಲ್ಲನ್ನು ಆಡಿಕೊಳ್ಳುವವನು
 
Using Commercial Electric Vehicles for Vehicle-to-Grid
Using Commercial Electric Vehicles for Vehicle-to-GridUsing Commercial Electric Vehicles for Vehicle-to-Grid
Using Commercial Electric Vehicles for Vehicle-to-Grid
 
Horario e tabela de preços pedra de itaúna
Horario e tabela de preços pedra de itaúnaHorario e tabela de preços pedra de itaúna
Horario e tabela de preços pedra de itaúna
 
Transformadores de media
Transformadores de mediaTransformadores de media
Transformadores de media
 
Setup guide nos-v3_5
Setup guide nos-v3_5Setup guide nos-v3_5
Setup guide nos-v3_5
 

Ähnlich wie Design lean sysm

Operation & material management-line balancing & capacity planning decision
Operation & material management-line balancing & capacity planning decisionOperation & material management-line balancing & capacity planning decision
Operation & material management-line balancing & capacity planning decisionRohit Raina
 
Production-line balancing & capacity planning decision
Production-line balancing & capacity planning decisionProduction-line balancing & capacity planning decision
Production-line balancing & capacity planning decisionRohit Raina
 
Capacity planning
Capacity planningCapacity planning
Capacity planningRatan479
 
CAD CAM 1 Module-3 Part-A 18ME72
CAD CAM  1 Module-3 Part-A 18ME72CAD CAM  1 Module-3 Part-A 18ME72
CAD CAM 1 Module-3 Part-A 18ME72Mohammed Imran
 
Project_Overview_ecopy
Project_Overview_ecopyProject_Overview_ecopy
Project_Overview_ecopyDavid Beck
 
IRJET- Basic Study of Assembly Line Balancing
IRJET- Basic Study of Assembly Line BalancingIRJET- Basic Study of Assembly Line Balancing
IRJET- Basic Study of Assembly Line BalancingIRJET Journal
 
Opportunity Assessment and Advanced Control
Opportunity Assessment and Advanced ControlOpportunity Assessment and Advanced Control
Opportunity Assessment and Advanced ControlJim Cahill
 
Guidelines to Understanding to estimate MTBF
Guidelines to Understanding to estimate MTBFGuidelines to Understanding to estimate MTBF
Guidelines to Understanding to estimate MTBFijsrd.com
 
Design and Analysis of Chute System to obtain World Class OEE
Design and Analysis of Chute System to obtain World Class OEEDesign and Analysis of Chute System to obtain World Class OEE
Design and Analysis of Chute System to obtain World Class OEEijsrd.com
 
Fms literature review
Fms literature reviewFms literature review
Fms literature reviewdhandeesh
 
Fuel efficiency in construction equipment – optimize the machine as one system
Fuel efficiency in construction equipment – optimize the machine as one systemFuel efficiency in construction equipment – optimize the machine as one system
Fuel efficiency in construction equipment – optimize the machine as one systemReno Filla
 
Preliminary Study of an Assembling Plant
Preliminary Study of an Assembling Plant Preliminary Study of an Assembling Plant
Preliminary Study of an Assembling Plant MustafaElAkkad
 
Driving semiconductor-manufacturing-business-performance-through-analytics (1)
Driving semiconductor-manufacturing-business-performance-through-analytics (1)Driving semiconductor-manufacturing-business-performance-through-analytics (1)
Driving semiconductor-manufacturing-business-performance-through-analytics (1)Suneetha Mathukumalli
 

Ähnlich wie Design lean sysm (20)

Operation & material management-line balancing & capacity planning decision
Operation & material management-line balancing & capacity planning decisionOperation & material management-line balancing & capacity planning decision
Operation & material management-line balancing & capacity planning decision
 
Production-line balancing & capacity planning decision
Production-line balancing & capacity planning decisionProduction-line balancing & capacity planning decision
Production-line balancing & capacity planning decision
 
Cellular manufacturing
Cellular manufacturingCellular manufacturing
Cellular manufacturing
 
Capacity planning
Capacity planningCapacity planning
Capacity planning
 
455566
455566455566
455566
 
Flexible Manufacturing System Design
Flexible Manufacturing System DesignFlexible Manufacturing System Design
Flexible Manufacturing System Design
 
O0123190100
O0123190100O0123190100
O0123190100
 
CAD CAM 1 Module-3 Part-A 18ME72
CAD CAM  1 Module-3 Part-A 18ME72CAD CAM  1 Module-3 Part-A 18ME72
CAD CAM 1 Module-3 Part-A 18ME72
 
Project_Overview_ecopy
Project_Overview_ecopyProject_Overview_ecopy
Project_Overview_ecopy
 
IRJET- Basic Study of Assembly Line Balancing
IRJET- Basic Study of Assembly Line BalancingIRJET- Basic Study of Assembly Line Balancing
IRJET- Basic Study of Assembly Line Balancing
 
Opportunity Assessment and Advanced Control
Opportunity Assessment and Advanced ControlOpportunity Assessment and Advanced Control
Opportunity Assessment and Advanced Control
 
Guidelines to Understanding to estimate MTBF
Guidelines to Understanding to estimate MTBFGuidelines to Understanding to estimate MTBF
Guidelines to Understanding to estimate MTBF
 
Unit6 55
Unit6 55Unit6 55
Unit6 55
 
Types of manufacturing_systems
Types of manufacturing_systemsTypes of manufacturing_systems
Types of manufacturing_systems
 
Design and Analysis of Chute System to obtain World Class OEE
Design and Analysis of Chute System to obtain World Class OEEDesign and Analysis of Chute System to obtain World Class OEE
Design and Analysis of Chute System to obtain World Class OEE
 
Fms literature review
Fms literature reviewFms literature review
Fms literature review
 
Fuel efficiency in construction equipment – optimize the machine as one system
Fuel efficiency in construction equipment – optimize the machine as one systemFuel efficiency in construction equipment – optimize the machine as one system
Fuel efficiency in construction equipment – optimize the machine as one system
 
Job shop
Job shopJob shop
Job shop
 
Preliminary Study of an Assembling Plant
Preliminary Study of an Assembling Plant Preliminary Study of an Assembling Plant
Preliminary Study of an Assembling Plant
 
Driving semiconductor-manufacturing-business-performance-through-analytics (1)
Driving semiconductor-manufacturing-business-performance-through-analytics (1)Driving semiconductor-manufacturing-business-performance-through-analytics (1)
Driving semiconductor-manufacturing-business-performance-through-analytics (1)
 

Mehr von Luciano Marcelo Oliveira (13)

Mec
MecMec
Mec
 
Tabelas termo 07
Tabelas termo 07Tabelas termo 07
Tabelas termo 07
 
A1 a2 manual-compresores-sabroe_smc_104-106-10_mk3 (1)
A1 a2 manual-compresores-sabroe_smc_104-106-10_mk3 (1)A1 a2 manual-compresores-sabroe_smc_104-106-10_mk3 (1)
A1 a2 manual-compresores-sabroe_smc_104-106-10_mk3 (1)
 
E flexao pura
E   flexao puraE   flexao pura
E flexao pura
 
NR 12
NR 12NR 12
NR 12
 
Rula
RulaRula
Rula
 
Artigo niosh
Artigo nioshArtigo niosh
Artigo niosh
 
Tipos e aplicação caldeiras petrobras
Tipos e aplicação caldeiras   petrobrasTipos e aplicação caldeiras   petrobras
Tipos e aplicação caldeiras petrobras
 
Caldeira
CaldeiraCaldeira
Caldeira
 
Aula caldeiras (nr13)
Aula caldeiras (nr13)Aula caldeiras (nr13)
Aula caldeiras (nr13)
 
Aula de Caldeiras
Aula de CaldeirasAula de Caldeiras
Aula de Caldeiras
 
Apresentação nr13-senai-rev.00
Apresentação nr13-senai-rev.00Apresentação nr13-senai-rev.00
Apresentação nr13-senai-rev.00
 
Parada programada
Parada programadaParada programada
Parada programada
 

Kürzlich hochgeladen

computer application and construction management
computer application and construction managementcomputer application and construction management
computer application and construction managementMariconPadriquez1
 
Vishratwadi & Ghorpadi Bridge Tender documents
Vishratwadi & Ghorpadi Bridge Tender documentsVishratwadi & Ghorpadi Bridge Tender documents
Vishratwadi & Ghorpadi Bridge Tender documentsSachinPawar510423
 
IVE Industry Focused Event - Defence Sector 2024
IVE Industry Focused Event - Defence Sector 2024IVE Industry Focused Event - Defence Sector 2024
IVE Industry Focused Event - Defence Sector 2024Mark Billinghurst
 
Class 1 | NFPA 72 | Overview Fire Alarm System
Class 1 | NFPA 72 | Overview Fire Alarm SystemClass 1 | NFPA 72 | Overview Fire Alarm System
Class 1 | NFPA 72 | Overview Fire Alarm Systemirfanmechengr
 
Indian Dairy Industry Present Status and.ppt
Indian Dairy Industry Present Status and.pptIndian Dairy Industry Present Status and.ppt
Indian Dairy Industry Present Status and.pptMadan Karki
 
Study on Air-Water & Water-Water Heat Exchange in a Finned Tube Exchanger
Study on Air-Water & Water-Water Heat Exchange in a Finned Tube ExchangerStudy on Air-Water & Water-Water Heat Exchange in a Finned Tube Exchanger
Study on Air-Water & Water-Water Heat Exchange in a Finned Tube ExchangerAnamika Sarkar
 
TechTAC® CFD Report Summary: A Comparison of Two Types of Tubing Anchor Catchers
TechTAC® CFD Report Summary: A Comparison of Two Types of Tubing Anchor CatchersTechTAC® CFD Report Summary: A Comparison of Two Types of Tubing Anchor Catchers
TechTAC® CFD Report Summary: A Comparison of Two Types of Tubing Anchor Catcherssdickerson1
 
Call Us ≽ 8377877756 ≼ Call Girls In Shastri Nagar (Delhi)
Call Us ≽ 8377877756 ≼ Call Girls In Shastri Nagar (Delhi)Call Us ≽ 8377877756 ≼ Call Girls In Shastri Nagar (Delhi)
Call Us ≽ 8377877756 ≼ Call Girls In Shastri Nagar (Delhi)dollysharma2066
 
lifi-technology with integration of IOT.pptx
lifi-technology with integration of IOT.pptxlifi-technology with integration of IOT.pptx
lifi-technology with integration of IOT.pptxsomshekarkn64
 
Call Girls Delhi {Jodhpur} 9711199012 high profile service
Call Girls Delhi {Jodhpur} 9711199012 high profile serviceCall Girls Delhi {Jodhpur} 9711199012 high profile service
Call Girls Delhi {Jodhpur} 9711199012 high profile servicerehmti665
 
CCS355 Neural Network & Deep Learning UNIT III notes and Question bank .pdf
CCS355 Neural Network & Deep Learning UNIT III notes and Question bank .pdfCCS355 Neural Network & Deep Learning UNIT III notes and Question bank .pdf
CCS355 Neural Network & Deep Learning UNIT III notes and Question bank .pdfAsst.prof M.Gokilavani
 
Transport layer issues and challenges - Guide
Transport layer issues and challenges - GuideTransport layer issues and challenges - Guide
Transport layer issues and challenges - GuideGOPINATHS437943
 
Work Experience-Dalton Park.pptxfvvvvvvv
Work Experience-Dalton Park.pptxfvvvvvvvWork Experience-Dalton Park.pptxfvvvvvvv
Work Experience-Dalton Park.pptxfvvvvvvvLewisJB
 
8251 universal synchronous asynchronous receiver transmitter
8251 universal synchronous asynchronous receiver transmitter8251 universal synchronous asynchronous receiver transmitter
8251 universal synchronous asynchronous receiver transmitterShivangiSharma879191
 
Call Girls Narol 7397865700 Independent Call Girls
Call Girls Narol 7397865700 Independent Call GirlsCall Girls Narol 7397865700 Independent Call Girls
Call Girls Narol 7397865700 Independent Call Girlsssuser7cb4ff
 
Solving The Right Triangles PowerPoint 2.ppt
Solving The Right Triangles PowerPoint 2.pptSolving The Right Triangles PowerPoint 2.ppt
Solving The Right Triangles PowerPoint 2.pptJasonTagapanGulla
 
Oxy acetylene welding presentation note.
Oxy acetylene welding presentation note.Oxy acetylene welding presentation note.
Oxy acetylene welding presentation note.eptoze12
 

Kürzlich hochgeladen (20)

Exploring_Network_Security_with_JA3_by_Rakesh Seal.pptx
Exploring_Network_Security_with_JA3_by_Rakesh Seal.pptxExploring_Network_Security_with_JA3_by_Rakesh Seal.pptx
Exploring_Network_Security_with_JA3_by_Rakesh Seal.pptx
 
computer application and construction management
computer application and construction managementcomputer application and construction management
computer application and construction management
 
Vishratwadi & Ghorpadi Bridge Tender documents
Vishratwadi & Ghorpadi Bridge Tender documentsVishratwadi & Ghorpadi Bridge Tender documents
Vishratwadi & Ghorpadi Bridge Tender documents
 
IVE Industry Focused Event - Defence Sector 2024
IVE Industry Focused Event - Defence Sector 2024IVE Industry Focused Event - Defence Sector 2024
IVE Industry Focused Event - Defence Sector 2024
 
Class 1 | NFPA 72 | Overview Fire Alarm System
Class 1 | NFPA 72 | Overview Fire Alarm SystemClass 1 | NFPA 72 | Overview Fire Alarm System
Class 1 | NFPA 72 | Overview Fire Alarm System
 
Indian Dairy Industry Present Status and.ppt
Indian Dairy Industry Present Status and.pptIndian Dairy Industry Present Status and.ppt
Indian Dairy Industry Present Status and.ppt
 
Study on Air-Water & Water-Water Heat Exchange in a Finned Tube Exchanger
Study on Air-Water & Water-Water Heat Exchange in a Finned Tube ExchangerStudy on Air-Water & Water-Water Heat Exchange in a Finned Tube Exchanger
Study on Air-Water & Water-Water Heat Exchange in a Finned Tube Exchanger
 
TechTAC® CFD Report Summary: A Comparison of Two Types of Tubing Anchor Catchers
TechTAC® CFD Report Summary: A Comparison of Two Types of Tubing Anchor CatchersTechTAC® CFD Report Summary: A Comparison of Two Types of Tubing Anchor Catchers
TechTAC® CFD Report Summary: A Comparison of Two Types of Tubing Anchor Catchers
 
Call Us ≽ 8377877756 ≼ Call Girls In Shastri Nagar (Delhi)
Call Us ≽ 8377877756 ≼ Call Girls In Shastri Nagar (Delhi)Call Us ≽ 8377877756 ≼ Call Girls In Shastri Nagar (Delhi)
Call Us ≽ 8377877756 ≼ Call Girls In Shastri Nagar (Delhi)
 
lifi-technology with integration of IOT.pptx
lifi-technology with integration of IOT.pptxlifi-technology with integration of IOT.pptx
lifi-technology with integration of IOT.pptx
 
Call Girls Delhi {Jodhpur} 9711199012 high profile service
Call Girls Delhi {Jodhpur} 9711199012 high profile serviceCall Girls Delhi {Jodhpur} 9711199012 high profile service
Call Girls Delhi {Jodhpur} 9711199012 high profile service
 
CCS355 Neural Network & Deep Learning UNIT III notes and Question bank .pdf
CCS355 Neural Network & Deep Learning UNIT III notes and Question bank .pdfCCS355 Neural Network & Deep Learning UNIT III notes and Question bank .pdf
CCS355 Neural Network & Deep Learning UNIT III notes and Question bank .pdf
 
Transport layer issues and challenges - Guide
Transport layer issues and challenges - GuideTransport layer issues and challenges - Guide
Transport layer issues and challenges - Guide
 
Work Experience-Dalton Park.pptxfvvvvvvv
Work Experience-Dalton Park.pptxfvvvvvvvWork Experience-Dalton Park.pptxfvvvvvvv
Work Experience-Dalton Park.pptxfvvvvvvv
 
8251 universal synchronous asynchronous receiver transmitter
8251 universal synchronous asynchronous receiver transmitter8251 universal synchronous asynchronous receiver transmitter
8251 universal synchronous asynchronous receiver transmitter
 
POWER SYSTEMS-1 Complete notes examples
POWER SYSTEMS-1 Complete notes  examplesPOWER SYSTEMS-1 Complete notes  examples
POWER SYSTEMS-1 Complete notes examples
 
young call girls in Green Park🔝 9953056974 🔝 escort Service
young call girls in Green Park🔝 9953056974 🔝 escort Serviceyoung call girls in Green Park🔝 9953056974 🔝 escort Service
young call girls in Green Park🔝 9953056974 🔝 escort Service
 
Call Girls Narol 7397865700 Independent Call Girls
Call Girls Narol 7397865700 Independent Call GirlsCall Girls Narol 7397865700 Independent Call Girls
Call Girls Narol 7397865700 Independent Call Girls
 
Solving The Right Triangles PowerPoint 2.ppt
Solving The Right Triangles PowerPoint 2.pptSolving The Right Triangles PowerPoint 2.ppt
Solving The Right Triangles PowerPoint 2.ppt
 
Oxy acetylene welding presentation note.
Oxy acetylene welding presentation note.Oxy acetylene welding presentation note.
Oxy acetylene welding presentation note.
 

Design lean sysm

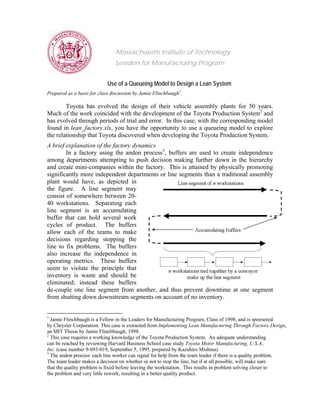
  • 1. Massachusetts Institute of Technology Leaders for Manufacturing Program Use of a Queueing Model to Design a Lean System Prepared as a basis for class discussion by Jamie Flinchbaugh1 . Toyota has evolved the design of their vehicle assembly plants for 50 years. Much of the work coincided with the development of the Toyota Production System2 and has evolved through periods of trial and error. In this case, with the corresponding model found in lean_factory.xls, you have the opportunity to use a queueing model to explore the relationship that Toyota discovered when developing the Toyota Production System. A brief explanation of the factory dynamics In a factory using the andon process3 , buffers are used to create independence among departments attempting to push decision making further down in the hierarchy and create mini-companies within the factory. This is attained by physically promoting significantly more independent departments or line segments than a traditional assembly plant would have, as depicted in the figure. A line segment may consist of somewhere between 20- 40 workstations. Separating each line segment is an accumulating buffer that can hold several work cycles of product. The buffers allow each of the teams to make decisions regarding stopping the line to fix problems. The buffers also increase the independence in operating metrics. These buffers seem to violate the principle that inventory is waste and should be eliminated; instead these buffers de-couple one line segment from another, and thus prevent downtime at one segment from shutting down downstream segments on account of no inventory. 1 Jamie Flinchbaugh is a Fellow in the Leaders for Manufacturing Program, Class of 1998, and is sponsored by Chrysler Corporation. This case is extracted from Implementing Lean Manufacturing Through Factory Design, an MIT Thesis by Jamie Flinchbaugh, 1998. 2 This case requires a working knowledge of the Toyota Production System. An adequate understanding can be reached by reviewing Harvard Business School case study Toyota Motor Manufacturing, U.S.A., Inc. (case number 9-693-019, September 5, 1995, prepared by Kazuhiro Mishina). 3 The andon process: each line worker can signal for help from the team leader if there is a quality problem. The team leader makes a decision on whether or not to stop the line, but if at all possible, will make sure that the quality problem is fixed before leaving the workstation. This results in problem solving closer to the problem and very little rework, resulting in a better quality product.
  • 2. As far as managing the line, one group leader leads the team in each line segment. Under the group leader may be three or four team leaders who support teams of 6-10 team members. Both team members and the team leader are union jobs. The group leader has much more broad responsibility than in a traditional assembly plant, to the extent that they act as the president of a mini-company, with the upstream line segment as the supplier and the downstream line segment as the customer. What about the factory designer? The factory designer must relate this operational understanding into the physical design parameters of a factory. The designer must balance investment cost decisions with the operating performance of the factory such as cost, quality, and throughput. You, as factory designer, must be concerned with the relationships between the operation of the andon system (fix quality in-station) and throughput losses. If a series of processes or workstations have equal capacity, but their production varies (either within cycle times or through downtime), the output will never equal capacity. Said another way, the system’s realized capacity, or system throughput, will always be lower than the capacity of the process with the minimum stand-alone capacity. In order to get the desired capacity, there are three compensating techniques that can be used independently or in combination: Reduce processing variation Provide excess capacity so that realized throughput equals customer demand Provide decoupling buffers between processes to reduce the impact adjacent processes have on each other Each of these solutions has other factors or trade-offs to consider. Providing buffers increases system lead-time, which in turn increases work-in-process inventory, hurts problem solving capabilities, and allows more opportunities for in-system damage. Providing excess capacity could be restated as allowing for lower plant efficiency. Excess capacity is costly both to investment and variable costs. Reducing processing variation, which would mean both variance within cycle times and improving equipment uptime, is perhaps the least costly, but requires significant and specific skills within the organization. Although Toyota uses all three solution points to some degree, reducing processing variation is their primary focus. The three compensating techniques are not a complete factory design, but they do compose the strategic factory design. While these design factors exist for any factory, we need to relate them to the design of a vehicle assembly plant. Achieving strategic goals relating to variation, capacity, and buffers will be achieved through management of the physical design features described in the following table.
  • 3. Table of design features Physical design parameters What they represent Base case values Number of line segments The total number of workstations is broken up into line segments. The size of the line segments is determined by how many pieces the total is broken up into, which is the number of buffers plus one. This value does not show up explicitly in the model. It is represented in the length of the line segments. It should be considered, however, because each new line segment represents significant cost. The base case represented six line segments. Length of line segments (or # stations / segment) The length of the line segments is the total number of workstations, typically 250-500 for an assembly plant, divided by the number of line segments. We settled on a value of 33, which is in the ballpark of Toyota’s factories. If there were no buffers, i.e. a traditional assembly plant, this value would reach 200-500. Size of buffers (or accumulator size) The size of the buffers represents how many vehicles can be held in each buffer between line segments. We settled on a value of 15. Buffer size drives conveyor length and sometimes floor space, requiring investment dollars. Plant uptime (or P[downstream segment starved]) This represents the percent of available time to produce final product. The factory only loses final product when the last downstream segment is starved. No factory has 100 percent uptime. The realized capacity, which must meet customer demand, is the plant uptime times the segment’s minimum theoretical capacity process. This is an output of the math model. It is the primary performance metric to evaluate the overall design. We settled on a probability of starvation of 8 percent, which can be restated as 92 percent uptime. Percent over-speed If the upstream line segment runs at a faster pace than the downstream segment, it can partially make up for lost production from downtime. The model includes the takt time4 of both the upstream and downstream line segments. Our values are 103 seconds for the downstream segment, and 100 seconds for the upstream segment, which results in a percent over-speed of 3 percent. Shift structure The plant can run with one, two, or three shifts per day. Few assembly plants run with one, but one or two shifts represents windows of opportunity to run overtime, reset buffers, or do preventive maintenance. A three-shift policy runs shifts back- to-back not allowing for these activities. We settled on a two-shift policy, followed by Toyota, which allows for the possibilities stated at left. What happens to uptime if these activities are hampered? Variation (or E[# cycles before failure]) This value represents the number of expected completed jobs before an andon signal results in a line stop. Based on data from Toyota5 , we settled on a value of 550. Is it fair to use Toyota’s quality data for another automotive producer? 4 Takt time is a term used by Toyota that is consistent, but not equal to, cycle time. The true definition of takt time is the available minutes of production in a day divided by the daily customer demand. Here the value substituted is more represented by the pace of the conveyor (or the available time per workstation), which can be set independently for each line segment. 5 Mishina, Kazuhiro. Toyota Motor Manufacturing, U.S.A., Inc. Harvard Business School case # 9-693- 019, September 5, 1995.
  • 4. Instructions for class 1) Open the Excel 97 spreadsheet titled lean_factory.xls that contains the model. 2) Using the shaded cells in the sheet Results Page, examine the relationship between factory performance and the following parameters: a) Line segment length (vary # stations per segment for both segments) b) Percent over-speed (vary the upstream takt time) c) Reduce process variation (vary the E[# cycles before failure] for both segments) Note – the spreadsheet permits you to change other parameters: the probability the upstream segment is starved (currently at 0.07); the mean time to repair (MTTR) for both segments; the hours per shift. You should leave these as is. 3) Use the Tradeoff Curves sheet to determine the correct buffer size for each solution set. Maintaining the downstream segment takt time at 103 seconds and shifts at 2/day and 8 hours / shift, the factory’s throughput (or E[# finished cars/day]) must meet demand of 480 vehicles. Questions for reflection The following set of questions is not to be answered for class. However, to give you a feel for the kinds of questions that a person who is implementing this model must address, we have included several of the key questions that the design team had to think about. 1) What seems a reasonable design solution for the factory? 2) Where does the role of variation reduction fit into the model? Can this be considered an input to the design? What must be in place to change this parameter? 3) What are the limitations of the model? What assumptions are included? 4) How would you manage an understanding of the investment costs when using this model? 5) How can we communicate our insights generated from using the model to others both inside and outside manufacturing?