Apollo Tyre's plan to buy US based Cooper Tyres for $2.5 bn. - www.lkpsec.com
•
2 likes•959 views

LKP Research view on Apollo Tyre's plan to buy US based Cooper Tyres in an all cash transaction of $2.5 bn. For more information log on to www.lkpsec.com

Recommended
Recommended
More Related Content
Recently uploaded
Recently uploaded (20)
Featured
Featured (20)
Apollo Tyre's plan to buy US based Cooper Tyres for $2.5 bn. - www.lkpsec.com
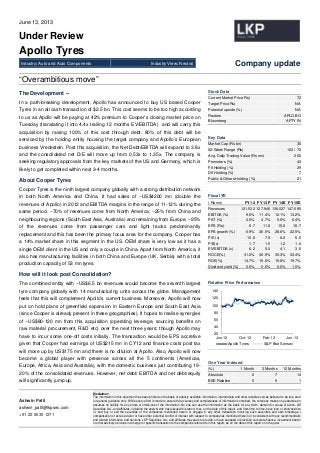
- 1. Ashwin Patil ashwin_patil@lkpsec.com +91 22 6635 1271 Disclaimer: The information in this document has been printed on the basis of publicly available information, internal data and other reliable sources believed to be true and is for general guidance only. While every effort is made to ensure the accuracy and completeness of information contained, the company makes no guarantee and assumes no liability for any errors or omissions of the information. No one can use the information as the basis for any claim, demand or cause of action. LKP Securities Ltd., and affiliates, including the analyst who have issued this report, may, on the date of this report, and from time to time, have long or short positions in, and buy or sell the securities of the companies mentioned herein or engage in any other transaction involving such securities and earn brokerage o compensation or act as advisor or have other potential conflict of interest with respect to company/ies mentioned herein or inconsistent with any recommendation and related information and opinions. LKP Securities Ltd., and affiliates may seek to provide or have engaged in providing corporate finance, investment banking or other advisory services in a merger or specific transaction to the companies referred to in this report, as on the date of this report or in the past. June 13, 2013 Under Review Apollo Tyres Industry: Auto and Auto Components Industry View: Neutral l Company update “Overambitious move” The Development – In a path-breaking development, Apollo has announced to buy US based Cooper Tyres in an all cash transaction of $2.5 bn. This cost seems to be too high according to us as Apollo will be paying at 42% premium to Cooper’s closing market price on Tuesday (translating it into 4.4x trailing 12 months EV/EBITDA) and will carry this acquisition by raising 100% of this cost through debt. 80% of this debt will be serviced by the holding entity housing the target company and Apollo’s European business Vredestein. Post this acquisition, the Net Debt/EBITDA will expand to 3.8x and the consolidated net D/E will move up from 0.53x to 1.35x. The company is seeking regulatory approvals from the key markets of the US and Germany, which is likely to get completed within next 3-4 months. About Cooper Tyres Cooper Tyres is the ninth largest company globally with a strong distribution network in both North America and China. It had sales of ~US$4200 mn (double the revenues of Apollo) in 2012 and EBITDA margins in the range of 11-12% during the same period. ~70% of revenues come from North America; ~25% from China and neighbouring regions (South East Asia, Australia) and remaining from Europe. ~95% of the revenues come from passenger cars and light trucks predominantly replacement and this has been the primary focus area for the company. Cooper has a 14% market share in this segment in the US. OEM share is very low as it has a single OEM client in the US and only a couple in China. Apart from North America, it also has manufacturing facilities in both China and Europe (UK, Serbia) with a total production capacity of 53 mn tyres. How will it look post Consolidation? The combined entity with ~US$6.5 bn revenues would become the seventh largest tyre company globally with 14 manufacturing units across the globe. Management feels that this will complement Apollo’s current business. Moreover, Apollo will now put on hold plans of greenfield expansion in Eastern Europe and South East Asia (since Cooper is already present in these geographies). It hopes to realise synergies of ~US$80-120 mn from this acquisition (operating leverage, sourcing benefits on raw material procurement, R&D etc) over the next three years; though Apollo may have to incur some one-off costs initially. The transaction would be EPS accretive given that Cooper had earnings of US$215 mn in CY12 and finance costs post tax will move up by US$175 mn and there is no dilution at Apollo. Also, Apollo will now become a global player with presence across all the 5 continents (Americas, Europe, Africa, Asia and Australia), with the domestic business just contributing 19- 20% of the consolidated revenues. However, net debt/ EBITDA and net debt/equity will significantly jump up. Stock Data Current Market Price Rs) 72 Target Price Rs) NA Potential upside (%) NA Reuters APLO.BO Bloomberg APTY IN Key Data Market Cap (Rs bn) 36 52-Week Range (Rs) 102 / 72 Avg. Daily Trading Value (Rs mn) 200 Promoters (%) 43 FII Holding (%) 29 DII Holding (%) 7 Public & Others Holding (%) 21 Fiscal YE ( Rs mn) FY 12 FY 13P FY 14E FY 15E Revenues 121,532 127,946 136,027 147,085 EBITDA (%) 9.6% 11.4% 12.1% 13.2% PAT (%) 3.6% 4.7% 5.6% 6.4% EPS (Rs) 8.7 11.8 15.2 18.7 EPS growth (%) -0.9% 36.5% 28.6% 22.5% P/E (x) 10.8 7.9 6.2 5.0 P/B(x) 1.7 1.5 1.2 1.0 EV/EBITDA (x) 6.2 5.0 4.1 3.0 ROCE(%) 31.2% 36.9% 35.3% 33.4% ROE(%) 14.7% 19.6% 19.8% 19.7% Dividend yield (%) 0.6% 0.6% 0.6% 1.0% Relative Price Performance One Year Indexed (%) 1 Month 3 Months 12 Months Absolute 2 7 14 BSE Relative 5 9 1 20 40 60 80 100 120 140 Jun-12 Oct-12 Feb-13 Jun-13 Apollo Tyres S&P Bse Sensex
- 2. Apollo Tyres LKP Research Deal structure and valuation Apollo Tyres would be making an offer of US$35 for ~63 mn shares at Cooper Tyres which represents a 42% premium to Tuesday’s close price. This along with ~US$300 mn of net debt and minority would take total enterprise valuation of ~US$2.5 bn. Given that Cooper’s EBITDA was ~US$521 mn, it translates into ~4.4x trailing EV/EBITDA which is in line with where global tyre companies trade at. While regulatory approvals would be required in the US and some other geographies like Germany, the company doesn’t foresee anti-trust or any other hurdle. The deal would be fully debt funded. Cooper and Vredestein would come under a holding company based out of Netherlands which would be taking US$2.1 bn debt and it would be serviced by operations of these two entities. Apollo is also taking a US$450 mn debt in a Mauritius based entity which will be used to fund the equity contribution of the Netherlands entity; this debt would be serviced by Apollo’s Indian operations. The debt will be raised via bonds in the US market which are likely to have a 7-8 year maturity, a funding cost of ~10% and a bullet repayment. The company has no intention of any equity dilution in the near future (QIP approval taken earlier would be expiring by November). Outlook In our view, the acquisition looks over ambitious viewing the current demand scenario across the globe. Although the management has mentioned that this move will be EPS accretive right from the first year of operations, we have our reservations on it viewing the limitations on the topline growth and profitability at the EBITDA front considering the challenges both Apollo and Cooper are facing currently. In FY 12, Cooper has posted its peak margins, and given the competitive intensity in the US from Chinese and Japanese players, we remain concerned over the pricing stability over there. In India too, given the falling CV industry growth (~70 % of Apollo’s business), earning incremental cash flows to pay off the debt seems difficult. Also execution is a key to earn stable margins considering the volatile demand and raw material environment across the globe. Few years back, when the company had acquired Vredestein’s operations, it was acquired from a loss making company at reasonable valuations, which paid off well for Apollo. Though Cooper seems like a good strategic fit, Apollo is paying a huge price for it (the debt raised for buying it, itself being more than 3x times Apollo’s market cap), and hence gaining synergies and the timeline of achieving it is important. We also await more visibility on the complex funding structure and approval process in the next few months. Despite the 20% fall in the stock price today, we believe there will be an overhang on the stock due to the complexity of the deal and expectations of investors from the deal going forward. We need to wait and watch over the next few quarters, as in how the synergies of this deal shape up. We are reviewing our numbers and hence the stock is ‘Under Review’.The financial projections in this report does not include numbers of Cooper.
- 3. Apollo Tyres LKP Research Financial Summary Income statement YE Mar (Rs.mn) FY 12 FY 13 FY 14E FY 15E Total Revenues 121,532 127,946 136,027 147,085 Raw Material Cost 80,370 79,969 81,055 84,800 Employee Cost 13,350 14,714 17,386 19,464 Other Exp 16,195 18,697 19,316 21,180 EBITDA 11,617 14,567 16,498 19,444 EBITDA Margin(%) 9.6% 11.4% 12.1% 13.2% Other income 326 944 1070 1000 Depreciation 3,256 3,966 3,895 4,615 Interest 2872 3128 2409 2148 PBT 5,815 8,418 10,984 13,490 PBT Margin(%) 4.8% 6.6% 8.1% 9.2% Tax 1,443 2,449 3,305 4,086 Adj PAT 4,372 5,970 7,679 9,404 Adj PAT Margins (%) 3.6% 4.7% 5.6% 6.4% Exceptional items 293.0 -168.6 0.0 0.0 PAT 4079 6138 7679 9404 PAT Margin (%) 3.4% 4.8% 5.6% 6.4% Key Ratios YE Mar FY 12 FY 13P FY 14E FY 15E Per Share Data (Rs) Adj. EPS 8.7 11.8 15.2 18.7 CEPS 3.4 16.2 27.8 40.2 BVPS 55.2 62.1 76.8 94.5 DPS 0.6 0.6 0.6 0.9 Growth Ratios(%) Total revenues 37.0% 5.3% 6.3% 8.1% EBITDA 20.3% 25.4% 13.3% 17.9% PAT -0.9% 36.5% 28.6% 22.5% EPS Growth -0.9% 36.5% 28.6% 22.5% Valuation Ratios (x) PE 10.8 7.9 6.2 5.0 P/CEPS 27.4 5.8 3.4 2.3 P/BV 1.7 1.5 1.2 1.0 EV/Sales 0.6 0.6 0.5 0.4 EV/EBITDA 6.2 5.0 4.1 3.0 Operating Ratios (Days) Inventory days 93.0 98.0 92.0 91.0 Recievable Days 58.7 62.0 58.0 55.0 Payables day 18.6 18.0 17.0 17.0 Net Debt/Equity (x) 0.90 0.83 0.53 0.23 Profitability Ratios (%) ROCE 31.2% 36.9% 35.3% 33.4% ROE 14.7% 19.6% 19.8% 19.7% Dividend payout 6.1% 5.0% 4.0% 5.0% Dividend yield 0.6% 0.6% 0.6% 1.0% Source: Company, LKP Research Balance sheet YE Mar (Rs. mn) FY 12 FY 13P FY 14E FY 15E SOURCES OF FUNDS Equity Share Capital 504 504 504 504 Reserves & Surplus 27,319 30,815 38,186 47,121 Total Networth 27,823 31,319 38,690 47,625 Total debt 17,550 25,157 26,157 23,157 Current liabilities Short term borrowings 9,339 8,839 8,339 7,839 Trade payables 12,935 13,652 12,707 12,214 Other current liabilities 7,645 8,145 8,645 9,145 Short term provisions 4,089 4,589 5,089 5,589 Total Current Liabilities 34,008 35,225 34,781 34,787 Deferred tax liabilities 4,051 4,051 4,051 4,051 Total shareholder equity and Liabilities 83,944 96,256 104,183 110,124 APPLICATION OF FUNDS Net block 39,180 39,215 38,320 36,704 Capital WIP 3,305 4,500 7,500 7,501 Intangible Assets 1,058 1,208 1,358 1,508 Long term Investments 158 59 59 59 Goodwill 1,338 1,338 1,338 1,338 Deferred tax assets 25 25 25 25 Long term loans and advances 2,207 1,907 1,607 1,307 Total non current assets 47,271 48,251 50,206 48,442 Current Assets Cash and Bank 1,731 8,153 14,014 20,237 Inventories 19,991 21,471 20,430 21,142 Sundry Debtors 11,458 11,217 11,180 11,686 Loan, Advances & others 3,341 7,011 8,199 8,462 Short term Loans and Advances 3,341 7,011 8,199 8,462 Other Current Assets 153 153 153 154 Total Assets 83,944 96,256 104,183 110,124 Cash Flow YE Mar (Rs mn) FY 12 FY 13P FY 14E FY 15E PBT 5,565 8,587 10,984 13,490 Depreciation 3,256 3,966 3,895 4,615 Interest 2,867 3,128 2,409 2,148 Chng in working capital (3,099) (3,692) (555) (1,476) Tax paid (953) (2,449) (3,305) (4,086) Other operating activities (42) (2,351) 0 0 Cash flow from operations (a) 7,594 7,189 13,428 14,693 Capital expenditure (7,930) (5,195) (6,000) (3,001) Chng in investments (52) (51) (150) (150) Other investing activities (77) 300 300 300 Cash flow from investing (b) (8,059) (4,946) (5,850) (2,851) Free cash flow (a+b) (465) 2,243 7,577 11,842 Inc/dec in borrowings 3,372 7,607 1,000 (3,000) Dividend paid (incl. tax) (293) (298) (307) (470) Other financing activities (2,783) (3,128) (2,409) (2,148) Cash flow from financing (c) 295 4,181 (1,716) (5,619) Net chng in cash (a+b+c) (170) 6,424 5,861 6,223 Foreign excg fluctutions (9) 0 0 0 Closing cash & cash equivalents 1,729 8,153 14,014 20,237 Less: Unpaid dividends bank accounts 28 66 66 67 Adj. Closing cash & cash eqvts 1,635 8,087 13,948 20,171
- 4. Apollo Tyres LKP Securites Ltd, 13th Floor, Raheja Center, Free Press Road, Nariman Point, Mumbai-400 021. Tel -91-22 - 66351234 Fax- 91-22-66351249. www.lkpsec.com Team LKP Pratik Doshi Director 98210 47676 pratik_doshi@lkpsec.com S. Ranganathan Head of Research 98212 22510 6635 1270 s_ranganathan@lkpsec.com Ashwin Patil Research Analyst 98195 78395 6635 1271 ashwin_patil@lkpsec.com Chirag Dhaifule Research Analyst 98679 80172 6635 1220 chirag@lkpsec.com Rajeev Gupta Head of Sales 98203 07797 6635 1230 rajeev@lkpsec.com Hardik Mehta Sales 98190 66569 6635 1246 hardik_mehta@lkpsec.com Varsha Jhaveri Sales 93241 47566 6635 1296 varsha_jhaveri@lkpsec.com Hitesh Doshi Sales 93222 45130 6635 1281 hitesh_doshi72@lkpsec.com Bharat Shah Dealing 98337 97256 6635 1210 bharat_shah@lkpsec.com Kaushik Doshi Dealing 93205 23595 6635 1207 kaushik_doshi@lkpsec.com