BDSM⚡Call Girls in Indirapuram Escorts >༒8448380779 Escort Service
Choosing the Clean Path for Fueling Our Transportation Future
1. Choosing the clean path for Fueling
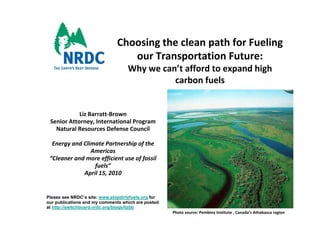
Choosing the clean path for Fueling
our Transportation Future:
Why we can’t afford to expand high
carbon fuels
b f l
Liz Barratt‐Brown
Senior Attorney, International Program
Natural Resources Defense Council
Energy and Climate Partnership of the
Americas
“Cleaner and more efficient use of fossil
fuels”
April 15, 2010
Please see NRDC’s site: www.stopdirtyfuels.org for
our publications and my comments which are posted
bli ti d t hi h t d
at http://switchboard.nrdc.org/blogs/lizbb
Photo source: Pembina Institute , Canada’s Athabasca region
2. Points to consider
• The trade-offs in
Th t d ff i producing hi h carbon f l such as t sands, oil
d i high b fuels, h tar d il
shale and liquid coal, are too high to justify their benefits. There are
better solutions than to pursue environmentally destructive fuels.
• Production and combustion of high carbon fuels will undermine efforts to
reduce carbon emissions by 80% by 2050. Policies to reduce our
dependence on oil and cut emissions should be of highest priority, on
national security and economic as well as environmental grounds.
• Dependence on high carbon fuels undercuts our ability to adopt critically
important policies, such as Low Carbon Fuel Standards, and to
encourage other countries to do the same.
Slide 2
3. Large tar sand deposits can be mined for heavy
oil but at significant environmental costs
• U.S. imports about 800,000 barrels per day in bitumen and upgraded
synthetic crude oil. This could double or triple in the coming decade if
y p g
pipelines such as Keystone XL are approved.
Source: The Pembina Institute, Oil Sands Fever, pg. 1 Slide 3
4. Canadian tar sands are extracted by strip
mining or by drilling using steam
g y g g
Surface
S f
Mining
In Situ
In-Situ
Drilling
Sources: Figures from Bengt Soderbergh, Presentation 5/23/2005, Uppsala University, Pembina
Institute; and Indigenous Environmental Network Slide 4
5. Land use impacts from open pit mines and in-
situ production methods are enormous
Source: The Pembina Institute (left) and WWF (right) The in
(right). in-
situ is an extrapolation of what the area south of Ft. McMurray
would look like if all approved projects go forward.
Slide 5
6. Tar sands tailings waste ponds are among the largest in
the world, with serious human and wildlife toxicity
impacts (especially on migratory birds)
Yesterday, NRDC filed a NAFTA CEC petition with ED Canada and affected
citizens regarding l k of enforcement of C
ii di lack f f f Canada’s f d l Fi h i
d ’ federal Fisheries
Act(http://www.environmentaldefence.ca/reports/CECsubmissionTarSands.pdf)
Slide 6
7. Lifecycle greenhouse gas emissions for in situ production are 8-
37% greater compared to the U.S. 2005 gasoline baseline
• 93% of tar sands oil will be
extracted by in situ mining.
• A number of studies have been
conducted based on both current
operations or future operations with
most studies estimating between 8
to 37% increased emissions on a
well-to-wheel b i (
ll h l basis (specific value
ifi l
dependent on the mining or in-situ
production process).* Upstream or
well-to-tank emissions are shown.
• Loss of soil and biogenic carbon
have not been included and can
increase this value
* NRDC (2010), GHG Emission Factors for High Carbon Intensity Crude Oils. Slide 7
8. High Carbon Fuels Undermine Efforts
to Reduce GHG Emissions
Increased development of marginal, unconventional sources of crude oil
(tar sands oil shale and coal to liquids) threatens to offset the benefits of
sands, shale,
clean energy efforts
Projected Fuel Volumes for U S in 2020
ojec ed ue o u es o U.S. 0 0
2.5
Low Case High Case
mbd
2.0
Volume in 2020 (m
1.5
es
1.0
current
t
0.5
0.0
00
Liquid Coal Oil Shale Tar Sands
Data sources: Low: AEO 2009 reference case, Canadian Pembina Institute (tar sands);
High: RAND studies, CAPP (tar sands) Slide 8
9. High Carbon Fuels could make reaching an 80%
reduction in transportation emissions impossible
p p
5000 Dirty Fuels (high) • Because of high carbon fuels, by
Dirty Fuels (low)
Di t F l (l ) 2030,
2030 transportation sector
(million metric tons of CO2-equivale per year)
emissions could rise 6-33% over
ansportation Sector GHG Emissions
Baseline (with EISA & Nat'l High
4000
carbon baseline.
Program)
fuels
ent
Climate Stabilization
E
• Carbon dioxide reductions from
3000
national GHG and fuel efficiency
standards could be significantly
C
S
offset by additional production
2000
emissions from tar sands and other
80%
by 2050 high carbon fuels (oil shale and
liquid coal)
US Tra
path
m
1000
• Investments in facilities and
0
pipelines for high carbon fuels create
2010 2015 2020 2025 2030 “carbon lock in.”
Wedges based on NRDC analysis Slide 9
10. Energy security is best achieved through reducing
oil dependency and limiting use of high carbon
fuels
Oil Savings (Million Barrels pe Day)
12 National Program GHG and Fuel
Economy Passenger Vehicle
er
10 Standards
New GHG and Fuel Economy Heavy
8 Truck Standards
n
6 National L
N ti l Low C b F l St d d
Carbon Fuel Standard
4
Reformed Transportation Investment
2 (to reduce/shift traffic to transit and
nonmotorized modes)
0 Other: Air travel improvements,
2020 2030 Building Efficiency
Upon entering office, President Obama pledged to eliminate the equivalent of 3.3
mbd in 10 years. The Administration should adopt a comprehensive oil savings
plan as should other countries in the hemisphere. According to EPA, the
Administration’s light duty GHG and fuel efficiency standards will save 1.8 mbd
over the lifetime of the regulated vehicles.
Slide 10
11. Policy Roadmap for Addressing Transportation
Sector Emissions
1. Transportation Fuels In Economy Wide Caps
2. Complementary Performance Standards
– In U.S., national auto standards complemented by California Clean
Cars Law
– Low Carbon Fuels Standards
– Reformed Transportation Investments (reducing the need to drive)
3. No exemptions and subsidies for production of high carbon fuels
4. Stimulate markets for low carbon fuels
– R&D i investments, fi
t t financial i
i l incentives
ti
– Retooling and manufacturing investments
– Consumer and fleet incentives for lowest emission vehicles
– Dedicated funding for priority transit projects incentives to reform land
projects,
use and transportation
Slide 11
12. What is a “Low Carbon Fuel Standard”?
• On April 23, 2009, the California Air
Resources Board adopted the nation’s first
greenhouse gas pollution standard for fuels.
• Goal is to ensure fuel providers contribute to
meeting California’s 2020 GHG reduction goal
set by state law (AB32, the Global Warming
)
Solutions Act).
• CA LCFS will require refiners and importers of gasoline and diesel fuel
to gradually reducing the carbon-intensity of their fuel pool by 10% by
2020.
2020
• Other regions considering a LCFS include Oregon, Northeast and Mid-
Atlantic States, Midwest States, EU, and Canadian provinces.
Slide 12
13. The LCFS provides maximum flexibility
for fuel providers
• Performance-based, fuel neutral approach ensures
maximum compliance flexibility and maximum incentives for
innovation
– Eg: Investors and producers can achieve more value for their fuel
through practices that result in a better carbon intensity score
• Multiple options to meet the performance standards
– Reduce the carbon intensity of their production process (e.g. CCS,
efficiency, fuel switching)
– Blend or sell a mix of fuels with a carbon intensity equal to the
standard
– Purchase LCFS credits from fuel providers who exceeded the
standard
– Use banked LCFS credits from previous y
p years
Slide 13
14. Policies – like the LCFS – can spur important
investments in cleaner fuels and energy p
gy production
Top 5 Oil Company Profits in 2008 Compared to Investments in
Renewable and Alternative Energy
110 Net
$100 Chevron
Billion Dollar ($ 2008)
90 BP
Shell
70
Exxon Mobil
rs
50 Conoco Phillips
30
B
Net
N t
10
$4
-10
Profits Investments in
Renewable &
Alternative Energy
Data Source: Center for American Progress (2009) Slide 14
15. Additional references
Impact of Canadian tar sands is enormous:
• Environmental Defence Canada “The Most Destructive Project on Earth” (http://www.environmentaldefence.ca/reports/pdf/TarSands_TheReport.pdf)
• Pembina fact sheet “Oil Sands Myths” (http://pubs.pembina.org/reports/oilsandsmyths-slideshow.pdf)
y ( p p p g p y p )
Canadian environmental and climate policies are undermined by tar sands growth
• Environmental Defence Canada report “Just Visiting – Stephen Harper’s climate insincerity”
(http://www.environmentaldefence.ca/reports/pdf/JustVisiting_FINAL.pdf)
• Pembina Institute press release about weakening the Environmental Assessment process (http://www.oilsandswatch.org/media-release/1989
• Pembina Institute report for Copenhagen, outlining Canada’s positions (http://pubs.pembina.org/reports/cop15-briefing-note-final-dec-2.pdf)
Canada s (http://pubs.pembina.org/reports/cop15 briefing note final dec 2.pdf)
Canada is being outspent by the U.S. 18:1 on renewable and 8:1 on clean energy
• Pembina Institute (http://climate.pembina.org/pub/1979)
In situ mining is an unproven technology and has potentially large environmental and climate impacts
• NRDC report “Danger in the Nursery – Impact of tar sands development in Canada’s Boreal on Birds” (http://www nrdc org/wildlife/borealbirds asp)
(http://www.nrdc.org/wildlife/borealbirds.asp)
• Pembina report “Drilling Deeper – the in situ oil sands report card” (http://pubs.pembina.org/reports/in-situ-report-card.pdf)
• RPSenergy report (http://trc.jogmec.go.jp/pdf/20091002/1.pdf)
CCS faces many technological and economic challenges in the tar sands
• World Wildlife Fund-U.K.’s report “Carbon Capture and Storage in the Alberta Oil Sands – a Dangerous Myth” (http://www.co-
operative.coop/Corporate/PDFs/Tar%20Sands%20CCS.pdf) S
i /C /PDF /T %20S d %20CCS df) Summary i h is here: h //
http://www.carboncapturejournal.com/displaynews.php?NewsID=47
b j l /di l h ?N ID 47
• Canada’s Fossil Energy Future: The Way Forward on Carbon Capture and Storage (http://www.energy.alberta.ca/Org/pdfs/Fossil_energy_e.pdf)
The waste tailings ponds and land impacts are causing downstream toxicity concerns and are a hazard to public health and wildlife
• Environmental Defence “11 Million Litres a Day – The Tar Sands Leaking Legacy”
(http://www.environmentaldefence.ca/reports/pdf/TailingsReport_FinalDec8.pdf)
• Pembina fact sheet on tailings directive 074 (http://pubs.pembina.org/reports/tailings-directive-074-backgrounder.pdf)
Please see NRDC’s site: www.stopdirtyfuels.org for our publications and my comments which are posted on my blog at
http://switchboard.nrdc.org/blogs/lizbb/
Slide 15