Omg college access and success college enrollment activity (october 29 2010)
•
2 gefällt mir•982 views


Empfohlen
Empfohlen
Weitere ähnliche Inhalte
Mehr von Cleveland-Marshall College of Law
Mehr von Cleveland-Marshall College of Law (20)
Kürzlich hochgeladen
Kürzlich hochgeladen (20)
Omg college access and success college enrollment activity (october 29 2010)
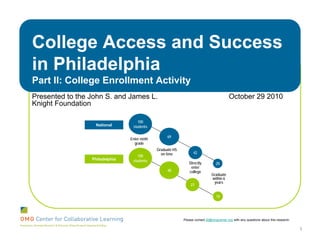
- 1. College Access and Success in Philadelphia Part II: College Enrollment Activity Presented to the John S. and James L. October 29 2010 Knight Foundation 100 National students 69 Enter ninth grade Graduate HS on time 42 100 Philadelphia students Directly 20 enter 48 college Graduate within 6 years 23 10 Please contact jill@omgcenter.org with any questions about this research. 1
- 2. Overview Executive summary 3 Study purpose and methodology 9 I. What Do Philadelphia Public High School Graduates Look Like? 11 II. What Are the College Enrollment Patterns of Philadelphia Public High School Graduates? 15 III. What Are The College Retention Patterns of Philadelphia Public High School Graduates? 24 IV. What Are Their College Graduation Patterns of Philadelphia Public High School Graduates? 32 V. Conclusions and Implications For Systems Efforts in Philadelphia 38 VI. Appendix 43 2
- 3. Executive Summary: What Is the Pipeline of College Graduation for Philadelphia 9th Graders? Philadelphia lags behind national rates for college enrollment and completion. K-12 System Colleges and Universities 100 Goal: National** students Double Philadelphia’s 18% College Attainment 69 Rate Within 5-10 Enter ninth Years grade Mayor Michael Graduate 42* Nutter HS on time 100 (in 4 years) Philadelphia‡ students Directly (1999 9th grade cohort) enter 20+ 1999 48 college Graduate within 6 years 2003 23* 2009 10+ * “Directly enter college” for the national cohort is defined as matriculation in a two- or four-year college within the first semester after high school graduation. “Directly enter college” for the Philadelphia cohort is defined by matriculation in a two- or four-year college within the first year after graduating high school. In the remainder of this report “directly enter” (immediately enrolled) is defined as matriculation within the first fall semester. + “Graduation within 6 years” for the national cohort and the Philadelphia cohort includes two- and four-year degrees. However, the national figure only includes two-year degrees obtained within three years. ** National pipeline data source: Student Pipeline - Transition and Completion Rates from 9th Grade to College for 2006. The National Center for Higher Education Management Systems. Data tables. www.higheredinfo.org/dbrowser/?year=2006&level=nation&mode=data&state=0&submeasure=119 ‡ Philadelphia pipeline data source: School District of Philadelphia Office of Accountability, Jan 2010. “Pipeline” to College Graduation for First-time 9th Graders, 1999-2000. 3
- 4. Executive Summary: What Do Philadelphia Public High School Graduates Look Like? 2003-2009 Philadelphia HS Graduates: Sixty-five percent (65%) African-American students. Slightly more females than males (55% vs. 45%). Sixty-two percent (62%) attended a “universal feeding school” in which all students are eligible for free lunch because there is a predominance of poverty. Twenty-six percent (26%) of graduates were receiving Temporary Assistance for Needy Families (TANF). The percentage of Caucasian graduates decreased from 19% in 2003 to 14% in 2009, reflecting a decrease in enrollment by Caucasian students. The majority of students (65%) attended and graduated from neighborhood schools. Magnet schools had more female, Caucasian, and Asian graduates, and fewer graduates who were receiving TANF benefits. 4
- 5. Executive Summary: What Are the College Enrollment Patterns of Philadelphia Public High School Graduates? 2003-2009 Philadelphia HS Graduates: Nearly half of Philadelphia graduates have ever enrolled in college and slightly more than one-third (37%) immediately enrolled in college (in the fall following HS graduation). Students who delay enrollment are significantly more likely to initially attend a two- year college rather than a four-year college. Three local higher education institutions draw half of all enrollees: Community College of Philadelphia (CCP), Temple University, and Pennsylvania State University together represent 50% of all initial college enrollments for Philadelphia public high school students; CCP alone represents nearly one-third of initial enrollments. Female students are more successful with enrollment: Female students are more likely than males to ever enroll in college (53% vs. 43%) and more likely to do so immediately (40% vs. 32%). 5
- 6. Executive Summary: What Are the College Retention Patterns of Philadelphia Public High School Graduates? 2003-2008 Philadelphia HS Graduates: Philadelphia public high school graduates who enrolled in college were more likely to remain in college one year later if they: enrolled in college immediately in the first fall (76% retained) enrolled in college immediately into four-year institutions (81% retained) enrolled in college immediately into in-state schools (76% retained) Among immediate enrollees by race/ethnicity, Hispanic and African-American students were less likely than their White and Asian counterparts to remain enrolled (70% and 72% vs. 83% and 89%, respectively). Among immediate enrollees by gender, females were slightly more likely to remain enrolled than males (77% vs. 75%). Of students who attended two colleges, slightly more students transferred from four-year to two-year colleges (22%) than from two-year to four-year colleges (15%), pointing to variation in students’ pathways for college completion. Students who transfer from four-year to two-year colleges may have additional struggles, such as financial and preparedness barriers. 6
- 7. Executive Summary: What Are the College Graduation Patterns of Philadelphia Public High School Graduates? 2003 Philadelphia HS Graduates: Four percent (4%) of Philadelphia public high school graduates who immediately enrolled in two-year colleges earn an associate’s degree within three years. Fifty-two percent (52%) of Philadelphia public high school graduates who immediately enrolled in four-year colleges earn a bachelor’s degree within six years. Philadelphia public high school graduates who immediately enrolled in private colleges were more likely to graduate within six years than students who immediately enrolled in public colleges (63% vs. 40%). Caucasian and Asian students who immediately enrolled in any type of college were more likely to graduate college (59% and 60%, respectively) than Hispanic and African-American students who immediately enrolled (38% and 37%, respectively). Females who immediately enrolled in any type of college were more likely than males to graduate college (49% vs. 40%). Immediate enrollees from magnet high schools (60%) and students not receiving TANF benefits (46%) were more likely to graduate college than their peers. 7
- 8. Executive Summary: What Does This Mean for Those Who Want to Help Philadelphia Students Access and Succeed in College? System partners (policymakers, practitioners, funders) should work together to… Build a citywide college-going culture and invest in promoting greater spread of college preparation and college-going supports, especially to students with lower rates of college enrollment (i.e., students in neighborhood high schools; African-American, Hispanic, and low-income students). Include widespread outreach to students, training for faculty and staff, and messaging to emphasize college enrollment expectations across the district. Promote immediate college enrollment, with increased focus on the transition from high school to college to prevent further delayed enrollments. System partners should invest in transition supports to bridge and align college-going efforts from high school into college to provide continuity for students across the pipeline. Enhance resources at the college level to increase the number of at-risk students staying in college and on a pathway to a four-year degree, including driving investments to support students on the two- to four-year college pathway. 8
- 9. About The Student Tracking Study and This Report This report analyzes and describes college enrollment and graduation outcomes of public high school graduates in Philadelphia. A companion report (College Access and Success in Philadelphia, Part 1: Moving Towards Systemic Efforts) presented a landscape scan of the supports for college enrollment and graduation in Philadelphia. Primary research questions answered in this report: Purpose of Study: (Questions in blue are addressed in the companion report) 1. What is the ideal college access and success (CAS) system? 1. To better understand the college enrollment patterns of 2. What does the system of college access and success students and the system of supports look like in Philadelphia? college access and success 3. What programs are in place vis-à-vis what is known nationally supports in Philadelphia. as necessary for a strong college access and success system? 2. To identify opportunities for 4. What do the college access and success patterns of students look like in Philadelphia? strengthening the system and ultimately college attainment in 5. What are the opportunities for strengthening the college Philadelphia. access and success system in Philadelphia? 9
- 10. Methodology Population: Over 73,000 student records for 2003-2009 graduates of the School District of Philadelphia (SDP) Data sources: SDP student demographic data National Student Clearinghouse (NSC) college enrollment and graduation data Analysis: Analyses were performed using SPSS and STATA Enrollment analysis done for 2003-2009 (all high school graduates) College retention analysis done for 2003-2008 (those who went directly to college in first fall) College graduation analysis done for 2003 (those who went directly to college in first fall) Limitations: The NSC has access to enrollment data for over 92% of all two- and four-year colleges (including trade and technical schools), and degree verification information for a subset of those. Art Institute of Philadelphia (AIP) is not an NSC member and enrolls approximately 3,600 students per year, many of whom are from Philadelphia. SDP students who attend AIP would appear as non- enrollees in this analysis. Charter school data were only available starting in 2006. 10
- 11. I. What Do Philadelphia Public High School Graduates Look Like? Race of Philadelphia High School Graduates 2003-2009 Male Female 45.5% 54.5% 7.1% Yes No 11.6% Receiving TANF 25.6% 74.4% Special Education* 11.0% 89.0% 15.5% English Language 3.5% 96.5% Learners (ELL) 65.3% TANF is the best representation available of economically disadvantaged students in the district for student-level analysis. However, African American Caucasian Hispanic Asian Other many more students were likely in low- income households; 62% of Philadelphia high school graduates in these years attended a universal feeding school (schools in low-income areas that provide free lunch * Because Special Education includes a wide range of students, many of whom are not on a college to all students). trajectory, the population of Special Education students who attend college is not representative of students with a Special Education designation. Special Education is not analyzed as a subcategory in this report. 11
- 12. How Has the Profile of Graduates Changed Over Time? Race/Ethnicity of Philadelphia Public HS Graduates Over Time Race/Ethnicity of Graduates 70% The percent of Caucasian graduates 60% Percent of Graduating Class decreased from 19.3% in 2003 to 13.6% in 2009, reflecting a decrease in 50% SDP enrollment by Caucasian 40% students.* 30% 20% The percent of Hispanic or African- American graduates rose from 2003 to 10% 2009 (10% to 12.8% for Hispanic and 0% 63.6% to 66.1% for African-American 2003 2004 2005 2006 2007 2008 2009 graduates). High School Graduation Year African American Caucasian Hispanic Asian Other The number of students receiving TANF The mean age, gender distribution, and benefits rose noticeably from 26.1% in percentage of English language learners 2008 to 35.4% in 2009. This is likely due to have remained stable. economic conditions during this timeframe. * Source: www.phila.k12.pa.us/about/ 12
- 13. From What Types of Schools Are Philadelphia Public School Students Graduating? High School Type 2003-2009 (Note that charter school data did New schools in the SDP seek to expand student options through different learning models not become available until 2006) Most students are graduating from neighborhood high schools; but the number of charters, small Neighborhood 64.5% schools, and other school models has increased in recent years. Citywide 8.2% Magnet 19.4% Most additional college access and success supports target neighborhood high schools Alternative 2.6% Since the majority of students attend neighborhood high schools, most nonprofit CAS supports, and many district CAS supports, target these schools. Charter 5.4% Neighborhood: Open admission to students who attend grade eight at a school that is within the feeder pattern. Students from outside of the feeder pattern may apply, but admission is based upon space availability. Citywide: Students throughout the city can apply. All citywide schools have standard admissions criteria. Seven of the 14 citywide admission high schools focus on career and technical education (CTE).* Special admission (e.g., magnet schools): Each of these schools has its own set of admissions criteria. They are the most selective of the district’s schools. Alternative: These high schools offer options for students who need supports beyond a traditional classroom. “Multiple Pathways” schools assist students who have previously dropped out (or those with low high school credits) in earning their high school diploma or its equivalent. “Transition services” provide settings and supports designed for students whose educational and social/emotional needs are not being met in the conventional classroom setting. Charter: These high schools are usually open to students citywide, although some have a geographic footprint from which they select students. These schools do not have admissions criteria, rather students are selected by lottery. *CTE involves a sequence of academic and technical courses addressing skills with the goal of training students to enter a high-demand occupation. These schools have a variety of programs, including automotive technology, business, communications, construction, culinary, firefighting, health, information technology, business, and cosmetology/fashion design. 13
- 14. Are There Differences in Who Graduates High School by High School Type? Demographics of high school graduates from magnet schools were notably different than other school types; more female, Caucasian, and Asian students; fewer students who received TANF benefits (15.9% vs. 25.6% district-wide). Race/Ethnicity of 2003-2009 Graduates of Different High School Types (Excludes Charters As Data Were Not Available in Earlier Years) Male Female All School Types 45.5% 54.5% 100% Neighborhood 47.4% 52.6% Percent of Graduating Class 90% 80% Citywide 45.2% 54.8% 70% 60% Magnet 37.9% 62.1% 50% Alternative 55.3% 44.7% 40% 30% 20% 10% Fewer females are 0% Neighborhood Citywide Magnet Alternative attending and graduating High School Type from alternative schools and more are attending African American Caucasian Hispanic Asian Other and graduating from magnet schools. More African-American students attend and graduate from citywide and alternative schools; more Caucasian and Asian students attend and graduate from magnet schools. 14
- 15. II. What Are the College Enrollment Patterns of Philadelphia Public High School Graduates? Approximately 50% of Philadelphia public high school graduates between 2003 and 2009 ever enrolled in college. Thirty-seven percent (37%) immediately enrolled in college (in the fall following HS graduation). This is significantly lower than national figures; nationally, 69% of 2005 high school graduates immediately enrolled in college. Among low-income high school graduates, the national number is 54%.1 College Enrollment Among Philadelphia High School Graduates from Graduating Classes, 2003-2009 Never enrolled in college 37% 51% Im m ediately enrolled in Ever college Enrolled Delayed enrollment 49% 12% Has Student Enrollment Changed Over Time? The percent of students who enroll in college immediately (the fall following HS graduation) has remained relatively stable from 2003-2009, with immediate enrollment ranging from 35% to 38%. Earlier graduating classes (with more time since high school graduation) have higher percentages of students who ever enrolled in college, at any point after high school, as would be expected since they have more time to have done so. 1U.S. Department of Education, National Center for Education Statistics. (2007). The Condition of Education 2007 (NCES 2007-064). Washington, DC: U.S. Government Printing Office. 15
- 16. What Types of Colleges Are Students Enrolling In? Overall, Philadelphia public high school graduates are more likely to enroll at four-year, public, and in-state institutions.1 Types of Colleges First Attended by School District of Philadelphia Graduates, 2003-2009 100.0% 90.0% 80.0% 70.0% Percent Enrolled 60.0% 50.0% In- Public State 40.0% Out- 76.6% Four- 86.7% 30.0% Year of- Two- 61.1% State 20.0% Year 13.3% Private 10.0% 38.0%2 Unknown 23.4% 0.9% 0.0% College Attributes 1Based on college where student first enrolled. 2Among the 38% of PHS graduates whose first institution was a two-year college, over 86% enrolled in Community College of Philadelphia 16
- 17. Are There Differences in the Types of Colleges Attended Among Students Who Immediately Enroll Versus Students Who Delay Enrollment? Students who delayed enrollment were much more likely to first attend a two-year institution rather than a four-year institution. Two-Year and Four-Year College Attendance Among Students Who Why Is Delayed Enrollment Important to Consider? Immediately Enrolled in College vs. Those Who Delayed Enrollment, 2003-2009 Delayed enrollment is a primary risk factor for leaving college without earning a degree. Other risk factors include: Delayed enrollment 67.3% 30.6% part-time attendance, working full-time, having dependent children, and having a GED.1 Immediate enrollment 28.6% 70.9% Students enrolling in two-year colleges are more likely than those enrolling in four-year colleges to experience risk factors for non-completion. 0% 10% 20% 30% 40% 50% 60% 70% 80% 90% 100% Tw o-year Four-year Unknow n There were no major differences in public vs. private college enrollment between those who immediately 1Moving Beyond Access: College Success for Low-Income, First-Generation Students. Washington, DC: The enrolled and those who delayed enrollment. Pell Institute for the Study of Opportunity in Higher Education (2008). 17
- 18. Where Do Students Enroll? Top 10 Colleges Where 2003-2009 Percent of Total Initial Philadelphia 2003-2009 public high school graduates Philadelphia Graduates Enroll1 College Enrollment enroll in local postsecondary institutions (mostly those with in-state tuition) Community College of Philadelphia (CCP) 32.4% 50.3% of Philadelphia public HS graduates attended Pennsylvania State University 10.2%2 three local colleges/universities: CCP, Temple University, and Penn State University. Temple University 7.7% Over one-third (39%) of students enrolled at CCP were Indiana University of Pennsylvania 2.6% also enrolled in at least one other college between 2003-2009. Cheyney University of Pennsylvania 2.5% Eight of the top ten highest enrollment colleges are Lincoln University 2.3% within a 50-mile radius of Philadelphia. Perceptions of reduced numbers of PHS graduates West Chester University 1.9% attending Temple and Penn State in recent years do Bloomsburg University of Pennsylvania 1.6% not bear out in the data According to the landscape scan, these schools are Drexel University 1.6% perceived as accepting fewer Philadelphia students in Kutztown University 1.5% recent years. However, enrollment numbers of Philadelphia public HS TOTAL 64.3% graduates 2003-2009 remained steady across both institutions, in contrast to the perception of a decline. Enrollment in Selected Groups of Schools3 Percent of Total Initial For-profit institutions are not playing as large a role College Enrollment as perceived by stakeholders Local HBCUs3 4.8% Despite concerns raised in the landscape scan in Philadelphia about the growing role of for-profit colleges, PASSHE System3 14.6% only 1.4% of first enrollments were at the largest for- University of Phoenix 1.4% profit institution, University of Phoenix. 1Based on school where the student is first enrolled. 2IncludesPenn State main campus and satellite campuses. 3See Appendix for a list of Pennsylvania State System of Higher Education (PASSHE) schools and local Historically Black Colleges and Universities (HBCUs). 18
- 19. Are There Differences in College Enrollment by: Race/Ethnicity? Caucasian and Asian students were more likely to enroll in college and more likely to have enrolled immediately following high school than African-American and Hispanic students, largely mirroring national disparity patterns. College Enrollment Among Each Race/Ethnicity, 2003-2009 Some National Context: 80.0% 2007 National College 70.0% Enrollment Rates1 60.0% In 2007, the immediate college enrollment rate was: Percent Enrolled 50.0% 70% for White high school 40.0% completers 73.0% 56% for Black high school 63.9% 30.0% 56.9% completers 46.1% 47.3% 61% for Hispanic high school 20.0% 33.3% 35.8% completers 25.2% 10.0% 0.0% African American Caucasian Hispanic Asian Race/Ethnicity Ever enrolled in college Immediately enrolled in college 1Planty, M., Kena, G., Hannes, G. (Eds.). (2009). The Condition of Education 2009 in Brief (NCES 2009-082). Washington DC: National Center for Education Statistics, Institute of Education Sciences, U.S. Department of Education. (Asian student enrollment was not included.) 19
- 20. Are There Differences in College Enrollment by: Race/Ethnicity? Hispanic and African-American students are more likely to attend two-year colleges and public colleges than Caucasian and Asian students, starting on a trajectory with lower graduation rates. Nationally, college completion is typically lower at two-year and public colleges than at four-year and private institutions. Attendance at Two-Year and Four-Year Institutions By Race/Ethnicity, 2003-2009 Who Enrolls at Two- and Four-Year Colleges? Asian 29.7% 70.1% Asian students are less likely to attend a two-year college. Hispanic students are Race/Ethnicity more likely to attend a two-year college. Hispanic 48.0% 49.8% In the landscape scan, stakeholders raised concerns about Latino college enrollment rates, Caucasian 36.4% 62.9% indicating that often families want students to stay close to home and contribute to the family African American 38.5% 60.7% income. Higher two-year enrollment rates among Latinos might be an indicator of this trend. 0% 10% 20% 30% 40% 50% 60% 70% 80% 90% 100% Distribution of College Enrollment by Race/Ethnicity Public Private Two-year Four-year African American 79.1% 20.9% Fewer African- Caucasian 70.7% 29.3% American students are enrolling in private Hispanic 72.1% 27.9% colleges. Asian 75.9% 24.1% 20
- 21. Are There Differences in College Enrollment by: Gender? Philadelphia’s college enrollment by gender reflects national trends. Nationally, for the past two decades, women have comprised the majority of 18- to 24-year-old college students.1 Male Female Where Are Male and Female 2003-2009 Philadelphia Never Enrolled 56.7% 47.1% Public High School Graduates Enrolling? Ever Enrolled 43.3% 52.9% There are no differences in the types of colleges Immediately 32.3% 40.4% (public/private, two-year/four-year, in-state/out-of-state) Enrolled that males and females attend. Female Philadelphia public high school graduates are more likely to enroll in college than males and, when they do, are more likely to do so immediately. 1 Taylor, P., Fry, R., Wang, W., Dockterman, D., Velasco, G. (2009). College Enrollment Hits All-Time High, Fueled by Community College Surge. Washington, DC: Pew Research Center. 21
- 22. Are There Differences in College Enrollment by: Receipt of TANF Benefits? Students who received TANF were much less likely to ever enroll in college, and substantially less likely to enroll in college immediately following high school. National research and the Philadelphia graduation data demonstrate that immediately enrolling in college (rather than delaying) increases a student’s chances of graduating college. College Enrollment Among Students Receiving TANF vs. Students Not Receiving TANF, 2003-2009 70 Where Are They Enrolling? 60 50 A higher proportion of students who receive TANF Percen t En ro lled 40 and enroll in college attend 30 62.3% two-year colleges than their 47.7% 20 40.4% non-TANF receiving peers 10 26.2% (42.9% vs. 36.8%). 11.5% 11.9% 0 Never enrolled in college Immediately enrolled in college Delayed enrollment Students who do not receive Received TANF Did not receive TANF TANF are slightly more likely to enroll in a private institution than their peers (23.9% vs. 21.5%). Although a broader range of barriers to college access, such as academic readiness, are being recognized and addressed in Philadelphia, these data point to the fact that financial access to college is still a major concern. 22
- 23. Are There Differences in College Enrollment by: High School Type? Distribution of Two-Year and Four-Year College Attendance Among College Enrollees by Their Different High School Types, 2003-2009 In the aggregate, citywide and neighborhood high 100% schools have somewhat comparable enrollment 90% rates; however, the focus of citywide schools varies 80% 28.7% considerably. 51.8% Percent Enrolled 70% 55.0% 60% 79.4% Half of the citywide schools are focused on career and 50% technical education (CTE) for occupations that often 40% 68.7% 30% require credentialing or certificates not necessarily 47.0% 43.9% 20% associated with colleges. 20.5% 10% 0% Neighborhood Citywide Magnet Alternative College Enrollment Among Graduates of Different High School Types High School Type Attended, 2003-2009 Two-year Four-year 90% 80% 70% Magnet school graduates are the most likely to Percent Enrolled 60% 50% enroll in college at any time and immediately after 40% 79.4% high school. 69.9% 30% 46.8% 20% 41.0% 28.1% 33.6% Magnet schools were among those most widely cited 10% 19.7% 0% 9.9% in our landscape interviews as examples of Ever enrolled in college Immediately enrolled in college Philadelphia high schools with a “college-going College Enrollm ent culture.” Neighborhood Cityw ide Magnet Alternative 23
- 24. III. What Are the College Retention Patterns of Philadelphia Public High School Graduates? Philadelphia public school graduates who immediately enrolled in college1 the fall after high school graduation were more likely to be retained in college one year later than students who delayed enrollment; this is consistent with national studies.2 Retention in Any College Among Students Who Immediately Enrolled in College vs. Delayed Enrollment, 2003-2008* 100% 90% 23.9% Some National Context: National Retention Rates3 80% 52.3% Percent Retained 70% 60% Nationally, 59% of students who 50% 40% enrolled in college in 2003-2004 76.1% 30% were still enrolled 9 months later. 20% 47.7% 10% 0% Immediate enrollment Delayed enrollment Retained Not retained * Full-time and part-time students retained at any college. 1 Henceforth in this report, retention and graduation rates will focus on the students who immediately enrolled; this allows for commensurability with the work of college access and success partners, as well as with national reporting standards. Immediate enrollment is defined as enrollment in the first fall after high school graduation. 2 Berkner, L., and Choy, S. (2008). Descriptive Summary of 2003–04 Beginning Postsecondary Students: Three Years Later (NCES 2008-174). Washington, DC: National Center for Education Statistics, Institute of Education Sciences, U.S. Department of Education. 3 National Center for Education Statistics. 2003-04 Beginning Postsecondary Students Longitudinal Study, First Follow-up (BPS:04/06). Measures full-time students enrolled in one institution only and may include students who delayed enrollment. Washington, DC: US Department of Education. 24
- 25. What Are the College Retention Patterns for Different College Types Attended? Students who immediately enrolled1 in four-year institutions were more likely to remain in college one year later than students who immediately enrolled in two-year colleges; this trend was the same although less pronounced between immediate private vs. public enrollees and is also consistent with national retention rates. There was little difference in retention between those who attended in-state vs. out-of-state colleges. Retention in College from Year One to Year Two by College Attributes, Among Students Who Immediately Enrolled, 2003-2008 In the landscape scan, stakeholders raised Out-of-state 75.2% concerns about two-year and specifically community college retention rates. It is In-state 76.2% important to note that students entering community colleges often have different College Attribute expectations and goals for their Four-year 81.2% postsecondary education (such as career- Two-year 63.8% related credentialing, transferring to a four- year institution, and non-degree programs) and different life circumstances (e.g., more Private 78.80% likely to have full-time jobs and/or children, 2 or may lack preparedness) than those Public 75.2% entering four-year institutions. 0.0% 20.0% 40.0% 60.0% 80.0% 100.0% Percent Retained 1 Immediate enrollment is defined as enrollment in the first fall after high school graduation. 2 Pennsylvania has four quasi-public schools: Lincoln, Pennsylvania State, Temple, and Pittsburgh universities. Founded as private institutions, each receives a yearly appropriation from the Pennsylvania legislature. They are all considered public universities by the National Student Clearinghouse and are analyzed according to NSC classifications. 25
- 26. How Does College Retention Differ by: Race/Ethnicity? Hispanic and African-American students who immediately enrolled were least likely to be retained in college one year later and Asian students were most likely to be retained. This is consistent with national trends.1 Retention in College from Year One to Year Two Among Students Who Immediately Enrolled, by Race/Ethnicity, 2003-2008 120.0 As students in an urban school 100.0 17.4 11.3 district, Philadelphia public high Percent Retained 80.0 28.1 30.1 school graduates attending 60.0 college are more likely to be 40.0 82.6 88.7 low-income, first-generation 71.9 69.9 20.0 college students. This group has lower retention rates than 0.0 African American Caucasian Hispanic Asian their non-low-income, non-first- Race/Ethnicity generation peers.2 Retained 1 year Not retained 1Seidman, A. (2005). “Minority student retention: Resources for practitioners.” In Minority Retention: What Works? Ed. G.H. Gaither, 7-24. San Francisco, CA: Jossey-Bass. 2Moving Beyond Access: College Success for Low-Income, First-Generation Students. (2008). Washington DC: The Pell Institute for the Study of Opportunity in Higher Education. 26
- 27. How Does College Retention Differ by: Other Student Characteristics? Retention in College from Year One to Year Two Among Students Who Immediately Enrolled, by Gender, 2003-2008 Female Philadelphia public high 100.0 school graduates who immediately 90.0 80.0 enrolled in college were slightly more likely to remain enrolled in Percent Retained 70.0 60.0 college than males who immediately 50.0 40.0 enrolled. 75.2% 76.7% 30.0 20.0 10.0 0.0 Male Female Gender Retention in College from Year One to Year Two Among Students Who Immediately Enrolled, by TANF Status, 2003-2008 100.0 90.0 80.0 Percent Retained Nationally, low-income students who 70.0 60.0 immediately enrolled were less likely 50.0 to be retained in college one year 40.0 69.3% 77.5% later. 30.0 20.0 10.0 0.0 Received TANF Did not receive TANF TANF Status 27
- 28. How Does College Retention Differ by: High School Type? Graduates from magnet schools are retained in college at a higher rate than students who graduated from other school types. Magnet schools are the most selective of Philadelphia public schools, accepting students with a record of strong academics and high attendance. Graduates of citywide schools, which are also selective, are retained at a similar rate as graduates of neighborhood schools. Retention in College from Year One to Year Two Among Students Who Immediately Enrolled, by High School Type, 2003-2008 90.0 80.0 70.0 Percent Retained 60.0 50.0 40.0 83.3% 72.7% 69.6% 30.0 48.6% 20.0 10.0 0.0 Neighborhood Citywide Magnet Alternative High School Type 28
- 29. How Many Students Who Start at Local Colleges Are Retained in Any College One Year Later? Temple University has a higher retention rate of students who immediately enrolled compared with other local four-year colleges. As a two-year institution, CCP accepts students who may be much less prepared academically for college and therefore are less likely to persist. Retention at Local Colleges from Year One to Year Two Among Students Who Immediately Enrolled, by Institution First Enrolled, 2003-20081 100% Some National Context: 90% Retention Patterns at 80% Community Colleges from P e rc e n t R e t a in e d 70% 2004-20052 60% Nationally, 9-month retention rates 50% 92.0% for first-time students were 48% for 40% 81.0% 79.7% 63.9% 71.9% two-year public colleges vs. 82% at 30% four-year public colleges. 20% 10% 0% Penn State Temple University Community College PASSHE HBCU University of Philadelphia College in Which Student Was First Enrolled 1Philadelphiadata include both full-time and part-time students as well as those concurrently enrolled at another institution. 2NationalCenter for Education Statistics. 2003-04 Beginning Postsecondary Students Longitudinal Study, First Follow-up (BPS:04/06). Washington, DC: US Department of Education. (Measures full time students enrolled in one institution only.) 29
- 30. What Are the Enrollment and Transfer Patterns of Philadelphia Public High School Graduates? Sixty-eight percent (68%) of 2003-2008 graduates who immediately enrolled in the fall following graduation attended only one postsecondary institution while 26% attended two institutions (under 6% attended three or more). Of those who attended two institutions, transfers were more common from four-year to two-year institutions than from two-year to four-year institutions, pointing to variation in students’ college pathways and the need for flexible supports to aid students on the path to college completion. Enrollment and Transfer Patterns of Students Who Immediately Enrolled and Attended Two Colleges, 2003-2008 Two-year Colleges Serve an Important Function for Students Who Immediately Enroll and Then Transfer 21% Two-year colleges are both a springboard to a four-year institution 22% and an alternative to continue education for students who leave a four-year institution. 4% Fifteen percent (15%) of those who attended two colleges were classified as having transferred from a two-year to a four-year institution. 15% 39% More than 20% transferred from a four-year to a two-year institution. Nearly 40% of students who attended two colleges had 2-year to 4-year 2-year to 2-year 4-year to 2-year concurrent enrollment, meaning they had enrollment activity at 4-year to 4-year Concurrent enrollment both colleges but did not transfer. An example would be a student who takes a summer class at a different institution, in many cases a two-year college. 30
- 31. What Are the Enrollment and Transfer Patterns of Students Who Have Ever Attended CCP?1 More students transferred from a four-year institution to CCP rather than from CCP to a four-year institution, indicating that CCP plays a significant role as an alternative for students who leave a four-year institution. Nearly half of the students who enrolled at CCP and another college were concurrently enrolled, suggesting they supplemented their education with classes at CCP. Enrollment and Transfer Patterns of Students Who Immediately Enrolled and Attended CCP and One Other School, 2003-2008 These data are consistent with local perceptions of community colleges 30% and specifically CCP as cited in the landscape scan. Community colleges 1% often serve as an alternate pathway for students who struggle financially, academically, or socially in a four-year college and/or as a lower-cost option for supplementing courses at more 21% expensive colleges and universities. CCP is affordable and convenient for 43% many individuals, and may better serve specific career needs. 4% CCP to two-year CCP to four-year Four-year to CCP Two-year to CCP Concurrent enrollment 1Among 2003-2008 Philadelphia public high school graduates who immediately enrolled in first fall semester following graduation. 31
- 32. IV: What Are the College Graduation Patterns of Philadelphia Public High School Graduates? Philadelphia completion rates for associate’s degrees are significantly lower than completion rates for bachelor’s degrees among students who immediately enrolled in college. College Graduation Rates of Philadelphia 2003 High School What percent of Philadelphia 2003 Graduates Who Immediately Enrolled public high school graduates earn degrees from public and private Associate’s degree in three years among 4.3%1 colleges? students who started at a two-year Philadelphia public high school college graduates who immediately enrolled and attended private colleges were more Bachelor’s degree in six years among 52.4% likely to graduate than students who students who started at a four-year immediately enrolled and attended public college colleges (62.9% vs. 40.2%). What percent of Philadelphia 2003 Some National Context: public high school graduates who attend CCP (starting at any type of • 9% of students first attending a public two-year institution obtained an associate’s institution) earn a degree? degree within two years.2 • 56% of full-time students first attending any four-year institution obtained a Among 2003 graduates who attended bachelor’s degree within six years.3 CCP in the first fall following high school graduation, 19% obtained an associate’s or bachelor’s degree within six years. 1 Includes students who were concurrently enrolled at another institution. 2 National Center for Education Statistics. 2003-04 Beginning Postsecondary Students Longitudinal Study, First Follow-up (BPS:04/06). Washington, DC: US Department of Education. (Excludes students who are concurrently enrolled in other institutions.) 3 The National Center for Higher Education Management System. Progress and Completion: Graduation Rates for 2007. www.higheredinfo.org. 32
- 33. How Does College Graduation Differ by: Race/Ethnicity? Among students whose initial, immediate enrollment is at either a two- or four-year institution, graduation rates appear to segment into two groups with graduation rates at nearly 60 percent for Caucasian and Asian students who immediately enrolled and above 37 percent for African-American and Hispanic students who immediately enrolled in college after high school graduation. College Graduation With Any Type of Degree Among Those Who Immediately Enrolled, by Race/Ethnicity, 2003 Percent of students immediately enrolled in college who completed, 2003* 100% Associate’s Bachelor’s 90% 80% Degree Degree 41.0% 40.0% Percent Graduated 70% 62.8% 62.4% African American 4.4% 33.5% 60% 50% Caucasian 6.0% 54.5% 40% 30% 59.0% 60.0% Hispanic 6.5% 32.1% 20% 37.2% 37.6% Asian 5.5% 55.6% 10% 0% * A portion of students may have more than one degree and African American Caucasian Hispanic Asian could be represented in more than one degree type completed. Race/Ethnicity Graduated Did not graduate How does degree attainment differ by race nationally?1 Six in ten White students earn bachelor’s degrees within six years, compared with only about four in ten minority students. 1 TheEducation Trust. (2009). Charting a Necessary Path: The Baseline Report of Public Higher Education Systems in the Access to Success Initiative. www.edtrust.org/sites/edtrust.org/files/publications/files/NASH- EdTrust.BaselineReport.pdf (denominator is first-time, full-time freshmen, and may include those who delayed enrollment). 33
- 34. How Does College Graduation Differ by: Gender? Among students whose initial enrollment is at either a two- or four-year institution, females who immediately enrolled in college are more likely to graduate with any kind of degree than males who immediately enrolled, consistent with national studies. Of both males and females who do graduate, the majority receive a bachelor’s degree. Percent of Philadelphia public high school graduates immediately enrolled in college College Graduation With Any Type of Degree Among Students Who who completed, 2003* Immediately Enrolled, by Gender, 2003 Associate’s Bachelor’s 100% Male 3.5% 36.3% 90% 80% Female 6.1% 44.0% Percent Graduated 51.0% * A portion of students may have more than one degree and 70% 59.9% 60% could be represented in more than one degree type completed. 50% . 40% 30% How Does College Graduation Differ by 20% 40.1% 49.0% Gender Nationally?1 10% 0% Nationally, the number of females Male Female completing associate’s, bachelor’s, and master’s degrees has exceeded the Gender number of males for two decades. Graduated Did not graduate Between 1997 and 2007, the number of females receiving bachelor’s degrees has increased by 34% while the number of males has increased by 25%. 1Snyder, T.D., Dillow, S.A., and Hoffman, C.M. (2009). Digest of Education Statistics 2008 (NCES 2009-020). Washington, DC: National Center for Education Statistics, Institute of Education Sciences, U.S. Department of Education. 34