Best Rate (Hyderabad) Call Girls Jahanuma ⟟ 8250192130 ⟟ High Class Call Girl...
Asco2011 information in hcc
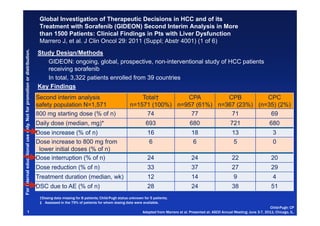
1. Global Investigation of Therapeutic Decisions in HCC and of its
Treatment with Sorafenib (GIDEON) Second Interim Analysis in More
than 1500 Patients: Clinical Findings in Pts with Liver Dysfunction
g y
Marrero J, et al. J Clin Oncol 29: 2011 (Suppl; Abstr 4001) (1 of 6)
bution.
Study Design/Methods
GIDEON: ongoing global prospective, non interventional study of HCC patients
ongoing, global, prospective non-interventional
ducational us only. Not for promotio or distrib
receiving sorafenib
In total, 3,322 patients enrolled from 39 countries
on
Key Findings
Second interim analysis Total† CPA CPB CPC
safety population N=1,571 n=1571 (100%) n=957 (61%) n=367 (23%) (n=35) (2%)
800 mg starting dose (% of n) 74 77 71 69
Daily dose (median, mg)* 693 680 721 680
Dose increase (% of n) 16 18 13 3
se
Dose increase to 800 mg from 6 6 5 0
lower initial doses (% of n)
Dose interruption (% of n) 24 24 22 20
Fo internal ed
Dose reduction (% of n) 33 37 27 29
Treatment duration (median, wk) 12 14 9 4
DSC due to AE (% of n) 28 24 38 51
or
†Dosing data missing for 8 patients; Child-Pugh status unknown for 5 patients;
‡ Assessed in the 79% of patients for whom dosing data were available.
Child-Pugh: CP
1 Adapted from Marrero et al. Presented at: ASCO Annual Meeting; June 3-7, 2011; Chicago, IL.
2. Global Investigation of Therapeutic Decisions in HCC and of its
Treatment with Sorafenib (GIDEON) Second Interim Analysis in More
than 1500 Patients: Clinical Findings in Pts with Liver Dysfunction
g y
Marrero J, et al. J Clin Oncol 29: 2011 (Suppl; Abstr 4001)
bution.
Study Design/Methods
GIDEON: ongoing global prospective, non interventional study of HCC patients
ongoing, global, prospective non-interventional
ducational us only. Not for promotio or distrib
receiving sorafenib
In total, 3,322 patients enrolled from 39 countries
on
Key Findings
Second interim analysis Total† CPA CPB CPC
safety population N=1,571 n=1571 (100%) n=957 (61%) n=367 (23%) (n=35) (2%)
800 mg starting dose (% of n) 74 77 71 69
Daily dose (median, mg)* 693 680 721 680
Dose increase (% of n) 16 18 13 3
se
Dose increase to 800 mg from 6 6 5 0
lower initial doses (% of n)
Dose interruption (% of n) 24 24 22 20
Fo internal ed
Dose reduction (% of n) 33 37 27 29
Treatment duration (median, wk) 12 14 9 4
DSC due to any AE (% of n) 28 24 38 51
or
†Dosing data missing for 8 patients; Child-Pugh status unknown for 5 patients;
‡ Assessed in the 79% of patients for whom dosing data were available.
Child-Pugh: CP
2 Adapted from Marrero et al. Presented at: ASCO Annual Meeting; June 3-7, 2011; Chicago, IL.
3. Global Investigation of Therapeutic Decisions in HCC and of its
Treatment with Sorafenib (GIDEON) Second Interim Analysis in More
than 1500 Patients: Clinical Findings in Pts with Liver Dysfunction
Marrero J, et al. J Clin Oncol 29: 2011 (Suppl; Abstr 4001)
bution.
ducational us only. Not for promotio or distrib
Total
Treatment-Emergent Drug- Any Total CPA CPB CPC
Related AEs by Child-Pugh Grade G3/G4 (<7) (7-9) (>9)
on
Status*,† (% of n) (n=1571) (n=1571) (n=957) (n=367) (n=35)
Diarrhea 25 3/0 26 23 9
HFSR 24 5/0 29 15 3
Fatigue 14 3/<1 15 11 17
Rash/desquamation 12 2/<1 13 10 6
se
Anorexia
A i 9 1/0 10 8 3
Hypertension 7 2/0 9 3 0
Alopecia 6 0/0 8 3 3
Fo internal ed
Nausea 6 <1/0 5 5 6
Weight loss 5 <1/0 5 4 3
or
Pain, abdomen
Pain abdomen, NOS 3 <1/0 3 4 6
* Incidence ≥5% in any group and any Grade; † At start of therapy.
HFSR=hand-foot skin reaction; NOS=not otherwise specified.
3 Adapted from Marrero JA et al. Presented at: ASCO Annual Meeting; June 3-7, 2011; Chicago, IL.
4. Global Investigation of Therapeutic Decisions in HCC and of its
Treatment with Sorafenib (GIDEON) Second Interim Analysis in More
than 1500 Patients: Clinical Findings in Pts with Liver Dysfunction
Marrero J, et al. J Clin Oncol 29: 2011 (Suppl; Abstr 4001)
bution.
ducational us only. Not for promotio or distrib
Cause of death*,† within Child-Pugh A║ Child-Pugh B║ Child-Pugh C
on
30 days of discontinuing Total§ (<7) (7-9) (>9)
therapy‡ n (%) deaths (n=343) (n=154) (n=125) (n=13)
HCC-related 138 (40) 61 (40) 50 (40) 4 (31)
HCC- and liver-related 38 (11) 15 (10) 15 (12) 3 (23)
HCC- and liver-related,
9 (3) 4 (3) 2 (2) 1 (8)
se
and MOF
Liver-related 49 (14) 22 (14) 18 (14) 2 (15)
HCC-related and MOF 15 (4)
( ) 8 (5)
( ) 4 (3)
( ) 0
Fo internal ed
MOF 22 (6) 10 (6) 8 (6) 1 (8)
or
* Incidence >2% in total group; † Patients may be included in more than one cause of death category; ‡ By Child-Pugh status at study entry; § Child-Pugh
status missing for 1 patient; ║ Data missing for 7 Child-Pugh A and 7 Child-Pugh B patients.
MOF=multiorgan system failure.
4 Adapted from Marrero JA et al. Presented at: ASCO Annual Meeting; June 3-7, 2011; Chicago, IL.
5. Global Investigation of Therapeutic Decisions in HCC and of its
Treatment with Sorafenib (GIDEON) Second Interim Analysis in More
than 1500 Patients: Clinical Findings in Pts with Liver Dysfunction
Marrero J, et al. J Clin Oncol 29: 2011 (Suppl; Abstr 4001) (4 of 6)
bution.
Child-Pugh A (<7) Child-Pugh B (7-9) Child-Pugh C (>9)
ducational us only. Not for promotio or distrib
(n=984),
( 984) median (95% CI)
di (n=376),
( 376) median (95%
di (n=36),
( 36) median (95%
di
312 (284, 341) days CI) 147 (126, 189) days CI) 62 (46, 94) days
10.3 months 4.8 months 2.0 months
1.0
on
0.9
Survival distributio function
Preliminary Overall Survival
0.8 by Child-Pugh Status* at Study Entry
0.7
on
0.6
0.5
0.4
se
0.3
0.2
0.1
Fo internal ed
0.0
0 100 200 300 400 500 600
Time since start of treatment (days)
or
* 207 patients not evaluable.
CI=confidence interval.
5 Adapted from Marrero JA et al. Presented at: ASCO Annual Meeting; June 3-7, 2011; Chicago, IL.
6. Global Investigation of Therapeutic Decisions in HCC and of its
Treatment with Sorafenib (GIDEON) Second Interim Analysis in More
than 1500 Patients: Clinical Findings in Pts with Liver Dysfunction
g y
Marrero J, et al. J Clin Oncol 29: 2011 (Suppl; Abstr 4001) (6 of 6)
bution.
Conclusions
ducational us only. Not for promotio or distrib
Based on the second interim analysis, there is no evidence suggesting that treating
physicians use a different dosing strategy for Child-Pugh B patients compared with
Child-Pugh A patients
on
Duration of sorafenib therapy was shorter in Child-Pugh B patients than in Child-Pugh
A patients
Compared with Child-Pugh A patients, Child-Pugh B patients did not have a higher
incidence of drug-related AEs, but had a higher incidence of liver-associated AEs
In patients with moderate liver dysfunction, no unexpected AEs were observed
The vast majority of deaths were due to HCC or underlying liver disorders
se
The differences in patient outcomes across Child-Pugh groups likely reflect differences
in prognosis
Consistent with previously reported studies, these preliminary data indicate that Child-
Pugh t t
P h status appears to be a useful prognostic factor for overall survival
t b f l ti f t f ll i l
Fo internal ed
The GIDEON study is ongoing, and the safety, tolerability, and efficacy of sorafenib in
HCC patients will continue to be evaluated
or
6
7. Phase III Trial of Sunitinib versus Sorafenib in Advanced HCC
Cheng A, et al J Clin Oncol 29: 2011 (Suppl; Abstr 4000) (1 of 12)
bution.
Study Design/Methods
y g
ducational us only. Not for promotio or distrib
Open label, Phase III
study, comparing
efficacy and safety of
on
sorafenib compared t
f ib d to
sunitinib
The study was stopped after a planned safety review by an independent data
se
monitoring committee (events: 457 deaths)
– Higher incidence of serious adverse events (AEs) with sunitinib resulted in an
unfavorable risk-benefit relationship vs sorafenib
Fo internal ed
Enrollment was halted after 1074 patients had been randomized from July 2008 to
May 2010
Sunitinib discontinuation recommended and treatment changed to standard of care
or
CDD=continuous daily dosing; ECOG PS=Eastern Cooperative Oncology Group performance status; PFS=progression-free survival;
TACE=transarterial chemoembolization.
7 Adapted from Cheng A et al. Presented at: ASCO Annual Meeting; June 3-7, 2011; Chicago, IL.
8. Phase III Trial of Sunitinib versus Sorafenib in Advanced HCC
Cheng A, et al J Clin Oncol 29: 2011 (Suppl; Abstr 4000) (2 of 12)
OS – Primary Endpoint
bution.
(ITT Population) Sunitinib
Median 7 9 months (95% CI: 7 4 9 2)
7.9 7.4-9.2)
ducational us only. Not for promotio or distrib
1.00
Sorafenib
Median 10.2 months (95% CI: 8.9-11.4)
obability (%)
on
0.75
HR 1 30 (95% CI 1 13 1 50)
1.30 CI: 1.13-1.50)
P=.0010
0.50
OS pro
0.25
se
0.0
0 5 10 15 20 25 30 35 40
Fo internal ed
Patients at risk Time (months)
Sunitinib 530 354 208 112 41 8 0 0 0
Sorafenib 544 388 245 139 61 12 1 0 0
or
P-value based on stratified log-rank test.
CI=confidence interval; HR=hazard ratio.
8 Adapted from Cheng A et al. Presented at: ASCO Annual Meeting; June 3-7, 2011; Chicago, IL.
9. Phase III Trial of Sunitinib versus Sorafenib in Advanced HCC
Cheng A, et al J Clin Oncol 29: 2011 (Suppl; Abstr 4000) (5 of 12)
bution.
Sunitinib Sorafenib Hazard ratio
(n 530)
(n=530) (n 544)
(n=544) (95% CI) P value
P-value*
ducational us only. Not for promotio or distrib
Median OS (months), ITT 7.9 10.2 1.30 (1.13-1.50) .0010
Asian regions† 7.7 8.8 1.21 (1.03-1.42) .0171
on
Ex-Asian regions‡ 9.3 15.1 1.64 (1.20-2.26) .0036
Median PFS (months), ITT 3.6 3.0 1.13 (0.99-1.30) .1215
Asian regions 2.9 2.8 1.03 (0.88-1.20) .3930
Ex-Asian regions 4.2 5.6 1.46 (1.07-2.00) .0182
se
TTP (months), ITT
( th ) 4.1
41 3.8
38 1.13 (0.98-1.31)
1 13 (0 98 1 31) .1688
1688
Asian regions 4.0 2.8 1.03 (0.88-1.21) .3850
Ex Asian
Ex-Asian regions 5.0
50 6.1
61 1.41 (1.00 1.99)
1 41 (1 00-1 99) .0495
0495
Fo internal ed
or
Ex-Asian regions=regions excluding Asia; ITT population (sunitinib=529; sorafenib=544).
* P-value based on stratified log-rank test; †Asian population: sunitinib=402, sorafenib=410; ‡Ex-Asian population: sunitinib=127,
sorafenib=134.
9 Adapted from Cheng A et al. Presented at: ASCO Annual Meeting; June 3-7, 2011; Chicago, IL.
10. Phase III Trial of Sunitinib versus Sorafenib in Advanced HCC
Cheng A, et al J Clin Oncol 29: 2011 (Suppl; Abstr 4000) (6 of 12)
bution.
ITT Population
1.00
OS in Patients With HBV Infection
ducational us only. Not for promotio or distrib
(Exploratory Analysis) Sunitinib (n=290)
Median 7.6 months
0.75
(95% CI: 6.7-8.6)
on
%)
OS probability (%
Sorafenib (n=288)
0.50 Median 8.0 months
(95% CI: 6.8-9.1)
S
HR 1.10 (95% CI: 0.92-1.33)
0.25
P=.1714
se
0.00
0 00
0 5 10 15 20 25 30 35 40
Time (months)
Fo internal ed
Sunitinib Sorafenib Sunitinib Sorafenib Sunitinib Sorafenib
ITT ITT Asia Asia Ex-Asia Ex-Asia
Median OS, months 7.6 8.0 7.6 7.9 7.9 15.3
HR (95% CI) 1.10 (0.92 1.33)
1 10 (0 92-1 33) 1.10 (0.91 1.33)
1 10 (0 91-1 33) 1.08 (0.49 2.36)
1 08 (0 49-2 36)
or
P-value (1-sided) .1714 .1844 .3749
P-values based on stratified log-rank test.
10 Adapted from Cheng A et al. Presented at: ASCO Annual Meeting; June 3-7, 2011; Chicago, IL.
11. Phase III Trial of Sunitinib versus Sorafenib in Advanced HCC
Cheng A, et al J Clin Oncol 29: 2011 (Suppl; Abstr 4000) (8 of 12)
bution.
OS in Patients With HCV Infection ITT Population
1.00
( p o ato y
(Exploratory Analysis)
a ys s)
Sunitinib ( 113)
S iti ib (n=113)
ducational us only. Not for promotio or distrib
Median 9.2 months
0.75 (95% CI: 7.0-12.0)
Sorafenib (n=119)
on
%)
OS probability (%
Median 17.6 months
0.50 (95% CI: 11.4-20.1)
HR 1.52 (95% CI: 1.09-2.13)
P=.0165
S
0.25
se
0.00
0 00
0 5 10 15 20 25 30
Time (months)
Fo internal ed
Sunitinib Sorafenib Sunitinib Sorafenib Sunitinib Sorafenib
ITT ITT Asia Asia Ex-Asia ex-Asia
Median OS, months 9.2 17.6 9.7 12.6 8.6 18.3
HR (95% CI) 1.52 (1.09 2.13)
1 52 (1 09-2 13) 1.40 (0.92 2.14)
1 40 (0 92-2 14) 1.76 (0.99 3.10)
1 76 (0 99-3 10)
or
P-value (1-sided) .0165 .0721 .0544
P-values based on stratified log-rank test.
11 Adapted from Cheng A et al. Presented at: ASCO Annual Meeting; June 3-7, 2011; Chicago, IL.
12. Most Common Treatment-Emergent AEs
Phase III Trial of Sunitinib >5% of Patients; As-Treated Population)
(Grade* 3 or 4 in versus Sorafenib in Advanced HCC
Cheng A, et al J Clin Oncol 29: 2011 (Suppl; Abstr 4000) (9 of 12)
Sunitinib (%; n=526)
( ) Sorafenib (%; n=541)
( )
Hematologic AEs Grade 3 Grade 4 Grade 3 Grade 4
Thrombocytopenia 24 6 4 1
Neutropenia 23 2 2 <1
Leukopenia 12 1 <1 0
Anemia 6 3 3 1
Nonhematologic AEs
Hand-foot syndrome 13 0 21 <1
Increased AST 8 <1 9 <1
Diarrhea 7 <1 9 0
Fatigue 6 <1 4 <1
Asthenia 6 <1 4 0
Decreased appetite 6 0 4 0
* National Cancer Institute—Common Terminology Criteria for AEs (NCI-CTCAE) v3.0.
AST=aspartate aminotransferase.
Adapted from Cheng A et al. Presented at: ASCO Annual Meeting; June 3-7, 2011; Chicago, IL.
12
13. Bleeding AEs
Phase III Trial of Sunitinib versus Sorafenib in Advanced HCC
(All Causes; As-Treated Population)
Cheng A, et al J Clin Oncol 29: 2011 (Suppl; Abstr 4000) (10 of 12)
g , ( pp ; )( )
Grade* (%)
Sunitinib Sorafenib
(n=526) (n=542)
All G3/4 G5 All G3/4 G5
Any bleeding 37 10 2 20 4 1
Selected bleeding sites
Gastrointestinal
G t i t ti l 18 7 1 12 4 <1
1
Hepatic tumor 1 <1 <1 <1 <1 0
* NCI-CTCAE v3.0.
G=grade.
Adapted from Cheng A et al. Presented at: ASCO Annual Meeting; June 3-7, 2011; Chicago, IL. 13
14. Deaths on Study*
Phase III Trial of Sunitinib versus Sorafenib in Advanced HCC
(All Causes; As-Treated Population)
Cheng A, et al J Clin Oncol 29: 2011 (Suppl; Abstr 4000) (11 of 12)
g , ( pp ; )( )
Sunitinib Sorafenib
Event (n=526) (n=542)
Deaths (all causes; n, %) 92 (17%) 83 (15%)
Cause (% of total deaths: SU n=92; SO n 83)†
n 92; n=83)
Disease progression 76% 86%
Toxicity 18% 2%
Dehydration
D h d ti ± organ f il
failure 3% 0
CNS hemorrhage 3% 0
Esophageal varices/GI hemorrhage† 3% 1%
Other/unknown cause 7% 13%
Pneumonia 2% 1%
Septic shock/sepsis 1% 2%
Unknown reason 0 2%
* Deaths during the study or within 28 days after the last dose of study medication. Participants may have more
than one cause of death; †Includes deaths attributed to tumor hemorrhage.
CNS=central nervous system; GI=gastrointestinal; SU=sunitinib; SO=sorafenib.
Adapted from Cheng A et al. Presented at: ASCO Annual Meeting; June 3-7, 2011; Chicago, IL. 14
15. Phase III Trial of Sunitinib versus Sorafenib in Advanced HCC
Cheng A, et al J Clin Oncol 29: 2011 (Suppl; Abstr 4000) ( of 12)
g , ( pp ; ) (12 )
Conclusions
Sunitinib did not demonstrate superiority or noninferiority in OS, compared with
sorafenib in patients with advanced HCC
p
PFS, TTP, and ORR were comparable between treatment arms
Frequency and severity of AEs were higher with sunitinib than sorafenib
In patients with HBV infection, OS was similar between arms. In patients with HCV
infection, OS was significantly longer with sorafenib (17.6 vs 9.2 for sunitinib)
ORR=overall response rate.
Adapted from Cheng A et al. Presented at: ASCO Annual Meeting; June 3-7, 2011; Chicago, IL. 15
16. Baseline Patient Characteristics: Phase III Trial
of Su vs. So & Phase III SHARP & AP Data
vs
Phase III Su vs So SHARP AP
cational use only. Not for promotion or distribution.
Sor (n=299) Sor (n=150)
Sun (n=530) Sor (n=544)
Median age, years 59 59 64.9 51
HBV/HCV positive (%) 55/21 53/22 19/29a 70/10
Alcoholic liver disease (%) -- -- 26b --
Male (%) 82 84 87 84
Asian (%)
( ) 76 75 -- 100
r
ECOG PS 0/1/2 (%) 53/47- - 53/47/- - 54/38/8 25/69/5
Vascular invasion and/or Extrahepatic
79 76 70 36/69
spread* (%)
Child Pugh
Child-Pugh grade A/B (%) 100/0 100/0 95/5 97/2
o
BCLC stage B/C (%) 13/87 16/83 18/82 - -/95c
*Indirectly assessed from Independent Response Review Committee assessment; ‡Subjects may have received ≥1 therapy; a: Reported as “Cause of disease: Heptatitis B only or
Hepatitis C only”; b: reported as “Cause of disease – Alcohol only”; c: only BCLC C reported, no A/B; d: reported as “Locoregional therapy (TACE, PEI, RFA, RT) w/ RT was applied
to
t EH metastatic lesions in all pts except 5 sor & 3 pbo”; - -, not reported; BCLC B
t t ti l i i ll t t b ” t t d BCLC, Barcelona Cli i Li
l Clinic Liver C
Cancer; CLIP C
CLIP, Cancer of th Liver Italian P
f the Li It li Program ; ECOG Eastern
ECOG, E t
nternal educ
Cooperative Oncology Group ; HBV/HCV, hepatitis B/C virus.
Patients in this study had better performance status consistent with
For in
SHARP but less HBV than AP study
1. Adapted from Chang et al. Presented at: ASCO Annual Meeting; June 3-7, 2011; Chicago, IL.2. Llovet, et al. N Engl J Med
16 2008;359:378-90. 3. Cheng, et al. Lancet Oncol 2009; 10: 25–34.