
Empfohlen
Weitere ähnliche Inhalte
Kürzlich hochgeladen
Kürzlich hochgeladen (20)
Empfohlen
Empfohlen (20)
Getting Started with Firewatch Website
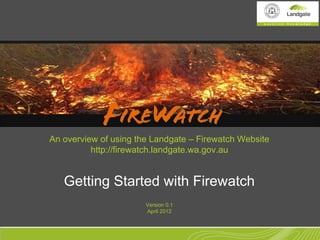
- 1. An overview of using the Landgate – Firewatch Website http://firewatch.landgate.wa.gov.au Getting Started with Firewatch Version 0.1 April 2012
- 2. •Start •Background •Viewing Firewatch •Viewing Fire Hotspots Getting Started with Firewatch •Zoom to your Area •View Fire Hotspot Info Background •View Satellite Imagery The Firewatch map service provides location information products for emergency •Calculate Burnt Areas services personnel via an online map application to help in the monitoring, management •Fuel loads and mitigation of bush fires over Australia. FireWatch provides access to terabytes of spatial information datasets derived from near real-time satellite imagery including: •Fire Hot Spots, •Satellite Imagery •Fire Burnt Areas (from 1997), •Vegetation Greenness images, •Lightning Strike Locations, and •Hourly Weather Observations (from the Bureau of Meteorology) + more …
- 3. •Start •Background •Viewing Firewatch •Viewing Fire Hotspots Getting Started with Firewatch •Zoom to your Area •View Fire Hotspot Info Viewing Firewatch •View Satellite Imagery In your internet browser type: http://firewatch.landgate.wa.gov.au •Calculate Burnt Areas •Fuel loads Click on “Firewatch Map Service – Public Access” to run Firewatch Subscriber Access: Subscriber access provides the ability to download the mapping information to your own computer and other customisations. This service is primarily designed for emergency management agency personnel however open to all for free. If you become a subscriber, it also helps Landgate to understand the demographics of who is using Firewatch. To become a subscriber please send an email to: ron.craig@landgate.wa.gov.au
- 4. •Start •Background •Viewing Firewatch •Viewing Fire Hotspots Getting Started with Firewatch •Zoom to your Area •View Fire Hotspot Info Viewing Fire Hotspots •View Satellite Imagery Your first view of Firewatch shows a map of •Calculate Burnt Areas Australia with coloured dots. •Fuel loads The coloured dots on the map are fire hotspots. The colours represent the time when the satellite mapped the fire hotspot. The image below explains what the colours mean in relation to what time the fire hotspot was mapped. For example red means that a fire hotspot was mapped between now and 12 hours ago. In the example image on the right, there are Many fires mapped and displayed. This shows in April, many farmers are burning off stubble in preparation for the new cropping season.
- 5. •Start •Background •Viewing Firewatch •Viewing Fire Hotspots Getting Started with Firewatch •Zoom to your Area •View Fire Hotspot Info Zoom to your area •View Satellite Imagery •Calculate Burnt Areas You may wish to zoom in to see if a fire is close •Fuel loads to an area of interest. To zoom in on your areas of interest use the zoom tool The zoom tool should already be selected by default when you first run Firewatch and ready to use. Simply draw a rectangle on your area to zoom in for a closer look. The position of the fire hotspots will be displayed with more detailed roads, town names and other mapping information to help determine where the fire is.
- 6. •Start •Background •Viewing Firewatch •Viewing Fire Hotspots Getting Started with Firewatch •Zoom to your Area •View Fire Hotspot Info View Information about Fire Hotspots •View Satellite Imagery •Calculate Burnt Areas To find out when a hotspot was mapped, select •Fuel loads the Identify tool and click on a fire hotspot. The results display below the map. You may need to scroll down to view them. In this example the fire hotspot was mapped at 125.535 Longitude, -17.185 latitude, from the NOAA-18 satellite, at 1:50 am WST (so from night time imagery) on 20120405 (so 5/04/2012).
- 7. •Start •Background •Viewing Firewatch •Viewing Fire Hotspots Getting Started with Firewatch •Zoom to your Area •View Fire Hotspot Info View a Satellite Image with Hotspots •View Satellite Imagery •Calculate Burnt Areas To view the satellite imagery associated with •Fuel loads a fire hotspot, click the MODIS Hotspots–daily button. Select the date of imagery you would like to view. It defaults to the current day. Press ‘list’ to list the available satellite imagery passes. Scroll your curser over each of the images in the list and you will see a graphic pop-up of Australia with the satellite imagery overlaid, showing what part of Australia each image covers. Dark images are night time thermal images, coloured images are daytime satellite images.
- 8. •Start •Background •Viewing Firewatch •Viewing Fire Hotspots Getting Started with Firewatch •Zoom to your Area •View Fire Hotspot Info View a Satellite Image with Hotspots •View Satellite Imagery •Calculate Burnt Areas Click the radio button next to an image that •Fuel loads covers your area of interest and then press the ‘Refresh Map’ button. The satellite image will display over the map of Australia. You can see where the edge of the satellite image extents. Using the zoom tool zoom in to an area where there is an active fire
- 9. •Start •Background •Viewing Firewatch •Viewing Fire Hotspots Getting Started with Firewatch •Zoom to your Area •View Fire Hotspot Info View a Satellite Image with Hotspots •View Satellite Imagery •Calculate Burnt Areas Using the zoom tool zoom in to an •Fuel loads area where there is an active fire. You can see the coloured fire hotspots showing the difference in age of the hotsopots mapped. Red is current (within 12 hours), to oranges to yellow being cooler / older (48-72 hours old). In this example you can see how the fire front has changed over the past 3 days mainly burning to the west.
- 10. •Start •Background •Viewing Firewatch •Viewing Fire Hotspots Getting Started with Firewatch •Zoom to your Area •View Fire Hotspot Info View a Satellite Image with Hotspots •View Satellite Imagery •Calculate Burnt Areas Try turning off the hotspots so you can see the •Fuel loads image fully. Click on the ‘Current Fire Information’ button, and turn off all the hotspots layers. A quick way to do this is to check the ‘toggle checkboxes’ check box, to turn the four layers off. This option is available on most layers within Firewatch. Then press the ‘Refresh Map’ button and all the fire hotspots will be turned off, leaving the satellite image viewable. The dark patch on the image is a fire scar from what has been previously burnt. The white patches on the right hand side show smoke from the fire. This helps in determining the wind direction at the time of the satellite image. In this example it looks like the wind was blowing South-south west (SSW)
- 11. •Start •Background •Viewing Firewatch •Viewing Fire Hotspots Getting Started with Firewatch •Zoom to your Area •View Fire Hotspot Info Calculate the Area of a Fire Burnt Area •View Satellite Imagery •Calculate Burnt Areas If you would like to determine the area the fire •Fuel loads has burnt you can use the ‘Measure Perimeter and Area with Polygon’ tool Select this tool and then click on the image around the darkened area in a clockwise direction. When you are back to the start ‘double click’ to close the area polygon. The area and perimeter is calculated and displayed below the map. You can select what units to display the area in such as square km’s hectares. In this example the area is 1,003 sq km.
- 12. •Start •Background •Viewing Firewatch •Viewing Fire Hotspots Getting Started with Firewatch •Zoom to your Area •View Fire Hotspot Info View previously burnt areas •View Satellite Imagery •Calculate Burnt Areas If you would like to determine the area the fire •Fuel loads has burnt you can use the ‘Measure Perimeter and Area with Polygon’ tool Select this tool and then click on the image around the darkened area in a clockwise direction. When you are back to the start ‘double click’ to close the area polygon. The area and perimeter is calculated and displayed below the map. You can select what units to display the area in such as square km’s hectares. In this example the area is 1,003 sq km.