SlideShare ist ein Scribd-Unternehmen logo
1 von 4
Downloaden Sie, um offline zu lesen
Cause-and-Effect Diagrams (Fishbone Diagrams)
It is difficult if not impossible to solve complicated problems without considering many factors and the
cause-and-effect relationships between those factors. Defining and displaying those relationships
helps. The first such cause-and-effect diagram was used by Kaoru Ishikawa in 1943 to explain to a
group of engineers at the Kawasaki Steel Works how various work factors could be sorted and
related. In recognition of this, these diagrams sometimes are called Ishikawa diagrams. They are also
called fishbone diagrams, because they look something like fish skeletons.

What can it do for you?
Quality problems are typically not simple. They often involve the complex interaction of several
causes. A cause-and-effect diagram will help you:
    Define and display the major causes, sub-causes and root causes that influence
       a process or a characteristic.
    Provide a focus for discussion and consensus.
    Visualize the possible relationships between causes which may be creating
       problems or defects.

Cause-and-effect diagrams are particularly useful in the measure and improve phases of Lean Six
Sigma methodology.

How do you do it?
   1. Decide which quality characteristic, outcome or effect you want to examine. You might
      consider Pareto analysis to help you focus on the most important issue.
   2. Write your chosen effect on the right side of a paper, board or flipchart and draw a box around
      it. If you think of this as a fishbone diagram, this is the fish’s head.
   3. Draw a straight line to the left, the fish’s backbone.
   4. For each primary cause or category of causes, draw a diagonal line slanting from left to the
      centerline. Alternate these ribs on the top and bottom of the backbone. Label the end of each
      rib and draw a box around the label.
   5. Draw a horizontal line intersecting the appropriate diagonal line and label it to describe each
      secondary cause that influences a primary cause. Alternate these medium sized bones to the
      left and right of each rib.
   6. In a similar way, draw and label diagonal lines for third level or root causes, small bones,
      intersecting the secondary cause lines, medium sized bones.
   7. Examine the
      diagram. If
      certain causes                       Big Bone
      seem to have                 Small Bone
      a significant         Medium Bone
      effect on the         Backbone                                                  Characteristic
      characteristic
      you are
      examining,
      mark them in a
      special way.
                                      Factors (causes)                             Characteristic (effect)
                           Cause and Effect Diagram
Variation 1: Cause Enumeration
Sometime it may be very difficult to determine the primary causes to be included in your diagram. If
that is the case, after you have determined the characteristic or effect you are examining, follow these
steps:
    Use brainstorming to create a list of all the possible causes. The list will contain a mixture of
        primary, secondary and tertiary (or big bone, middle sized bone and small bone) causes.
    Sort the list by grouping causes that are related.
    Identify or name each major grouping and make your cause-and-effect diagram.
    Machine, Manpower, Material, Measurement, Method and Environment are frequently used
        major causes that can apply to many processes.

The advantage of the cause enumeration technique is that you stand a much better chance that all
causes will be listed, especially hidden ones, and your diagram will be a complete and useful picture.
The disadvantage is that it may be difficult to relate all the causes clearly to the result, making the
diagram hard to draw.


Variation 2: Process Classification
Sometimes it is more helpful to look at causes in the sequence in which they occur instead of
considering overreaching logical categories. With this approach, the center line or backbone follows
the sequence of the process.
    Instead of primary causes as the ribs, show the major process steps from left to right.
    Construct your cause-and-effect diagram as before.

The advantage of this technique is that, since it follows the sequence of the process, it will be easy for
everyone to understand. The disadvantages are that similar causes will appear again and again, and
causes due to a combination of factors will be difficult to show.
Hints for Making Good Diagrams
   1. Get input from many people involved in the process. Not only will this make for a more
      accurate diagram, everyone taking part will gain new knowledge.
   2. Make one cause-and-effect diagram for each Critical-To-Quality (CTQ) characteristic you are
      considering. Trying to include all CTQs on one diagram will make it too large and complicated
      to be of much use as a problem solving tool.
   3. Avoid generalities. Express each cause as concretely as possible.
   4. Since you will use your diagram to direct the examination of specific cause-and-effect
      relationships with data, the characteristic you are considering and all the causal factors should
      be measurable. If they are not, try to make them measurable or find substitutes.
   5. The objective of the cause-and-effect diagram is action. Be sure your causes are broken down
      to the level at which they can be acted on.


Now what?
      Use your diagram to develop a common understanding of the factors potentially influencing or
       causing a quality problem.
      Use your diagram as a road map for collecting data to verify the causal relationship of various
       factors to the characteristic.
      Continue to annotate and modify your diagram as you verify relationships and learn more.

Using a cause-and-effect diagram this way will help you to see which factors in your process need to
be checked, modified or eliminated.
Steven Bonacorsi is the President of the International Standard for Lean Six Sigma
(ISLSS) and Certified Lean Six Sigma Master Black Belt instructor and coach. Steven
Bonacorsi has trained hundreds of Master Black Belts, Black Belts, Green Belts, and
Project Sponsors and Executive Leaders in Lean Six Sigma DMAIC and Design for
Lean Six Sigma process improvement methodologies.
                             Author for the Process Excellence Network (PEX Network /
                             IQPC). FREE Lean Six Sigma and BPM content

International Standard for Lean Six Sigma
Steven Bonacorsi, President and Lean Six Sigma Master Black Belt
47 Seasons Lane, Londonderry, NH 03053, USA
Phone: + (1) 603-401-7047
Steven Bonacorsi e-mail
Steven Bonacorsi LinkedIn
Steven Bonacorsi Twitter
Lean Six Sigma Group

Weitere ähnliche Inhalte

Mehr von Kevin Egan

Sms Integration Six Sigma Case Study
Sms Integration Six Sigma Case StudySms Integration Six Sigma Case Study
Sms Integration Six Sigma Case StudyKevin Egan
 
Ticket Accuracy Six Sigma Case Study
Ticket Accuracy   Six Sigma Case StudyTicket Accuracy   Six Sigma Case Study
Ticket Accuracy Six Sigma Case StudyKevin Egan
 
Qaa paul nelson
Qaa   paul nelsonQaa   paul nelson
Qaa paul nelsonKevin Egan
 
Pharma iq mediakit1
Pharma iq mediakit1Pharma iq mediakit1
Pharma iq mediakit1Kevin Egan
 
Jack Welch Speak - PEXN
Jack Welch Speak - PEXNJack Welch Speak - PEXN
Jack Welch Speak - PEXNKevin Egan
 
ISLSS Offerings
ISLSS OfferingsISLSS Offerings
ISLSS OfferingsKevin Egan
 

Mehr von Kevin Egan (6)

Sms Integration Six Sigma Case Study
Sms Integration Six Sigma Case StudySms Integration Six Sigma Case Study
Sms Integration Six Sigma Case Study
 
Ticket Accuracy Six Sigma Case Study
Ticket Accuracy   Six Sigma Case StudyTicket Accuracy   Six Sigma Case Study
Ticket Accuracy Six Sigma Case Study
 
Qaa paul nelson
Qaa   paul nelsonQaa   paul nelson
Qaa paul nelson
 
Pharma iq mediakit1
Pharma iq mediakit1Pharma iq mediakit1
Pharma iq mediakit1
 
Jack Welch Speak - PEXN
Jack Welch Speak - PEXNJack Welch Speak - PEXN
Jack Welch Speak - PEXN
 
ISLSS Offerings
ISLSS OfferingsISLSS Offerings
ISLSS Offerings
 

Kürzlich hochgeladen

Presentation on how to chat with PDF using ChatGPT code interpreter
Presentation on how to chat with PDF using ChatGPT code interpreterPresentation on how to chat with PDF using ChatGPT code interpreter
Presentation on how to chat with PDF using ChatGPT code interpreternaman860154
 
Axa Assurance Maroc - Insurer Innovation Award 2024
Axa Assurance Maroc - Insurer Innovation Award 2024Axa Assurance Maroc - Insurer Innovation Award 2024
Axa Assurance Maroc - Insurer Innovation Award 2024The Digital Insurer
 
GenCyber Cyber Security Day Presentation
GenCyber Cyber Security Day PresentationGenCyber Cyber Security Day Presentation
GenCyber Cyber Security Day PresentationMichael W. Hawkins
 
[2024]Digital Global Overview Report 2024 Meltwater.pdf
[2024]Digital Global Overview Report 2024 Meltwater.pdf[2024]Digital Global Overview Report 2024 Meltwater.pdf
[2024]Digital Global Overview Report 2024 Meltwater.pdfhans926745
 
Workshop - Best of Both Worlds_ Combine KG and Vector search for enhanced R...
Workshop - Best of Both Worlds_ Combine  KG and Vector search for  enhanced R...Workshop - Best of Both Worlds_ Combine  KG and Vector search for  enhanced R...
Workshop - Best of Both Worlds_ Combine KG and Vector search for enhanced R...Neo4j
 
🐬 The future of MySQL is Postgres 🐘
🐬  The future of MySQL is Postgres   🐘🐬  The future of MySQL is Postgres   🐘
🐬 The future of MySQL is Postgres 🐘RTylerCroy
 
How to convert PDF to text with Nanonets
How to convert PDF to text with NanonetsHow to convert PDF to text with Nanonets
How to convert PDF to text with Nanonetsnaman860154
 
04-2024-HHUG-Sales-and-Marketing-Alignment.pptx
04-2024-HHUG-Sales-and-Marketing-Alignment.pptx04-2024-HHUG-Sales-and-Marketing-Alignment.pptx
04-2024-HHUG-Sales-and-Marketing-Alignment.pptxHampshireHUG
 
The 7 Things I Know About Cyber Security After 25 Years | April 2024
The 7 Things I Know About Cyber Security After 25 Years | April 2024The 7 Things I Know About Cyber Security After 25 Years | April 2024
The 7 Things I Know About Cyber Security After 25 Years | April 2024Rafal Los
 
Artificial Intelligence: Facts and Myths
Artificial Intelligence: Facts and MythsArtificial Intelligence: Facts and Myths
Artificial Intelligence: Facts and MythsJoaquim Jorge
 
The Role of Taxonomy and Ontology in Semantic Layers - Heather Hedden.pdf
The Role of Taxonomy and Ontology in Semantic Layers - Heather Hedden.pdfThe Role of Taxonomy and Ontology in Semantic Layers - Heather Hedden.pdf
The Role of Taxonomy and Ontology in Semantic Layers - Heather Hedden.pdfEnterprise Knowledge
 
From Event to Action: Accelerate Your Decision Making with Real-Time Automation
From Event to Action: Accelerate Your Decision Making with Real-Time AutomationFrom Event to Action: Accelerate Your Decision Making with Real-Time Automation
From Event to Action: Accelerate Your Decision Making with Real-Time AutomationSafe Software
 
08448380779 Call Girls In Greater Kailash - I Women Seeking Men
08448380779 Call Girls In Greater Kailash - I Women Seeking Men08448380779 Call Girls In Greater Kailash - I Women Seeking Men
08448380779 Call Girls In Greater Kailash - I Women Seeking MenDelhi Call girls
 
Understanding Discord NSFW Servers A Guide for Responsible Users.pdf
Understanding Discord NSFW Servers A Guide for Responsible Users.pdfUnderstanding Discord NSFW Servers A Guide for Responsible Users.pdf
Understanding Discord NSFW Servers A Guide for Responsible Users.pdfUK Journal
 
Strategies for Unlocking Knowledge Management in Microsoft 365 in the Copilot...
Strategies for Unlocking Knowledge Management in Microsoft 365 in the Copilot...Strategies for Unlocking Knowledge Management in Microsoft 365 in the Copilot...
Strategies for Unlocking Knowledge Management in Microsoft 365 in the Copilot...Drew Madelung
 
Factors to Consider When Choosing Accounts Payable Services Providers.pptx
Factors to Consider When Choosing Accounts Payable Services Providers.pptxFactors to Consider When Choosing Accounts Payable Services Providers.pptx
Factors to Consider When Choosing Accounts Payable Services Providers.pptxKatpro Technologies
 
Mastering MySQL Database Architecture: Deep Dive into MySQL Shell and MySQL R...
Mastering MySQL Database Architecture: Deep Dive into MySQL Shell and MySQL R...Mastering MySQL Database Architecture: Deep Dive into MySQL Shell and MySQL R...
Mastering MySQL Database Architecture: Deep Dive into MySQL Shell and MySQL R...Miguel Araújo
 
Scaling API-first – The story of a global engineering organization
Scaling API-first – The story of a global engineering organizationScaling API-first – The story of a global engineering organization
Scaling API-first – The story of a global engineering organizationRadu Cotescu
 
08448380779 Call Girls In Diplomatic Enclave Women Seeking Men
08448380779 Call Girls In Diplomatic Enclave Women Seeking Men08448380779 Call Girls In Diplomatic Enclave Women Seeking Men
08448380779 Call Girls In Diplomatic Enclave Women Seeking MenDelhi Call girls
 
Powerful Google developer tools for immediate impact! (2023-24 C)
Powerful Google developer tools for immediate impact! (2023-24 C)Powerful Google developer tools for immediate impact! (2023-24 C)
Powerful Google developer tools for immediate impact! (2023-24 C)wesley chun
 

Kürzlich hochgeladen (20)

Presentation on how to chat with PDF using ChatGPT code interpreter
Presentation on how to chat with PDF using ChatGPT code interpreterPresentation on how to chat with PDF using ChatGPT code interpreter
Presentation on how to chat with PDF using ChatGPT code interpreter
 
Axa Assurance Maroc - Insurer Innovation Award 2024
Axa Assurance Maroc - Insurer Innovation Award 2024Axa Assurance Maroc - Insurer Innovation Award 2024
Axa Assurance Maroc - Insurer Innovation Award 2024
 
GenCyber Cyber Security Day Presentation
GenCyber Cyber Security Day PresentationGenCyber Cyber Security Day Presentation
GenCyber Cyber Security Day Presentation
 
[2024]Digital Global Overview Report 2024 Meltwater.pdf
[2024]Digital Global Overview Report 2024 Meltwater.pdf[2024]Digital Global Overview Report 2024 Meltwater.pdf
[2024]Digital Global Overview Report 2024 Meltwater.pdf
 
Workshop - Best of Both Worlds_ Combine KG and Vector search for enhanced R...
Workshop - Best of Both Worlds_ Combine  KG and Vector search for  enhanced R...Workshop - Best of Both Worlds_ Combine  KG and Vector search for  enhanced R...
Workshop - Best of Both Worlds_ Combine KG and Vector search for enhanced R...
 
🐬 The future of MySQL is Postgres 🐘
🐬  The future of MySQL is Postgres   🐘🐬  The future of MySQL is Postgres   🐘
🐬 The future of MySQL is Postgres 🐘
 
How to convert PDF to text with Nanonets
How to convert PDF to text with NanonetsHow to convert PDF to text with Nanonets
How to convert PDF to text with Nanonets
 
04-2024-HHUG-Sales-and-Marketing-Alignment.pptx
04-2024-HHUG-Sales-and-Marketing-Alignment.pptx04-2024-HHUG-Sales-and-Marketing-Alignment.pptx
04-2024-HHUG-Sales-and-Marketing-Alignment.pptx
 
The 7 Things I Know About Cyber Security After 25 Years | April 2024
The 7 Things I Know About Cyber Security After 25 Years | April 2024The 7 Things I Know About Cyber Security After 25 Years | April 2024
The 7 Things I Know About Cyber Security After 25 Years | April 2024
 
Artificial Intelligence: Facts and Myths
Artificial Intelligence: Facts and MythsArtificial Intelligence: Facts and Myths
Artificial Intelligence: Facts and Myths
 
The Role of Taxonomy and Ontology in Semantic Layers - Heather Hedden.pdf
The Role of Taxonomy and Ontology in Semantic Layers - Heather Hedden.pdfThe Role of Taxonomy and Ontology in Semantic Layers - Heather Hedden.pdf
The Role of Taxonomy and Ontology in Semantic Layers - Heather Hedden.pdf
 
From Event to Action: Accelerate Your Decision Making with Real-Time Automation
From Event to Action: Accelerate Your Decision Making with Real-Time AutomationFrom Event to Action: Accelerate Your Decision Making with Real-Time Automation
From Event to Action: Accelerate Your Decision Making with Real-Time Automation
 
08448380779 Call Girls In Greater Kailash - I Women Seeking Men
08448380779 Call Girls In Greater Kailash - I Women Seeking Men08448380779 Call Girls In Greater Kailash - I Women Seeking Men
08448380779 Call Girls In Greater Kailash - I Women Seeking Men
 
Understanding Discord NSFW Servers A Guide for Responsible Users.pdf
Understanding Discord NSFW Servers A Guide for Responsible Users.pdfUnderstanding Discord NSFW Servers A Guide for Responsible Users.pdf
Understanding Discord NSFW Servers A Guide for Responsible Users.pdf
 
Strategies for Unlocking Knowledge Management in Microsoft 365 in the Copilot...
Strategies for Unlocking Knowledge Management in Microsoft 365 in the Copilot...Strategies for Unlocking Knowledge Management in Microsoft 365 in the Copilot...
Strategies for Unlocking Knowledge Management in Microsoft 365 in the Copilot...
 
Factors to Consider When Choosing Accounts Payable Services Providers.pptx
Factors to Consider When Choosing Accounts Payable Services Providers.pptxFactors to Consider When Choosing Accounts Payable Services Providers.pptx
Factors to Consider When Choosing Accounts Payable Services Providers.pptx
 
Mastering MySQL Database Architecture: Deep Dive into MySQL Shell and MySQL R...
Mastering MySQL Database Architecture: Deep Dive into MySQL Shell and MySQL R...Mastering MySQL Database Architecture: Deep Dive into MySQL Shell and MySQL R...
Mastering MySQL Database Architecture: Deep Dive into MySQL Shell and MySQL R...
 
Scaling API-first – The story of a global engineering organization
Scaling API-first – The story of a global engineering organizationScaling API-first – The story of a global engineering organization
Scaling API-first – The story of a global engineering organization
 
08448380779 Call Girls In Diplomatic Enclave Women Seeking Men
08448380779 Call Girls In Diplomatic Enclave Women Seeking Men08448380779 Call Girls In Diplomatic Enclave Women Seeking Men
08448380779 Call Girls In Diplomatic Enclave Women Seeking Men
 
Powerful Google developer tools for immediate impact! (2023-24 C)
Powerful Google developer tools for immediate impact! (2023-24 C)Powerful Google developer tools for immediate impact! (2023-24 C)
Powerful Google developer tools for immediate impact! (2023-24 C)
 

Cause & effect diagrams

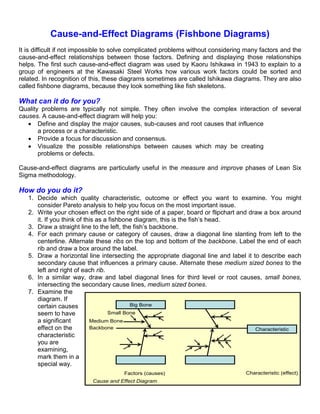
  • 1. Cause-and-Effect Diagrams (Fishbone Diagrams) It is difficult if not impossible to solve complicated problems without considering many factors and the cause-and-effect relationships between those factors. Defining and displaying those relationships helps. The first such cause-and-effect diagram was used by Kaoru Ishikawa in 1943 to explain to a group of engineers at the Kawasaki Steel Works how various work factors could be sorted and related. In recognition of this, these diagrams sometimes are called Ishikawa diagrams. They are also called fishbone diagrams, because they look something like fish skeletons. What can it do for you? Quality problems are typically not simple. They often involve the complex interaction of several causes. A cause-and-effect diagram will help you:  Define and display the major causes, sub-causes and root causes that influence a process or a characteristic.  Provide a focus for discussion and consensus.  Visualize the possible relationships between causes which may be creating problems or defects. Cause-and-effect diagrams are particularly useful in the measure and improve phases of Lean Six Sigma methodology. How do you do it? 1. Decide which quality characteristic, outcome or effect you want to examine. You might consider Pareto analysis to help you focus on the most important issue. 2. Write your chosen effect on the right side of a paper, board or flipchart and draw a box around it. If you think of this as a fishbone diagram, this is the fish’s head. 3. Draw a straight line to the left, the fish’s backbone. 4. For each primary cause or category of causes, draw a diagonal line slanting from left to the centerline. Alternate these ribs on the top and bottom of the backbone. Label the end of each rib and draw a box around the label. 5. Draw a horizontal line intersecting the appropriate diagonal line and label it to describe each secondary cause that influences a primary cause. Alternate these medium sized bones to the left and right of each rib. 6. In a similar way, draw and label diagonal lines for third level or root causes, small bones, intersecting the secondary cause lines, medium sized bones. 7. Examine the diagram. If certain causes Big Bone seem to have Small Bone a significant Medium Bone effect on the Backbone Characteristic characteristic you are examining, mark them in a special way. Factors (causes) Characteristic (effect) Cause and Effect Diagram
  • 2. Variation 1: Cause Enumeration Sometime it may be very difficult to determine the primary causes to be included in your diagram. If that is the case, after you have determined the characteristic or effect you are examining, follow these steps:  Use brainstorming to create a list of all the possible causes. The list will contain a mixture of primary, secondary and tertiary (or big bone, middle sized bone and small bone) causes.  Sort the list by grouping causes that are related.  Identify or name each major grouping and make your cause-and-effect diagram.  Machine, Manpower, Material, Measurement, Method and Environment are frequently used major causes that can apply to many processes. The advantage of the cause enumeration technique is that you stand a much better chance that all causes will be listed, especially hidden ones, and your diagram will be a complete and useful picture. The disadvantage is that it may be difficult to relate all the causes clearly to the result, making the diagram hard to draw. Variation 2: Process Classification Sometimes it is more helpful to look at causes in the sequence in which they occur instead of considering overreaching logical categories. With this approach, the center line or backbone follows the sequence of the process.  Instead of primary causes as the ribs, show the major process steps from left to right.  Construct your cause-and-effect diagram as before. The advantage of this technique is that, since it follows the sequence of the process, it will be easy for everyone to understand. The disadvantages are that similar causes will appear again and again, and causes due to a combination of factors will be difficult to show.
  • 3. Hints for Making Good Diagrams 1. Get input from many people involved in the process. Not only will this make for a more accurate diagram, everyone taking part will gain new knowledge. 2. Make one cause-and-effect diagram for each Critical-To-Quality (CTQ) characteristic you are considering. Trying to include all CTQs on one diagram will make it too large and complicated to be of much use as a problem solving tool. 3. Avoid generalities. Express each cause as concretely as possible. 4. Since you will use your diagram to direct the examination of specific cause-and-effect relationships with data, the characteristic you are considering and all the causal factors should be measurable. If they are not, try to make them measurable or find substitutes. 5. The objective of the cause-and-effect diagram is action. Be sure your causes are broken down to the level at which they can be acted on. Now what?  Use your diagram to develop a common understanding of the factors potentially influencing or causing a quality problem.  Use your diagram as a road map for collecting data to verify the causal relationship of various factors to the characteristic.  Continue to annotate and modify your diagram as you verify relationships and learn more. Using a cause-and-effect diagram this way will help you to see which factors in your process need to be checked, modified or eliminated.
  • 4. Steven Bonacorsi is the President of the International Standard for Lean Six Sigma (ISLSS) and Certified Lean Six Sigma Master Black Belt instructor and coach. Steven Bonacorsi has trained hundreds of Master Black Belts, Black Belts, Green Belts, and Project Sponsors and Executive Leaders in Lean Six Sigma DMAIC and Design for Lean Six Sigma process improvement methodologies. Author for the Process Excellence Network (PEX Network / IQPC). FREE Lean Six Sigma and BPM content International Standard for Lean Six Sigma Steven Bonacorsi, President and Lean Six Sigma Master Black Belt 47 Seasons Lane, Londonderry, NH 03053, USA Phone: + (1) 603-401-7047 Steven Bonacorsi e-mail Steven Bonacorsi LinkedIn Steven Bonacorsi Twitter Lean Six Sigma Group