The us-contact-center-decision-makers-guide-2012
•
2 likes•3,873 views

This document provides an overview and guide for contact center decision-makers. It discusses topics related to improving quality and performance such as interaction recording, customer interaction analytics, dynamic scripting, customer satisfaction, and training. It also covers maximizing efficiency and agent optimization, including contact center performance metrics, budgets, new ways of working, and increasing efficiency within calls. Finally, it addresses new media and the customer of the future as well as increasing profitability through topics like CRM, cloud solutions, outbound calling, and outsourcing. The document is intended to help contact center leaders make strategic decisions through analysis of industry data and trends.

Recommended
Recommended
More Related Content
What's hot
What's hot (17)
Viewers also liked
Viewers also liked (9)
Similar to The us-contact-center-decision-makers-guide-2012
Similar to The us-contact-center-decision-makers-guide-2012 (20)
Recently uploaded
Recently uploaded (20)
The us-contact-center-decision-makers-guide-2012
- 1. THE US CONTACT CENTER DECISION-MAKERS' GUIDE (5TH EDITION - 2012) Platinum sponsors
- 2. CONTENTS CONTENTS ............................................................................................................................................................. 2 LIST OF TABLES ...................................................................................................................................................... 5 DEDICATED TO SERVING THE CONTACT CENTER INDUSTRY ....................................................................................................10 ABOUT THE AMERICAN TELESERVICES ASSOCIATION ...........................................................................................................10 INTRODUCTION AND METHODOLOGY ................................................................................................................. 11 HOW TO USE THE REPORT...............................................................................................................................................11 SEGMENTATIONS ..........................................................................................................................................................12 Vertical markets ...................................................................................................................................................12 Size band ..............................................................................................................................................................13 Contact center type .............................................................................................................................................13 THE STRUCTURE OF THE DATASETS....................................................................................................................................13 DISTRIBUTION AND USE OF THIS REPORT ............................................................................................................................14 IMPROVING QUALITY AND PERFORMANCE ......................................................................................................... 23 INTERACTION RECORDING ..............................................................................................................................................24 CUSTOMER INTERACTION ANALYTICS ................................................................................................................................33 The Commercial Applications of Customer Interaction Analytics ........................................................................39 Estimating Return on Investment for Customer Interaction Analytics ................................................................50 DYNAMIC SCRIPTING AND THE UNIFIED DESKTOP ................................................................................................................53 Dynamic Scripting ................................................................................................................................................53 The Unified Desktop .............................................................................................................................................57 CUSTOMER SATISFACTION ..............................................................................................................................................61 Customer satisfaction measurement techniques.................................................................................................62 Complaints ...........................................................................................................................................................69 TRAINING AND COACHING ..............................................................................................................................................72 Induction course training methods ......................................................................................................................73 Time required to become fully-productive ...........................................................................................................75 Induction course costs .........................................................................................................................................76 Ongoing training and coaching ...........................................................................................................................78 Team leader coaching and development .............................................................................................................81 MAXIMIZING EFFICIENCY AND AGENT OPTIMIZATION ........................................................................................ 86 CONTACT CENTER PERFORMANCE METRICS ......................................................................................................................... 87 The importance of contact center metrics ...........................................................................................................90 Agent activity .......................................................................................................................................................91 Call duration ........................................................................................................................................................95 Call abandonment ...............................................................................................................................................97 Speed to answer ..................................................................................................................................................98 First-call resolution ............................................................................................................................................101 Call transfers ......................................................................................................................................................106 2
- 3. Cost per call .......................................................................................................................................................107 BUDGET ....................................................................................................................................................................108 Operating expenditure, 2011 .............................................................................................................................108 Changes in contact center size, operating and capital expenditure, 2011 & 2012 ............................................110 NEW WAYS OF WORKING ..............................................................................................................................................116 Virtual contact centers.......................................................................................................................................117 Homeworking and telecottages.........................................................................................................................126 The enterprise as the contact center .................................................................................................................134 IP AND CONVERGENCE..................................................................................................................................................136 INCREASING EFFICIENCY AND EFFECTIVENESS WITHIN THE CALL .............................................................................................144 Payment cards and security ...............................................................................................................................144 Customer Identity Verification ...........................................................................................................................145 Call Routing and Queue Management ..............................................................................................................154 Virtual Queue Management ..............................................................................................................................164 MULTICHANNEL WORKFORCE MANAGEMENT...................................................................................................................168 HEADSETS .................................................................................................................................................................178 Wireless and IP Headsets ...................................................................................................................................180 Acoustic shock....................................................................................................................................................183 NEW MEDIA AND THE CUSTOMER OF THE FUTURE ........................................................................................... 188 MULTIMEDIA MANAGEMENT AND THE UNIVERSAL QUEUE ...................................................................................................193 Email management............................................................................................................................................199 Multimedia Blending .........................................................................................................................................203 Text chat and web collaboration .......................................................................................................................206 SELF-SERVICE .............................................................................................................................................................208 The Use of IVR and Speech Recognition.............................................................................................................208 The Use of Self-service .......................................................................................................................................210 Video and IVVR ..................................................................................................................................................218 THE CUSTOMER OF THE FUTURE .....................................................................................................................................219 Social Media ......................................................................................................................................................220 INCREASING PROFITABILITY ............................................................................................................................... 230 CRM, CROSS-SELLING AND UPSELLING ............................................................................................................................231 CLOUD AND HOSTED SOLUTIONS ...................................................................................................................................237 What types of company should consider hosted/Cloud solutions? ...................................................................239 Drivers for hosted and managed solutions ........................................................................................................241 The value proposition of Cloud/hosted/network solutions ................................................................................243 CPE or hosted/network solutions - or both? ......................................................................................................248 Checklist when choosing a hosted/network solution .........................................................................................249 Results of using hosted and managed solutions ................................................................................................250 Concerns About Cloud or Hosted SOlutions .......................................................................................................252 OUTBOUND AND CALL BLENDING ..................................................................................................................................253 Outbound activity ..............................................................................................................................................254 Call blending ......................................................................................................................................................261 3
- 4. The role of mobile telephony on outbound calling ............................................................................................263 TACTICAL & PROJECT-BASED OUTSOURCING ....................................................................................................................264 Drivers for tactical and project-based outsourcing............................................................................................265 Choosing an outsourcer .....................................................................................................................................267 HR MANAGEMENT ............................................................................................................................................. 272 ATTRITION .................................................................................................................................................................272 Agent attrition by vertical market .....................................................................................................................276 Agent attrition by contact center size ................................................................................................................278 Agent attrition by contact center activity type ..................................................................................................280 Causes of staff attrition .....................................................................................................................................282 Methods of motivating and retaining agents ....................................................................................................283 ABSENCE ...................................................................................................................................................................285 RECRUITMENT ............................................................................................................................................................288 Recruitment methods ........................................................................................................................................288 The cost and purpose of recruitment .................................................................................................................292 Most important attributes of a successful contact center agent.......................................................................293 SALARIES ...................................................................................................................................................................295 Salaries by vertical market.................................................................................................................................296 New agent salaries ............................................................................................................................................297 Experienced agent salaries ................................................................................................................................297 Team leader salaries ..........................................................................................................................................298 Contact center manager salaries .......................................................................................................................298 Salaries by contact center activity type and size ...............................................................................................299 Bonuses ..............................................................................................................................................................302 STRATEGIC DIRECTIONS ..................................................................................................................................... 306 TECHNOLOGY USAGE AND PLANS...................................................................................................................................308 PRESSING MANAGERIAL ISSUES ......................................................................................................................................313 INDUSTRY TRENDS.......................................................................................................................................................316 THE CONTACT CENTER AND THE WIDER BUSINESS ............................................................................................................320 APPENDIX: ABOUT CONTACTBABEL ................................................................................................................... 327 4
- 5. LIST OF TABLES FIGURE 1: VERTICAL MARKET DEFINITIONS .............................................................................................................................12 FIGURE 2: CURRENT AND FUTURE USE OF CALL RECORDING, BY VERTICAL MARKET .........................................................................24 FIGURE 3: CURRENT AND FUTURE USE OF CALL RECORDING, BY CONTACT CENTER SIZE ....................................................................26 FIGURE 4: PRESENCE OF INDUSTRY-WIDE REGULATIONS REQUIRING COMPLIANCE, BY VERTICAL MARKET ............................................29 FIGURE 5: EFFECTIVENESS OF CALL RECORDING FOR SPECIFIC TASKS ............................................................................................31 FIGURE 6: CURRENT USE OF SPEECH ANALYTICS, BY VERTICAL MARKET.........................................................................................36 FIGURE 7: CURRENT USE OF SPEECH ANALYTICS, BY CONTACT CENTER SIZE ...................................................................................37 FIGURE 8: EFFECTIVENESS OF CUSTOMER INTERACTION MONITORING & ANALYSIS METHOD FOR VARIOUS CHANNELS ...........................38 FIGURE 9: DOES YOUR CONTACT CENTER HAVE TO COMPLY WITH INDUSTRY-WIDE REGULATIONS? (BY VERTICAL MARKET).....................40 FIGURE 10: EFFECTIVENESS OF CALL RECORDING FOR VARIOUS TASKS (ALL RESPONDENTS USING CALL RECORDING) ..............................47 FIGURE 11: EFFECTIVENESS OF CALL RECORDING FOR VARIOUS TASKS (ONLY RESPONDENTS USING BOTH CALL RECORDING AND SPEECH ANALYTICS) .............................................................................................................................................................. 48 FIGURE 12: DO YOU USE SCRIPTING? ...................................................................................................................................53 FIGURE 13: USE OF SCRIPTING, BY CONTACT CENTER SIZE .........................................................................................................54 FIGURE 14: THE EFFECTIVENESS OF SCRIPTING........................................................................................................................55 FIGURE 15: INHIBITORS TO SCRIPTING...................................................................................................................................56 FIGURE 16: USE OF MULTIPLE APPLICATIONS ACROSS VERTICAL MARKETS ....................................................................................57 FIGURE 17: HOW MANY APPLICATIONS DOES AN AGENT USE WITHIN A CALL? ...............................................................................58 FIGURE 18: HOW MANY APPLICATIONS DOES AN AGENT USE AFTER A CALL? .................................................................................59 FIGURE 19: HOW DO CONTACT CENTER STAFF GET REWARDED? ................................................................................................65 FIGURE 20: CUSTOMER SATISFACTION MEASUREMENT, IN-DEPTH ..............................................................................................66 FIGURE 21: RESPONSE TO DISSATISFIED CUSTOMERS WITHIN ONE WORKING DAY, BY VERTICAL MARKET.............................................67 FIGURE 22: RESPONSE TO DISSATISFIED CUSTOMERS WITHIN ONE WORKING DAY, BY CONTACT CENTER SIZE .......................................68 FIGURE 23: PROPORTION OF CALLS RECEIVED THAT ARE COMPLAINTS / TARGET OF COMPLAINTS, BY VERTICAL MARKET (SORTED BY LARGEST PROPORTION OF COMPLAINTS ABOUT THE CONTACT CENTER - HIGH-TO-LOW) - MEDIAN ......................................................... 70 FIGURE 24: EFFECTIVENESS OF INDUCTION COURSE TRAINING METHODS .....................................................................................73 FIGURE 25: NUMBER OF WEEKS FOR A NEW AGENT TO BECOME FULLY PRODUCTIVE, BY VERTICAL MARKET.........................................75 FIGURE 26: COST OF INDUCTION COURSE BY HEAD, BY VERTICAL MARKET ....................................................................................76 FIGURE 27: COST OF INDUCTION COURSE PER HEAD, BY CONTACT CENTER ACTIVITY TYPE ................................................................77 FIGURE 28: COST OF INDUCTION COURSE PER HEAD, BY CONTACT CENTER SIZE .............................................................................77 FIGURE 29: TYPE OF ONGOING TRAINING TIME, BY VERTICAL MARKET .........................................................................................78 FIGURE 30: TYPE OF ONGOING TRAINING TIME, BY CONTACT CENTER ACTIVITY TYPE.......................................................................79 FIGURE 31: TYPES OF ONGOING TRAINING, BY VERTICAL MARKET (HOURS PER AGENT PER WEEK) .....................................................80 FIGURE 32: MONTHLY HOURS OF COACHING AND DEVELOPMENT FOR TEAM LEADERS, BY VERTICAL MARKET ......................................81 FIGURE 33: CONTACT CENTER METRICS.................................................................................................................................87 FIGURE 34: HOW IMPORTANT ARE THESE CONTACT CENTER METRICS COMPARED WITH TWO YEARS AGO? .........................................90 FIGURE 35: AGENT ACTIVITY BY VERTICAL MARKET ..................................................................................................................91 FIGURE 36: AGENT ACTIVITY BY CONTACT CENTER SIZE .............................................................................................................93 FIGURE 37: AVERAGE CALL DURATION (SERVICE & SALES), BY CONTACT CENTER SIZE......................................................................95 FIGURE 38: AVERAGE CALL DURATION (SERVICE & SALES), BY VERTICAL MARKET ...........................................................................96 FIGURE 39: CALL ABANDONMENT RATES BY VERTICAL MARKET ..................................................................................................97 FIGURE 40: CALL ABANDONMENT RATES, BY CONTACT CENTER SIZE ............................................................................................97 5
- 6. FIGURE 41: AVERAGE SPEED TO ANSWER, BY VERTICAL MARKET.................................................................................................99 FIGURE 42: AVERAGE SPEED TO ANSWER, BY CONTACT CENTER SIZE.........................................................................................100 FIGURE 43: FOCUS OF FIRST-CALL RESOLUTION RATE MEASUREMENT ........................................................................................101 FIGURE 44: FIRST-CALL RESOLUTION RATE BY VERTICAL MARKET ..............................................................................................102 FIGURE 45: USE AND EFFECTIVENESS OF FCR MEASUREMENT METHOD.....................................................................................104 FIGURE 46: CALL TRANSFERS BY VERTICAL MARKET................................................................................................................106 FIGURE 47: COST PER INBOUND CALL .................................................................................................................................107 FIGURE 48: CONTACT CENTER OPERATING EXPENDITURE ........................................................................................................108 FIGURE 49: CONTACT CENTER OPERATING EXPENDITURE BY CONTACT CENTER SIZE ......................................................................109 FIGURE 50: CHANGES IN OPEX AND CAPEX, 2011 ...............................................................................................................110 FIGURE 51: ACTUAL AND EXPECTED CHANGES IN AGENT POSITIONS, 2011 & 2012 ....................................................................111 FIGURE 52: CHANGES IN OPERATING EXPENDITURE 2011, BY CONTACT CENTER SIZE ...................................................................112 FIGURE 53: EXPECTED CHANGES IN OPERATING EXPENDITURE 2012, BY CONTACT CENTER SIZE......................................................113 FIGURE 54: CHANGES IN CAPITAL EXPENDITURE IN 2011, BY CONTACT CENTER SIZE ....................................................................114 FIGURE 55: EXPECTED CHANGES IN CAPITAL EXPENDITURE 2012, BY CONTACT CENTER SIZE ..........................................................115 FIGURE 56: VIRTUAL CONTACT CENTER COMMERCIAL AND OPERATIONAL BENEFITS .....................................................................119 FIGURE 57: VIRTUALIZATION BY CONTACT CENTER SIZE (MULTIPLE-SITE OPERATIONS ONLY) ..........................................................121 FIGURE 58: BENEFITS OF VIRTUALIZING A CONTACT CENTER ....................................................................................................122 FIGURE 59: REASONS FOR NOT IMPLEMENTING A VIRTUAL CONTACT CENTER (MULTISITE OPERATIONS ONLY) ...................................124 FIGURE 60: CHANGES IN USE OF HOMEWORKERS, 2007-2011 ...............................................................................................127 FIGURE 61: OPINION: "IT IS / WOULD BE DIFFICULT TO MANAGE HOMEWORKING AGENTS EFFECTIVELY" .........................................128 FIGURE 62: OPINION: "HOMEWORKING BRINGS / WOULD BRING US FLEXIBILITY TO ADD AGENTS AND BE OPEN LONGER HOURS" .........129 FIGURE 63: OPINION: "DATA SECURITY ISSUES ARE / WOULD BE A CONCERN" ............................................................................130 FIGURE 64: OPINION: "HOMEWORKING IS / COULD BE USED AS A PERFORMANCE INCENTIVE OR REWARD FOR THE BEST AGENTS" ........131 FIGURE 65: OPINION: "MANY STAFF DO NOT / WOULD NOT HAVE ANYWHERE SUITABLE TO WORK IN THEIR HOMES" .........................132 FIGURE 66: OPINION: "HOMEWORKING REDUCES / WOULD REDUCE THE COST OF EQUIPMENT" ....................................................133 FIGURE 67: NON-CONTACT CENTER STAFF HANDLING SUBSTANTIAL NUMBERS OF CALLS ...............................................................134 FIGURE 68: CURRENT USE OF IP, BY CONTACT CENTER SIZE .....................................................................................................139 FIGURE 69: FUTURE IMPLEMENTATION OF PURE IP, BY CONTACT CENTER SIZE ............................................................................140 FIGURE 70: MAIN DRIVERS FOR MOVING TO IP, BY CONTACT CENTER SIZE .................................................................................141 FIGURE 71: HOW HAS MOVING TO A SINGLE IP NETWORK CHANGED YOUR TELECOMS AND NETWORKING COSTS? .............................142 FIGURE 72: HOW HAS IMPLEMENTING IP IMPROVED YOUR CONTACT CENTER? (BY CONTACT CENTER SIZE) ......................................143 FIGURE 73: DOES YOUR CONTACT CENTER TAKE PAYMENTS OVER THE PHONE? (BY VERTICAL MARKET) ............................................144 FIGURE 74: PROPORTION OF CALLS REQUIRING CALLER IDENTIFICATION, BY VERTICAL MARKET .......................................................146 FIGURE 75: CALLER IDENTITY AUTHENTICATION METHODS ......................................................................................................148 FIGURE 76: TIME TAKEN TO AUTHENTICATE CALLER IDENTITY, BY VERTICAL MARKET.....................................................................148 FIGURE 77: USE OF TOUCHTONE IVR AND SPEECH RECOGNITION TO ROUTE CALLS, BY VERTICAL MARKET .........................................155 FIGURE 78: USE OF TOUCHTONE IVR AND SPEECH RECOGNITION TO ROUTE CALLS, BY CONTACT CENTER SIZE....................................157 FIGURE 79: TOUCHTONE IVR LEVELS..................................................................................................................................157 FIGURE 80: TOUCHTONE IVR ROUTING OPTIONS, BY VERTICAL MARKET ....................................................................................159 FIGURE 81: CAPABILITY OF ROUTING CALLS AUTOMATICALLY DEPENDING ON THE CUSTOMER HISTORY ............................................161 FIGURE 82: REASONS GIVEN FOR DISLIKE OF CONTACT CENTER QUEUING ...................................................................................164 FIGURE 83: USE OF WEBSITE 'CALL-ME' BUTTONS AND CALL-BACK OPTIONS, BY CONTACT CENTER ACTIVITY TYPE ...............................166 6
- 7. FIGURE 84: USE OF WEBSITE 'CALL-ME' BUTTONS AND CALL-BACK OPTIONS, BY VERTICAL MARKET .................................................167 FIGURE 85: USE OF WORKFORCE MANAGEMENT, BY VERTICAL MARKET .....................................................................................172 FIGURE 86: USE OF WORKFORCE MANAGEMENT, BY CONTACT CENTER SIZE ...............................................................................173 FIGURE 87: DRIVERS FOR WORKFORCE MANAGEMENT ...........................................................................................................174 FIGURE 88: THE IMPORTANCE OF MULTICHANNEL FORECASTING AND SCHEDULING......................................................................175 FIGURE 89: WHICH CHANGES TO YOUR WORKFORCE MANAGEMENT SYSTEMS WOULD BENEFIT YOU MOST? .....................................177 FIGURE 90: HEADSET MANUFACTURERS USED BY RESPONDENTS ..............................................................................................180 FIGURE 91: WHAT SORT OF IP PHONE DEVICE ARE YOU USING? ...............................................................................................182 FIGURE 92: USE OF SINGLE AND DUAL EARPIECE HEADSETS .....................................................................................................182 FIGURE 93: MULTIMEDIA CHANNELS ..................................................................................................................................189 FIGURE 94: CURRENT USE AND FUTURE PLANS FOR NON-VOICE CHANNELS.................................................................................195 FIGURE 95: INBOUND INTERACTIONS BY CHANNEL ................................................................................................................196 FIGURE 96: CHANNEL USAGE ............................................................................................................................................196 FIGURE 97: INBOUND INTERACTIONS BY CHANNEL, BY VERTICAL MARKET ...................................................................................197 FIGURE 98: HOW ARE INBOUND CHANNELS CHANGING IN YOUR CONTACT CENTER? ....................................................................198 FIGURE 99: INBOUND INTERACTIONS THAT ARE EMAIL, BY VERTICAL MARKET..............................................................................200 FIGURE 100: INBOUND INTERACTIONS THAT ARE EMAIL, BY CONTACT CENTER SIZE ......................................................................200 FIGURE 101: WHAT PROPORTION OF EMAILS ARE ANSWERED SUCCESSFULLY AND COMPLETELY WITHIN THESE TIMESCALES? ...............202 FIGURE 102: USE OF MULTIMEDIA BLENDED AGENTS BY VERTICAL MARKET ................................................................................203 FIGURE 103: METHODS OF MULTIMEDIA BLENDING ..............................................................................................................204 FIGURE 104: THE EFFECT OF MULTIMEDIA BLENDING ON AVERAGE EMAIL HANDLING TIME............................................................205 FIGURE 105: ADVANTAGES AND DISADVANTAGES OF TOUCHTONE IVR .....................................................................................209 FIGURE 106: SOME FUNCTIONS FOR SELF-SERVICE, BY VERTICAL MARKET ..................................................................................210 FIGURE 107: OVERALL PROPORTION OF CALLS HANDLED ENTIRE THROUGH SELF-SERVICE (ONLY IN RESPONDENTS WHICH OFFER TELEPHONY SELF-SERVICE) ........................................................................................................................................................213 FIGURE 108: PROPORTION OF SELF-SERVICE CALLS HANDLED THROUGH TOUCHTONE IVR OR AUTOMATED SPEECH RECOGNITION, BY VERTICAL MARKET ...................................................................................................................................................214 FIGURE 109: INHIBITORS OF MOVEMENT FROM TOUCHTONE IVR TO AUTOMATED SPEECH RECOGNITION ........................................216 FIGURE 110: WHICH OF THE FOLLOWING COMMENTS DESCRIBES HOW YOUR COMPANY VIEWS SOCIAL MEDIA? ................................221 FIGURE 111: CURRENT USAGE OF SOCIAL MEDIA ..................................................................................................................222 FIGURE 112: USEFULNESS OF SOCIAL MEDIA FOR BUSINESS ACTIVITIES ......................................................................................223 FIGURE 113: AGENTS CAPABLE OF CROSS-SELLING AND UP-SELLING, WITH FUTURE REQUIREMENTS, BY VERTICAL MARKET ..................233 FIGURE 114: AGENTS CAPABLE OF CROSS-SELLING AND UP-SELLING, WITH FUTURE REQUIREMENTS, BY CONTACT CENTER SIZE .............234 FIGURE 115: INHIBITORS TO CROSS-SELLING AND UP-SELLING .................................................................................................234 FIGURE 116: COMPARED TO 12 MONTHS AGO, THIS FACTOR HAS BECOME MORE IMPORTANT WITHIN OUR CONTACT CENTER .............241 FIGURE 117: COMPARED TO 12 MONTHS AGO, THIS FACTOR HAS BECOME MORE IMPORTANT WITHIN OUR CONTACT CENTER (BY VERTICAL MARKET) ...............................................................................................................................................................242 FIGURE 118: HAVE CLOUD, HOSTED OR MANAGED SERVICES MADE ANY DIFFERENCE TO YOUR CONTACT CENTER? .............................250 FIGURE 119: WHAT CONCERNS DO YOU HAVE ABOUT CLOUD OR HOSTED SOLUTIONS? ................................................................252 FIGURE 120: OUTBOUND ACTIVITY ....................................................................................................................................254 FIGURE 121: AUTOMATED OR LIVE OUTBOUND CALLING, BY VERTICAL MARKET ..........................................................................256 FIGURE 122: USE OF HOSTED OR CPE DIALERS.....................................................................................................................257 FIGURE 123: MAXIMUM TARGET LEVEL FOR OUTBOUND ABANDONED / SILENT CALLS ..................................................................258 7
- 8. FIGURE 124: USE OF ANSWER MACHINE DETECTION (AMD) ..................................................................................................259 FIGURE 125: USE OF CALL BLENDING BY CONTACT CENTER SIZE................................................................................................261 FIGURE 126: AVERAGE SPEED TO ANSWER, BY CALL BLENDING ENVIRONMENT TYPE.....................................................................262 FIGURE 127: THE IMPORTANCE OF DRIVERS FOR TACTICAL AND PROJECT-BASED OUTSOURCING .....................................................265 FIGURE 128: AGENT ATTRITION RATE RANGES......................................................................................................................275 FIGURE 129: MEAN AND MEDIAN AGENT ATTRITION BY VERTICAL MARKET ................................................................................276 FIGURE 130: CHANGES IN AGENT ATTRITION RATE IN THE PAST 12 MONTHS, BY VERTICAL MARKET.................................................277 FIGURE 131: AGENT ATTRITION RATE BY CONTACT CENTER SIZE ...............................................................................................278 FIGURE 132: CHANGES IN AGENT ATTRITION IN PAST 12 MONTHS, BY CONTACT CENTER SIZE ........................................................279 FIGURE 133: AGENT ATTRITION RATE BY CONTACT CENTER ACTIVITY TYPE ..................................................................................280 FIGURE 134: CHANGE IN AGENT ATTRITION IN PAST 12 MONTHS, BY CONTACT CENTER ACTIVITY TYPE.............................................281 FIGURE 135: REASONS FOR AGENT ATTRITION (RANKED IN ORDER) ..........................................................................................282 FIGURE 136: METHODS OF MOTIVATING AND RETAINING AGENTS............................................................................................283 FIGURE 137: SHORT-TERM ABSENCE BY VERTICAL MARKET .....................................................................................................286 FIGURE 138: SHORT-TERM ABSENCE BY CONTACT CENTER SIZE ................................................................................................286 FIGURE 139: SHORT-TERM ABSENCE BY CONTACT CENTER ACTIVITY ..........................................................................................287 FIGURE 140: SHORT-TERM ABSENCE BY CONTACT CENTER ACTIVITY TYPE ...................................................................................287 FIGURE 141: THE EFFECTIVENESS OF RECRUITMENT METHODS ................................................................................................291 FIGURE 142: PROPORTION OF RECRUITMENT EFFORT GIVEN TO AGENT REPLACEMENT, BY VERTICAL MARKET....................................292 FIGURE 143: THE MOST IMPORTANT ABILITIES OR CHARACTERISTICS OF A SUCCESSFUL CONTACT CENTER AGENT ...............................293 FIGURE 144: AGENT SALARY CHANGES IN THE PAST 12 MONTHS .............................................................................................295 FIGURE 145: SALARIES BY VERTICAL MARKET BY JOB ROLE ......................................................................................................296 FIGURE 146: NEW AGENT SALARIES ...................................................................................................................................297 FIGURE 147: EXPERIENCED AGENT SALARIES ........................................................................................................................297 FIGURE 148: TEAM LEADER SALARIES .................................................................................................................................298 FIGURE 149: CONTACT CENTER MANAGER SALARIES..............................................................................................................298 FIGURE 150: SALARIES BY CONTACT CENTER TYPE .................................................................................................................299 FIGURE 151: SALARIES BY CONTACT CENTER ACTIVITY TYPE .....................................................................................................300 FIGURE 152: SALARIES BY CONTACT CENTER SIZE ..................................................................................................................301 FIGURE 153: ANNUAL BONUS FOR SERVICE AND SALES AGENTS ...............................................................................................302 FIGURE 154: SERVICE-RELATED PERFORMANCE TARGETS USED FOR BONUSES .............................................................................303 FIGURE 155: MOST IMPORTANT AREAS OF IT EXPENDITURE IN THE NEXT TWO YEARS...................................................................308 FIGURE 156: MOST IMPORTANT AREAS OF IT EXPENDITURE IN THE NEXT TWO YEARS...................................................................310 FIGURE 157: MOST PRESSING MANAGERIAL ISSUES ...............................................................................................................314 FIGURE 158: MOST PRESSING MANAGERIAL ISSUES, BY VERTICAL MARKET .................................................................................314 FIGURE 159: MOST PRESSING MANAGERIAL ISSUES, BY CONTACT CENTER SIZE ............................................................................315 FIGURE 160: THE IMPORTANCE OF INDUSTRY TRENDS............................................................................................................317 FIGURE 161: THE IMPORTANCE OF INDUSTRY TRENDS, BY VERTICAL MARKET ..............................................................................318 FIGURE 162: THE IMPORTANCE OF INDUSTRY TRENDS, BY CONTACT CENTER SIZE.........................................................................319 FIGURE 163: DOES YOUR CONTACT CENTER PROVIDE STRUCTURED AND ACTIONABLE INSIGHT INTO THE FOLLOWING? (BY VERTICAL MARKET) ...............................................................................................................................................................321 FIGURE 164: DOES YOUR CONTACT CENTER PROVIDE STRUCTURED AND ACTIONABLE INSIGHT INTO THE FOLLOWING? (BY CONTACT CENTER SIZE).....................................................................................................................................................................322 8
- 9. FIGURE 165: DOES YOUR EXECUTIVE BOARD SEE THE CONTACT CENTER AS A STRATEGIC ASSET OR OPERATIONAL COST CENTER? (BY VERTICAL MARKET) ..................................................................................................................................................323 FIGURE 166: DOES YOUR EXECUTIVE BOARD SEE THE CONTACT CENTER AS A STRATEGIC ASSET OR OPERATIONAL COST CENTER? (BY CONTACT CENTER SIZE) ............................................................................................................................................324 9
- 10. DEDICATED TO SERVING THE CONTACT CENTER INDUSTRY ABOUT THE AMERICAN TELESERVICES ASSOCIATION The American Teleservices Association (ATA - www.ataconnect.org) is the only non-profit trade organization dedicated exclusively to the advancement of companies that utilize contact centers as an integral channel of operations. ATA members include companies with inbound or outbound contact centers, users of Teleservices, trainers, consultants, and equipment suppliers who initiate, facilitate, and generate telephone, Internet, and e-mail sales, service, and support. Founded in 1983, the American Teleservices Association (ATA) represents more than 4,000 contact centers that account for over 1.8 million professionals worldwide. Contact centers offer traditional and interactive services that support the e-commerce revolution, provide specialized customer service for Fortune 500 companies, and generate annual sales of more than $900 billion. ATA provides leadership in the professional and ethical use of the telephone for conducting business and is committed to serving the needs of its members, recommending the highest standards of quality for the channel and protecting the rights of consumers. Members benefit from the ATA’s strong advocacy at the national and state level; advanced and timely educational opportunities and business building events; advocacy and support in the public realm; and rich and trusted resources for Teleservices professionals. Our Mission ATA is committed to serving the needs of its members by recommending the highest standards of quality for the channel and protecting the rights of consumers. ATA values members by providing essential business elements in the form of: • forums for networking at international, national and regional levels; • programs for business learning; • advocacy of Teleservices users' and providers' interests before State and Federal government; • research on consumer and regulatory topics of interest to Teleservices users and providers; • consensus, voluntary guidelines for industries who utilize Teleservices in their business operations; • information about global developments in Teleservices; and • education of the general public and media to promote Teleservices providers' and users' business interests of their strong commitment to customer service and satisfaction. 10
- 11. INTRODUCTION AND METHODOLOGY th The "US Contact Center Decision-Makers' Guide (2012 -5 edition)" is the major annual report studying the performance, operations, technology and HR aspects of US contact center operations. Taking a random sample of the industry, a detailed structured questionnaire was asked to 210 contact center managers and directors between November 2011 and February 2012. Analysis of the results was carried out in th February and March 2012. The result is the 5 edition of the largest and most comprehensive study of all aspects of the US contact center industry. ContactBabel is very grateful to the support which it has received from all of the sponsors of the report. However, complete editorial independence has been insisted upon and given at all stages, and readers can be confident about the objectivity of the report’s findings. HOW TO USE THE REPORT Unlike previous reports, which looked at discrete solutions without prior reference to the commercial and operational issues which they address, the US Contact Center Decision-Makers' Guide first identifies six of the major pain points and issues that affect the contact center industry: • Improving quality and performance • Maximizing efficiency and agent optimization • New media and the customer of the future • Increasing profitability • HR management • Strategic directions. Within each section, specific solutions are identified that can be used to solve these issues, along with the analysis of the primary research data that are relevant to this area, including a comprehensive statistical analysis in graphical and tabular form. Third-party White Papers, case studies and thought leadership pieces may also be used to assist readers who may wish to look more in-depth at specific areas or gain another viewpoint. The report also contains a Supplier Directory, of organizations which provide services, products and solutions to the US contact center industry, divided by discrete category. An Interactive Supplier Matrix, which allows readers to cross-reference specific commercial issues with the solutions available can be downloaded from www.contactbabel.com as an Excel spreadsheet. 11
- 12. SEGMENTATIONS Looking at industry averages for contact center statistics is only so useful. Only with a clear understanding of how and why metrics differ between operations can readers see where they stand compared to their competitors. As such, key statistics have been segmented in many different ways where relevant and possible: • by vertical market (industry sector) • by contact center size (agent positions) • by contact center type (e.g. inbound/outbound). We may also segment data along other lines (e.g. sales / service, and by region) where possible and relevant. VERTICAL MARKETS Where possible, we have segmented and analyzed data along vertical market (business sector) lines, to highlight the specific issues and environments particular to that vertical industry. Below are the eleven vertical markets studied within this report which had sufficient respondents to justify inclusion. Figure 1: Vertical market definitions Vertical market Sub-sectors Entertainment & Leisure Hotels, gambling, travel companies Finance Banks, credit cards, loans, debt collection, credit checking, corporate Insurance Insurance for medical, dental, life, motor, house, corporate, reinsurance Manufacturing Mainly B2B sales and support, along with customer helplines Medical Pharmaceutical, hospitals, medical associations, non-insurance medical Outsourcing Large full-service outsourcers and smaller telemarketing firms Public Sector Government, central and local, agencies, emergency services Retail & Distribution Retailers, etailers, home shopping, catalog, parcel carriers, logistics Services Non-physical service offerings to public and business Technology, Media and Technology sales and service B2B & B2C; Cell and fixed line operators, TV Telecoms (TMT) and cable providers; Broadband 12
- 13. SIZE BAND Almost every survey question is considered from the size aspect, as differences in resources, management techniques and technology vary greatly between size bands. Contact centers surveyed fit into one of three categories: • Small - 10 to 50 agent positions • Medium - 51 to 200 agent positions • Large – over 200 agent positions. CONTACT CENTER TYPE Whether a contact center is predominantly inbound or outbound can fundamentally determine how the contact center is run. Therefore, we sometimes analyze data by contact center type: • Inbound: more than 75% of work is inbound • Outbound: more than 75% of work is outbound • Mixed: less than 75% of work is either inbound or outbound. THE STRUCTURE OF THE DATASETS The data provided by the 210 contact centers interviewed in this study were broken down into discrete segments: Vertical markets • Entertainment & Leisure - 8 • Finance - 29 • Insurance - 16 • Manufacturing - 12 • Medical - 18 • Outsourcing - 40 • Public Sector - 10 • Retail & Distribution - 11 • Services - 26 • Technology, Media and Telecoms (TMT) - 31 • Others (not included in vertical analysis): 10 13
- 14. Size bands • Small (10 to 50 agent positions) - 68 • Medium (51 to 200 agent positions) - 76 • Large (200+ agent positions) – 66. Inbound / outbound • Mostly inbound (75%+ inbound) - 101 • Mixed (between 25% and 75% inbound and outbound) - 64 • Mostly outbound (75%+ outbound) – 45. DISTRIBUTION AND USE OF THIS REPORT This report is written for the community of people interested in the present and future performance of the US contact center industry. Amongst others, these may include: • Contact center managers and directors • HR managers and directors • Operations managers and directors • Customer service directors and those involved in contact center strategy • IT managers and directors • Contact center solution providers: hardware, software & services • Outsourcers • Consultants • Training providers • New entrants to the US contact center industry • Government bodies • Academic institutions • Contact center industry organizations • Regional & national development/inward investment agencies. No sharing, swapping, gifting, photocopying or other dissemination of this report must occur without prior written permission from ContactBabel. All content is strictly © ContactBabel 2012. ContactBabel is not responsible for the content of outside agencies that are linked to via this report. All external files are downloaded at the risk of the user. 14
- 15. THE SUPPLIER DIRECTORY SOLUTION TYPES Contact Center Productivity Solutions ............................................................................................................................................ II Contact Center Solutions ................................................................................................................................................................ II Identification and Verification (ID&V) ............................................................................................................................................. V Industry Associations & Information .............................................................................................................................................. V Interaction Analytics & Recording................................................................................................................................................. VI Talent Measurement & Recruitment Solutions ............................................................................................................................ VII Visual Dialing ................................................................................................................................................................................. VII Workforce Optimization Solutions............................................................................................................................................... VIII SOLUTION PROVIDERS ATA (American Teleservices Association) V CallCopy VIII Contact Center Pipeline VI Enghouse Interactive II Fonolo VII inContact III Interactive Intelligence III Knowlagent II Nuance V SHL VII UTOPY VI Verint VIII Vocalcom IV Zeacom IV
- 16. CONTACT CENTER PRODUCTIVITY SOLUTIONS CONTACT CENTER SOLUTIONS Knowlagent provides the only call center software that increases agent productivity by delivering shrinkage activities during idle time. Enghouse Interactive delivers technology and expertise to maximize the value of every Knowlagent creates active wait time through customer interaction. dynamically delivered sessions for common shrinkage activities between customer The company develops the world's most comprehensive portfolio of interaction interactions. Knowlagent’s solutions are on- management solutions, spanning structured, demand, easy to use and require no capital unstructured and self-service interactions. Core expenditures. technologies include contact center, attendant Over 300,000 agents and managers around the console, IVR and call recording solutions and world use Knowlagent’s solutions every day. more that support any telephony environment, on premise or in the cloud. For more information, call 888-566-9457 or visit us online at www.knowlagent.com. Enghouse Interactive has thousands of customers worldwide, supported by a global network of Contact: partners and more than 600 dedicated staff across the company’s 16 international Debbie Dockery operations. Enghouse Interactive is the union of t: 678-356-3500 x1 well-regarded specialists including Arc, CosmoCom, Datapulse, Syntellect, Telrex and e: ddockery@knowlagent.com Trio. w: www.knowlagent.com Contact: e: info.ei@enghouse.com w: www.enghouseinteractive.com t: +1 800.788.9733 or +1 602.789.2800 II
- 17. Improve the future of your call center with inContact. Our hosted call center software solutions are smarter and we have the in-house expertise to not only make your life easier but enable you to increase uptime, reduce security Deliberately Innovative All-in-One Communications for vulnerability and increase the strength and profitability of Business and the Cloud. your business. Interactive Intelligence is a global provider of unified We Make Operating a Profitable Call Center Easy business communications solutions for contact center As the leading cloud-based contact center provider, we automation, unified communications, and business can: process automation. • Have you up and running fast • Make it possible to do business the way that works for The company’s standards-based all-in-one you: at-home, globally, or from multi-site locations communications software suite is designed to eliminate • Enable the most productive and cost-effective agent the cost and complexity of multi-point systems, and to arrangement support integration to existing business systems and • Help you automate mundane service processes so you new technologies. can focus on more important business activities • Reduce your IT costs and eliminate technical hassles Founded in 1994 and with more than 4,500 customers • Seamlessly integrate with multiple in-house and worldwide, Interactive Intelligence is an experienced commercial technologies, including CRM systems leader in delivering customer value through its on- premise and cloud-based Communications as a Service inContact At-A-Glance (CaaS) solutions, including software, hardware, • Over 1,000+ call center deployments consulting, support, education and implementation. • Used by over 65,000 agents globally • Over one billion+ calls handled per year Contact: • Industry’s best-published service level agreement of 99.99% World Headquarters • Over 100 integrations to top CRMs a: 7601 Interactive Way, Indianapolis, IN 46278 USA Contact: Corporate Headquarters - a: 7730 South Union Park Avenue, t/f: +1 317 872-3000 Suite 500, Salt Lake City, UT 84047 t: (Sales): 1.866.965.7227 (866.965.SaaS) EMEA t: (Main): 1.801.320.3200/1.800.999.7691 e: info@inContact.com / w: www.inContact.com a: Thames Central, Hatfield Road, Slough, Berkshire, SL 1 1QE (UK) European Headquarters - a: Lloyd's Building, 4th Floor, 12 Leadenhall Street London, EC3V 1LP / t: +44.(0)207.816.5926 t/f: +44 (0) 1753 418800 III
- 18. Vocalcom is a global leader in manufacturing and implementation of Call Center Solutions. ACD, IVR, CTI, predictive dialing, scripting, reporting, Zeacom delivers award-winning Multimedia recording and multimedia communications under a Contact Center, Unified Communications and fully web enabled architecture. Business Process Automation solutions to more Vocalcom’s award winning call center technology than 4,000 sites worldwide. offerings include; inbound, outbound call blending with true predictive dialing, integrated customer Established in 1994, Zeacom has offices in the relationship management, email, fax, web & video USA, UK, Australia, and New Zealand, and chat, social media integration directly from the distributor relationships that extend into an agent desktop. See why over 5,000 call centers in additional 30 markets. 41 countries and 650,000 agents are using Vocalcom solutions. Zeacom Communications Center (ZCC) is a Multimedia Contact Center and Unified If you are looking for a thin client call center Communications solution that allows you to solution for your remote or home agents or to easily and effectively manage all your business replace complex legacy third party applications, communications in a single application, Vocalcom’s Hermes.Net will be perfectly suited to regardless of whether it’s phone calls, answer all your contact center needs no matter voicemail, e-mail, fax, webchat, SMS or social what your infrastructure requirement: stand alone, media. PBX integrated or hosted. Contact: ZCC integrates with NEC, Cisco and Avaya PBX platforms, and interoperates with Microsoft George Seroukas Lync. t: +1 888.622.5266 – 188VOCALCOM Contact: e: operations@vocalcomusa.com t: +1 949 261 3580 or toll free at 1 800 513 w: www.vocalcom.com 9002 w: www.zeacom.com IV
- 19. IDENTIFICATION AND VERIFICATION (ID&V) INDUSTRY ASSOCIATIONS & INFORMATION The American Teleservices Association (ATA) is the only non-profit trade organization dedicated exclusively to the advancement of companies that utilize contact about Nuance Communications centers as an integral channel of operations. ATA Nuance is a leading provider of voice and language members include companies with inbound or outbound solutions for businesses and consumers around the contact centers, users of Teleservices, trainers, world. Its technologies, applications and services make consultants, and equipment suppliers who initiate, the user experience more compelling by transforming facilitate, and generate telephone, Internet, and e-mail the way people interact with information and how they sales, service, and support. create, share and use documents. Every day, millions of Founded in 1983, the ATA represents more than 4,000 users and thousands of businesses experience Nuance’s contact centers that account for over 1.8 million proven applications and professional services. professionals worldwide. Contact centers offer about Nuance Voice Biometrics traditional and interactive services that support the e- commerce revolution, provide specialized customer Nuance is the global leader in voice biometric solutions, service for Fortune 500 companies, and generate annual with over 15 million enrolled voiceprints and a global sales of more than $900 billion. customer base that spans all major industries. Nuance has developed over the last 12 years unrivaled ATA provides leadership in the professional and ethical experience in delivering successful voice biometric use of the telephone for conducting business and is solutions that enable enterprises to improve customer committed to serving the needs of its members, satisfaction, reduce costs and improve security. recommending the highest standards of quality for the channel and protecting the rights of consumers. Contact: Members benefit from the ATA’s strong advocacy at the national and state level; advanced and timely w: (Nuance) - nuance.com educational opportunities and business building events; w: (Nuance Voice Biometrics) - advocacy and support in the public realm; and rich and www.nuance.com/voice-biometrics trusted resources for Teleservices professionals. e: (Voice biometrics inquiries) - Contact: SalesVoiceBiometrics@nuance.com w: www.ataconnect.org V
- 20. INTERACTION ANALYTICS & RECORDING Contact Center Pipeline is a monthly instructional journal focused on driving business success through effective contact center direction and decisions. Our goal is to provide contact center UTOPY offers Customer Interaction Analytics professionals with valuable content, insights, powered solutions which unify the voice of the research and advice from trusted and respected customer and analyze agent performance industry experts and practitioners. across all contact channels. UTOPY pioneered the Customer Interaction Analytics industry by Each issue contains informative articles, case studies, best practices, research and coverage of releasing the first Speech Analytics solution for trends, technology and people issues that impact business purposes in 2002. the customer experience. Our writers and As customer usage of non-voice channels such contributors have a unique understanding of how as email, web chat and social media has grown to optimize resources and maximize the value the dramatically, UTOPY has evolved with organization provides to its customers. customer preferences, delivering end-to-end Draw upon CCP’s incisive analysis to help you make analysis of the entire customer interaction and better decisions about your career and your center. feedback lifecycle, regardless of the mode of Contact: communication used by the customer. Linda Harden, Publisher Contact: e: linda@contactcenterpipeline.com w: www.utopy.com or www.speechanalytics.com t: 443-909-6951 t: 866.44.UTOPY (866.448.8679) w: www.contactcenterpipeline.com VI
- 21. TALENT MEASUREMENT & RECRUITMENT SOLUTIONS VISUAL DIALING With Fonolo’s visual dialing solutions, your SHL is the global leader in talent assessment customers can now reach call center agents with solutions, driving better business results for one click -- no navigating phone menus or waiting clients through superior people intelligence on hold. and decisions – from hiring and recruiting, to Our cloud-based service adds a new visual interface employee development and succession to your call center that lives on your website or planning. mobile app. This approach reduces misnavigation and average handle times, lowering your cost-per- With a presence in over 50 countries, SHL call while improving the customer experience. All delivers more than 25 million assessments of this is possible without any call center annually in over 30 languages – allowing clients integration or changes to infrastructure. to benefit from both global expertise and local Bottom line: Happier customers and a more insight. efficient call center. Along with its world-class consulting practices Contact: and 24-hour support center, SHL clients can Fonolo access over 1,000 assessments through an a: 688 Richmond Street West, Suite 204 , Toronto, easy-to-use technology platform. Ont, Canada M6J 1C5 Contact: t: 416-366-2500 w: www.shl.com f: 416-366-9890 t: 800-899-7451 e: info@fonolo.com or sales@fonolo.com w: http://fonolo.com VII
- 22. WORKFORCE OPTIMIZATION SOLUTIONS CallCopy, a leading provider of innovative call Verint® (NASDAQ: VRNT) is a global leader in recording and contact center solutions, is Actionable Intelligence® solutions and value- dedicated to ensuring the highest standards of added services. customer and employee satisfaction. The award- winning, enterprise-proven cc: Discover suite Our solutions capture and analyze complex, delivers advanced call recording, screen capture, underused information sources, such as voice, quality management, speech analytics, desktop video, and unstructured text, to enable analytics, performance management, customer organizations to make more timely, effective survey and workforce management capabilities decisions. to organizations of all sizes and industries across the globe. Today, more than 10,000 organizations in 150 countries — including over 85 percent of the CallCopy empowers these organizations to gather Fortune 100 — use our solutions to improve business intelligence, which is leveraged to enterprise performance and make the world a maximize operational performance, reduce safer place. liability, achieve regulatory compliance and increase customer satisfaction. Verint is headquartered in Melville, NY, with Contact: 3,100 dedicated professionals, offices worldwide, and an extensive global partner CallCopy network. Verint is a member of the Russell a: 530 W. Spring St., Columbus, OH 43215 3000 Index. t: 888.922.5526 Contact: e: info@callcopy.com www.verint.com w: www.callcopy.com VIII
- 23. IMPROVING QUALITY AND PERFORMANCE Within this chapter, methods and solutions are discussed that improve the quality of the customer experience and allow the contact center to gain insight into each customer and agent to improve their own business strategy. Topics include: • Interaction recording and analytics • Scripting and the unified desktop • Customer satisfaction and complaints • Queue management systems • Training and coaching. 23
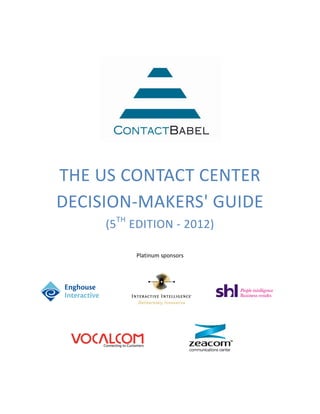
- 24. INTERACTION RECORDING For the past decade, there has been increasing desire within contact centers to improve upon customer satisfaction and experience, in order to keep customers loyal and profitable for longer. ContactBabel studies have consistently shown that increasing customer satisfaction is the no.1 focus of US contact centers, outperforming other key areas such as decreasing costs or increasing sales. Call recording and monitoring may have been around for a long time, but it is at the forefront of the battle to improve quality and thus customer satisfaction and loyalty. The new generation of interaction recording solutions brings the whole contact center into play, potentially gaining at several levels of the business through using the solution in different ways. Call recording is one of the most prevalent contact center solutions, having many applications around quality assurance, compliance, security and agent training. It is used by 80% of respondents, 18% of which state that they wish to replace or upgrade their current system. Only 5% of respondents have no intention of using call recording. Figure 2: Current and future use of call recording, by vertical market Current and future use of call recording, by vertical market 100% 4% 5% 6% 11% 9% 9% 9% 14% 15% 2% 90% 20% 20% No plans to 17% 9% 12% implement 80% 22% 35% 27% 8% 20% 18% 29% 14% 70% 20% 4% Likely to 60% implement after 12 months 18% 25% 50% 89% Likely to 40% 80% implement within 67% 12 months 65% 64% 66% 30% 60% 60% 57% 45% Currently use, 20% 40% looking to replace/upgrade 10% Currently use, no 0% plans to replace/upgrade The majority of respondents in all sectors surveyed, use call recording today, a solid background upon which new applications based on call recordings can thrive. 24
- 25. 75% of people would do business with a company based on a 50% of people great call center zstopped doing business experience. with a company due to poor customer service. Which Side Are You On? In today's highly competitive market, providing superior customer service is critical to an organization's success. cc: Discover, CallCopy’s award-winning workforce optimization (WFO) suite, enables organizations to maximize customer satisfaction by gaining a deeper understanding of their customer interactions. Learn how you can benefit from the solution rated #1 in Overall Product and Vendor satisfaction. Go to callcopy.com/report Voice and Screen Recording | Quality Assurance PCI Compliance | Workforce Management | Agent Coaching Performance Management | Customer Surveys Speech Analytics | Desktop Analytics callcopy.com 888.922.5526
- 26. Contact centers considering replacing legacy call recording systems will benefit greatly from the latest generation of WFO solutions that feature seamless integration of capabilities, easy-to-learn-and-use intuitive interfaces, flexibility to support back-office applications, and reliable vendor support. Timely ROI comes not only from operating efficiency improvements and increased customer satisfaction, but also from lower licensing, maintenance and upgrade costs. The use of call recording is influenced by the size of the contact center operation although the figure of 69% penetration in small operations shows that vendors have been able to offer solutions successfully at various price points. Figure 3: Current and future use of call recording, by contact center size Current and future use of call recording, by contact center size 100% 2% 3% 6% 2% 3% 12% 3% 2% 90% 2% 15% 12% 18% 80% 18% 10% 14% 70% 60% 14% No plans to implement Likely to implement after 12 months 50% Likely to implement within 12 months Currently use, looking to replace/upgrade 40% 75% Currently use, no plans to replace/upgrade 71% 66% 30% 55% 20% 10% 0% Small Medium Large Average The new generation of interaction recording solutions brings the whole contact center into play, potentially gaining at several levels of the business through using the solution in different ways. The traditional user of interaction recording solutions has been the contact center supervisor or team leader. The supervisor deals heavily with quality monitoring at the agent and team level, using the recording facility along with 26
- 27. data about the call (e.g. deal size) to provide examples of best practice to other team members. This means the supervisor does not have to listen in live to the call, but can choose which ones to listen to, and when. This considerably reduces cost. The supervisor may also be responsible for customer dispute resolution, and can find out exactly what has been said by customer and agent in order to deal with the matter accurately. In industries where recording may be a legal requirement – an increasing trend - businesses may have compliance officers to deal with disputes. Even in areas which do not require bulk recording, many companies look upon this solution as a tool to protect against an increasingly litigious world. With some of the more sophisticated interaction recording solutions available, the supervisor can move into a more analytical role, understanding not only what has happened, but the reasons for it as well. Taking a top-level view of team performance, a supervisor may see that certain types of call have been dealt with very quickly by a specific agent. Standard management information systems may show this as a positive situation, but using interaction recording capabilities may illustrate that this agent cannot help the customers, and is simply passing the calls through to colleagues. Now the supervisor has a chance to improve the situation, rather than missing the problem in the first place which may happen without this interaction analysis. Agents can be given the chance to add to the value which interaction recording can provide. By using agent- initiated tagging of calls, your front-line team can add to the store of useful information which the company as a whole acts upon. For example, if customers talk about the competition and what they are offering specifically, these agent-tagged calls can be reviewed for possible action by a business’s commercial team. This has the added benefit of making agents feel a key part of the overall business. A more strategic use of call recording may occur at the management or executive level. When all interactions are recorded and analyzed, a complete performance management program may be put in place. Agent performance can be viewed by supervisors, team performances can be analyzed by the operational manager, and contact center performance can be evaluated by executives. Analysis of interactions is also vital as part of a wider process optimisation strategy, to identify good and bad business practices and process bottle-necks. Using interaction recording, the performance of the contact center as a whole can be viewed in terms of quality, not just quantity. Key performance indicators can be set and reviewed (such as average revenue per call), which are directly relevant to the needs of a business as a whole. Contrast this with the traditional efficiency measures of a contact center’s success: average speed to answer, average call duration and occupancy rate. Measurement and improvement in key performance indicators, due to interaction recording analysis, will help to prove the contact center capable of making a real impact on a company’s profit. Of those contact centers which use interaction recording, the majority use it for both quality assurance and training purposes, so that the supervisor and the agent can both learn from it. Many of those using call recording solutions are trying to get their senior management involved in what goes on within the contact center. Compliance has also been a major reason to implement call recording. 27
- 28. Call recording may be used in three modes: • 100% call recording: often used for compliance purposes, this records the entirety of every call • Random / Scheduled Call Recording: priority-based call recording schedules can be defined based on business rules, using multiple criteria on each schedule • On-Demand Call Recording: contact centers may have situations where they do not need to record an entire call. On-demand recording can be customized to support agent-initiated call recording through a desktop interface, or automated through call recording triggers sent from third-party software. 28
- 29. As the following chart shows, the need to prove compliance with industry regulations is not solely restricted to financial services companies, with outsourcers, insurers and medical respondents particularly aware of their regulatory requirements, with 100% call recording a key element in proving compliance and dispute resolution. Figure 4: Presence of industry-wide regulations requiring compliance, by vertical market Presence of industry-wide regulations requiring compliance, by vertical market 100% 93% 90% 85% 80% 78% 78% 75% 71% 70% 63% 60% 55% 50% 50% 50% 50% 40% 30% 20% 10% 0% As of January 1, 2012, organizations that take payment card data must comply with the Payment Card Industry Data Security Standard (PCI DSS) v2.0. It is highly recommended that when implementing a recording solution, organizations chose one that offers automatic audio and video “blackouts” that will prevent the recording of sensitive cardholder data, in accordance with the PCI DSS. 29
- 30. Survey respondents are very positive about the effectiveness of call recording for quality monitoring and agent training, including the demonstration of best practice to other agents. Recording is also seen by most as an effective tool in proving compliance (most likely to be effective when linked with automated speech analytics that can check specific phrases or sentences have been used in the conversation). However, there is less enthusiasm for call recording's effectiveness at getting feedback from customers - it can be a difficult manual task to pick the right calls to demonstrate customer sentiment - and there is a strong link between those who find call recording very effective and those who use speech analytics. The majority of call recording users find it effective at understanding why customers are calling, which is a similar type of task to getting customer feedback. Call recordings contain vast amounts of information that has the potential to provide valuable insight, such as customer sentiment and reasons for customer calls. The challenge is how to uncover all of this business intelligence without listening to every recording. When deployed in conjunction with call recording, speech analytics automates the process of sifting through thousands of hours of call recordings to uncover otherwise-hidden gems of useful information. 30
- 31. However, call recording by itself does not seem able to provide users with insight into their customers. It is possible in theory to brief agents to record a conversation in which a caller mentions a competitor's name, but in practice the moment will have already passed, and it might be seen as disrupting the flow of the conversation and breaking the agent's concentration in any case. Speech analytics can hunt for specific words and phrases automatically, and should be a more effective method of gaining competitive information, but this is less used by businesses at the moment. Figure 5: Effectiveness of call recording for specific tasks Effectiveness of call recording for specific tasks 100% 1% 1% 1% 1% 3% 5% 4% 2% 11% 9% 1% 90% 3% 18% 11% 6% 80% 30% 11% 22% 11% 40% 18% 70% 60% 33% 18% 27% Don't know / NA 50% Very ineffective 41% Ineffective 40% 21% Neutral 30% 62% Effective 53% 36% Very effective 20% 39% 26% 24% 10% 3% 0% 3% Quality monitoring Agent training / Compliance with Getting feedback Understanding why Learning about demonstrating regulations from customers customers are competitors best-practice about your calling business 31