1. Maximizing PET SSP Line Profitability through
World Scale Process Design and Operations
James F. McGehee & James A. Johnson
UOP LLC*
Des Plaines IL. USA
&
Claudio Bertelli
UOP Sinco Srl
Tortona, Italy
POLYESTER 2004
9th World Congress
December 7-8-9, 2004
Zürich, Switzerland, Swissôtel
Organized by MAACK Business Services
* Contact: www.uop.com
2. INTRODUCTION
The large-scale industrial production of PET resin for fibers has reached its 50th year,
and PET has been established as a container plastic for 30 years. However, PET did
not achieve significant product volumes and market dominance until around 12 years
ago. Over the past 10 years we have seen more major scale-up and technology
improvements for PET resin plants than seen in the first 40.
This paper discusses the requirements necessary for the optimum design and long
term operation of world scale SSP process units. This paper has been able to be
developed by UOP from the experience gained in process design, commissioning and
ongoing service provided to our extensive customer base. Finally, the paper will take
a look ahead at some recent technology developments and whether there could be
technical solutions to further lower the PET Net Cost of Production (NCOP).
In a 2000 industry report (1), it was predicted that PET line sizes would probably
reach the 800-1000 T/d rate in the next decade. This milestone was realized much
quicker, just over three years later in mid-2003 at M&G’s PET resin plant located in
Mexico. Additional world scale process units in this capacity range utilizing UOP
Sinco technology are in operation, as well as under construction, with on stream dates
in Q1 2005. Further increases in PET line size are under active consideration. The
current trend is toward “super-size” 1000+ T/d single melt phase units coupled with 2
individual 500 T/d SSP lines (largest single SSP lines operating world wide). This is
an optimal configuration at current market conditions for new project objectives, as
evidenced by the M&G plant comprising of a single line InvistaTM Continuous
Polymerization and dual line UOP Sinco SSP plants.
The main driver for the continuous increase in production capacity is to lower the
overall cost of producing PET resin. These larger plants produce lower cost PET
resin due to the economy of scale. But as market needs evolve (e.g.- lower cost PET),
even higher SSP rates are required to compete in this global market. The bottlenecks
to such high capacity are not found in the granulators, dense phase conveying and
transfer systems – these can already achieve capacities of over 1000 T/d. Material
conveying systems larger than 10-12 inches in diameter may present the first
mechanical design limits to maximum capacity. However, it is safe to say that the
feasible rates are far above the current industry line rates.
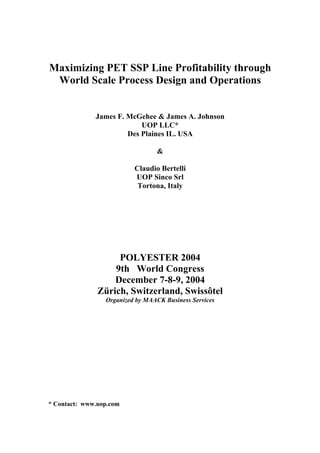
Figure 1 puts in perspective the effects that these capacity improvements have had on
plant costs. This information is based upon representative full-scope projects and
industry reports. During the past decade, as the market for PET grew most
significantly, the “benchmark” integrated PET melt/SSP plant capacity grew from
about 200 T/d to the range of 800-1000 T/d. At the same time, the “battery limits”
plant capital costs dropped from around $900/Annual Ton to a number approaching
$200/Annual Ton for the largest plants. Actual investment costs are highly dependent
upon the location of the installation.
3. Figure 1
World Scale Capital Cost Trend
Estimated ISBL plant cost, $/Ton of combined PET melt and SSP
($=constant 2003, using CE plant cost index)
1000.0
Using 1994 plant configuration and
900.0
"six tenths" rule of typical EEC costs, a simple
capital cost estimating
scaleup to current plant rates
800.0
might have predicted about
700.0 $500/Ton
600.0
$/KMTA
500.0
400.0
...Instead, improved
300.0
productivity, simplification
200.0 of designs and relentless
competition has had about
100.0 twice the effect
0.0
0 200 400 600 800 1000 1200
MT/d
If one were to have applied a “six tenths” rule to the 1994 data, the cost of a current
world-scale plant would be projected at 500 $/Annual Ton. This is significantly
higher than today’s norm. This would substantially reduce the capital contribution to
the Net cost of Production (NCOP), as shown in Figure 2. The impact on PET NCOP
would be in the range of $200/Ton or about $0.09/lb. Thus, The PET industry,
though mature, has not stood still.
While the driving forces toward maximum capacity plants are very strong, it is critical
that with scale-up of plants two key issues be confronted:
• The technical risks need to be understood, managed and controlled
• The plant must run reliably and continuously near its design capacity and
without waste or off-specification product.
These points seem to be obvious, yet are the nexus of the whole issue of plant
economics. The numbers shown above readily answer the question: “Why would
anyone be willing to invest in new technology or a mega-scale plant?” But as a few
bold and forward-looking companies take that risk and pave the way to greater
efficiency, all who follow have to increasingly pay attention to the process plant
design and operation to remain competitive.
Key Process Factors Influencing Cost of Production
The PET plant is relatively simple, inasmuch as yields are practically fixed and
byproduct waste is minimal. Four basic production factors that can increase costs are
outlined as:
4. • Ineffective equipment utilization
• Unscheduled down-time and upsets
• Variations in product quality/ waste
• Transitions during product grade changes, as well as start-up and shutdowns
Figure 2
Cost Comparison of PET Production Scale
Net Cost of Production for PET= $1280/Ton Net Cost of Production for PET=$1080/Ton
Assuming 1994 plant capital costs Target plant at $200/Ton
Assumes EG=$800/MT, TPA=$780/MT Same Raw material costs
5% Capital
14% Capital 5% Fixed
charges
charges costs
3% Utilities
9% Fixed Costs
3% Utilities
74% Raw 87% Raw
materials materials
These costs are obvious and well understood to the production manager. However,
with modern 1000+ T/d lines using the latest technology, it is more critical than ever
to manage these factors in today’s competitive environment. Therefore, each will be
examined here in some detail.
Cost of Ineffective Equipment Utilization
A previous paper (2) addressed the “hidden capacity” in PET lines. Process audits of
UOP Sinco clients have frequently uncovered 5-15 % additional production capacity
requiring only minor process changes, and 50 % or greater with SSP revamps
involving hardware modifications that can take advantage of melt plant capacity
increases. Table 1 lists some of the most common de-bottlenecking targets for the
melt plant, while Table 2 lists some of the primary bottlenecks for SSP. Substantial
throughput increases are achieved by considering the melt and SSP together. These
activities include searching for the optimum recipe and process conditions to attain
5. the highest possible productivity in the finishing reactor, within the constraint of
product properties, as well as increased throughput in the SSP.
Table 1
Melt Plant Typical Bottlenecks
• Raw Materials Handling
• Esterification (heat transfer limits)
• Prepolymer and Finisher
• Polymer Pumps
• Hydraulic Capacity
• Vapor Capacity (entrainment, foaming; fouling issues)
• Granulation
Table 2
SSP Plant Typical Bottlenecks
• Precrystallizer, Crystallizer or Preheater (hold up time or heat transfer)
• Reactor (residence time limit)
• Chips Cooling (heat transfer)
• Material Movement Capability
• Material Handling
• Storage & Product Movement
As resin recipes continue to trend to a higher level of IPA co-monomer (2.5-3.0+
wt%), it is generally not accurate to use process models calibrated for older conditions
to predict line rates. The best approach is to use empirical models based on bench-top
and small batch pilot data as a guide, then study the plant in detail, using a process
simulation package to predict the plant performance for new recipes. UOP Sinco’s
development capabilities can be of great assistance in conducting these types of
measurements to guide future production decisions.
Unscheduled Downtime and Upsets
UOP Sinco customer feedback shows a trend toward uninterrupted melt plant run
lengths of 3+ years for all the major continuous polymerization technologies. This
was fairly uncommon a decade ago.
Prior to 1990-93, the Solid State Polymerization industry generally followed the
processing model of a fiber plant conversion, in which chipped product from the melt
plant fed multiple smaller SSP units usually having 100 T/d capacity. During this
time frame, numerous such SSP plants were built to expand an existing capacity base
or take advantage of a melt plant capacity improvement. In this era, SSP lines could
be started up or idled in a product campaign operation, and it was more typical to
have large intermediate and product storage capability. Therefore the SSP
availability was not as critical.
The situation is completely different in today’s environment of large-scale units. SSP
lines are expected to, and truly do, achieve the same long run lengths as the melt
plants. Achieving this goal requires attention to three basic areas:
• Process design for planned maintenance
• “Clean” process design (high purity inert gas environment)
6. • Preventative maintenance of key equipment
These three areas will each be addressed separately as follows:
Process design for planned maintenance
The design for planned maintenance in the SSP unit is described by the UOP Sinco
philosophy that typical (non-extraordinary) maintenance can be addressed in a
“standby” period of minutes to a few hours, thus avoiding a full shutdown and
maximizing plant technical availability. This philosophy is enabled through a well-
engineered nitrogen circuit design that makes it possible to isolate particular plant
sections, quickly perform planned maintenance, and bring the plant section back on-
line without impacting product quality.
In addition to providing for isolation, blowers and other rotating equipment are
designed for easy access by maintenance personnel, allowing very short time frames
for blower and electric motor bearing lubrication, “V-belt” replacement, and shaft seal
replacement. Many major equipment components are intrinsically designed to require
minimal preventative maintenance altogether, such as special rotary joints with
improved seals, and use of higher temperature lubricants. This is reflected in the
preventative maintenance schedules where intervals of once per month to once every
1-2 years are typical. Each SSP piece of equipment and design detail has to ensure
minimum day to day maintenance and highest reliability.
It is also very important to have a robust process design of the most critical SSP
pieces of equipment that have to withstand the “standby” periods required for
maintenance without affecting product quality. UOP Sinco equipment design allows
holding the PET chips during “standby” periods and prevents sintering phenomena in
the absence of movement. This is very critical both to have a trouble-free restart of the
SSP plant once maintenance is completed and to smoothly bring the plant back into
operation after power outages.
Particular mention should be made of the material handling section (raw materials,
intermediate chip and final product). The last ten years has seen very significant
advances in the reliability of slow-motion conveying systems. Modern systems are
often designed with less wear and include effective clearing cycles and better
instrumentation and control of the critical parameters of pickup velocity and
solids/gas ratio. Enough buffer capacity is provided to manage line clearing or
temporary outage for replacement of rotary valves. By all of these process design
steps, UOP’s SSP process units routinely achieve the same long run lengths as melt
plants before any major downtime or turnaround is required
Clean process design
SSP reaction by-products are typically removed by purging the moving bed chips with
an inert gas (typically countercurrent gas flow). The inert gas must be of high purity
to maximize product yield and quality. The SSP reactions produce mostly water and
ethylene glycol (EG). Hydrocarbons such as EG must be removed to maintain the
reaction equilibrium and minimize unfavorable side reactions. The total material
yield from the process is >99.8 wt-%, and is practically independent of final IV
(intrinsic viscosity). In all cases, poly-condensation of PET also yields a small
7. amount of oligomeric material. The oligomers are characterized as primarily cyclic
molecules containing EG and DEG and from 2-4 repeating TPA units (3,4).
Oligomers occur naturally in PET from "backbiting" reactions between the end groups
and the polymer chains and assume a chemical equilibrium which depends on the end
group concentration. Improved systems for managing and removing this material have
contributed to the increased run lengths of continuous PET polymerization systems.
Some typical oligomeric species are shown in Figure 3. In SSP, the cyclic trimer is a
subliming solid with a nominal melting point (350 ºC) far above the process
temperature. Most of the small amount of dust yield in SSP (aside from fragments of
chips and abrasion dust) is related to oligomers or their reaction products. This
material is a fine powder, and is easily removed from the gas stream. However, a
feature of the cyclic oligomer species is that they are highly reactive. For example, it
is possible to polymerize this material under melt conditions with catalyst to 25,000
MW in less than 15 minutes (5). The same reference describes the observation that
even at 270-280 ºC not all ethylene terephthalate oligomers will melt, but as
polymerization proceeds, lower melting cyclics start polymerizing easily and then
dissolve the remaining high-melting ones.
Figure 3
Oligomers Typically in PET Melt and SSP Process
Major cyclics Minor higher
cyclics:
Mixed G-T-G-D (G-T)n
Dimer
(G-T)3 n= 4-6
Trimer
=O
T= Terephthalic acid
CO-
-OC
Linear (G-T)n n ~ 1-5 =O
G= glycol -OCH2-CH2-O-
D= Diethylene Glycol -(-OCH2-CH2)2-CO-
This scenario can create favorable conditions for binding together the dust, fragments
and whole chips to form adhesive deposits that can block filters, conveying lines, and
other equipment. By maintaining an all-nitrogen environment, efficiently purging the
8. process with clean gas, and burning the organics in a patented catalytic Nitrogen
Purification Unit, the UOP Sinco SSP unit is able to effectively keep the process
clean.
The nitrogen purification process for SSP has been completely re-engineered by UOP
Sinco to meet the highest demands of high purity inert gas and reliability. In older
non-catalytic purification systems, organics accumulate on drying beds, eventually
degrading their performance, causing short cycling and undesirable water
concentrations in the return gas. UOP's development of the NPU-100TM proprietary
purification catalyst, as well as a second-generation stoichiometric oxygen control
package, ensures an efficient removal of organics at low oxygen concentrations. This
mode of operation prevents unburned hydrocarbons and excess oxygen from
recombining to form foulants that can deposit and require subsequent cleaning in
downstream equipment. Properly maintained, the Nitrogen Purification Unit (NPU)
can operate for many years before catalyst replacement is necessary. In-situ
regeneration is not required in this application. This modern, single-reactor, catalytic
oxidative gas purification unit was introduced and patented by UOP Sinco in 1995.
The NPU catalytic system is essential to ensure the highest quality of PET resin as
well as to avoid fouling in the nitrogen circuits that over time causes plant shutdowns.
In older SSP units, glycol scrubbers are used, with the glycol, contaminated with
oxygenates (dioxane, 2-methyldioxolane, and their degradation products), often being
recycled in the melt plant. This type of processing is not suitable for optimum melt
plant operation because of the contaminated glycol coming from the SSP glycol
scrubber. Also the claimed advantage of recovering the glycol in the melt plant is
largely offset by the high operating cost and shut-downs required for cleaning of the
glycol scrubbers as compared to the catalytic NPU.
Preventative maintenance of key equipment
Fundamental to any modern plant operation is a preventative maintenance program.
The SSP plant employs large, high speed rotating equipment such as blowers. The
blowers require a regular program of lubrication, temperature, and vibration
monitoring. In the older technologies of the 1970's and 80's, these machines were
often specified as simply general-purpose fans, when in actual fact for the 300 T/d+
SSP units they are large, critical service process blowers. They must be properly
located with attention to vibration, bearing life, heat dissipation and the lubrication
system. Field dynamic balancing is the norm, and some operations also perform the
same on-line monitoring as would normally be done for a large compressor.
Material conveying systems are one of the most critical areas to the melt and SSP
process reliability. The scientific principles of hydraulic and mechanical design of the
dense-phase, slow motion conveying system have been highly refined over the past 15
years. As a result, reliable systems are now widely available to the PET industry.
Maintenance should include all areas of sealing, rotary valves and critical flow
nozzles. In the modern PET plant it is very uncommon to build several hours of surge
volume to handle the outage of feed or product conveyor. The outage of rotary
feeders must be managed by spares and on-line replacement.
The elements of a successful reliability program have been outlined in a number of
excellent references (6,7). “Preventative maintenance” should not be interpreted as
9. solely a mechanical program. It should include monitoring process indicators for
signs of trouble. A simple example is the Nitrogen Purification Unit of the SSP unit.
UOP Sinco has encouraged several customers to install equipment to trend and
monitor the cyclic water collection from regeneration of the molecular sieve dryer
beds. This can aid in early detection of mechanical trouble or sudden changes in water
content of the feed, potentially indicating a problem in the dryer.
Variations in Product Quality/Waste
With the modern, high-capacity SSP units, the financial consequences of producing
un-saleable product are enormous. Product off-takers have very high sensitivity to
product quality parameters, and for good reason. For example, a product with high IV
variation may cause change in the strain hardening point and thereby affect the
material distribution in the blown bottle, as well as the sidewall crystallinity and other
important properties. The increased speed of packaging lines, especially in the
blowing area, makes this more crucial. There is often post-SSP variability (changes
during drying in non-plug flow hoppers and IV loss in the molding cycle) which can
be higher than the level imposed on the resin manufacturer. Nevertheless, the final
resin product specifications must be met. Several areas require attention to ensure
success:
• Instituting a rational quality management process
• Understanding sources of variability in the PET plant
• Achieving consistent chemical composition in the melt plant
• Achieving consistent IV to solid stating
• Accurate and reproducible lab methods for COOH and IV
Some of these items will be discussed in more detail as follows:
A rational quality management process
There are numerous programs available for quality management (Total Quality
Management, Six Sigma, Design for Six Sigma, etc.), and it is important to make note
of some practical guidelines. A statistics-based quality management system for the
Melt and SSP plants to control all key variables and thereby minimize product
variability is practically universal for PET producers selling into the major markets.
Working with a quality certification firm to obtain ISO 9000 certification requires the
operations area to:
• Understand the quality policies of the off-taking customers
• Define its product quality policies and objectives
• Control the processes
• Measure performance
These methods will track key process input and output variables, provide control
charts, perform statistical analyses, and are easily used to ensure customer
expectations on product quality are consistently met.
Over many years of assisting customers, UOP Sinco has found that the best operating
practice is to control the amorphous PET feed recipe and base IV, minimizing the
variability of feed rate, temperature and levels in the SSP plant. At first glance this
10. may seem obvious, but the major point is that "feedback" control by continuously
adjusting SSP process conditions from the product final IV is generally not desirable
and leads to higher variability. Likewise, it is not desirable to make shifts in the base
resin IV. Instead, it is best to produce a base resin recipe to specifications and then
move between two or more product IV specifications (for example, 0.72-0.74 mineral
water grade and 0.82-0.84 carbonated soft drink (CSD) grade with SSP conditions in
a controlled way. This is by far the most common procedure.
Sources of variability in the PET plant.
Carboxyl end groups are perhaps the most influential of all process variables in
affecting product IV variability. In the Melt Plant, molecular weight can be built
either by direct esterification of the end groups, or by condensation. Esterification is
self-catalyzed, is initially very rapid, and quickly moves toward equilibrium. The
carboxylic end groups are controlled in the Melt Plant primarily by the esterifier
conversion through residence time and temperature. If the conversion is unsteady,
there can be significant variability in the feed COOH to the SSP unit. This COOH
variability can have a pronounced effect on the reactivity in the SSP, leading to
unacceptable variation in the final product IV. Not only is COOH important to
reactivity, it is also understood to influence the stickiness of the polymer granules in
the SSP reactor. (8).
Secondary sources of variability can be the level of antimony in the melt plant and the
particle size, both of which can affect reaction rate in the SSP unit. In the SSP, the
reaction rate (expressed as the rate of end groups disappearance, g-mol equiv/T/hr) is
orders of magnitude slower than in the melt phase, and the crystallinity of PET can
render a portion of the end groups unavailable for reaction. In this case, the lack of R-
OH end groups to react can become more acute at higher molecular weight, leading to
a drastic reduction in reactivity and an upper limit to building IV.
Effect of initial IV on ultimate product
This discussion is confined to the SSP of conventional PET resin, defined as
copolymer having IV greater than 0.5 (normal industrial practice). The effect of
starting IV on reactivity in the solid state reaction is based on the concentration of end
groups, and can be determined in batch SSP experiments. This relationship is
described in the literature (9,10).
Regardless of the particle size and carboxyl content of the feedstock, there exists an
ultimate (or limiting) IV for each feed IV at each SSP temperature. Once this ultimate
IV is reached, the PET effectively ceases to build molecular weight. This ultimate IV
increases with feed IV and SSP temperature. Also the SSP rate, or reactivity within
the same IV range, is not equal for feeds with different IV values. The lower the feed
IV,; the higher the SSP reaction rate.
As a result, the Melt Plant finisher exit IV can be used for optimizing overall plant
capacity (2). While the break-point may be somewhat technology and recipe-specific,
UOP Sinco has determined that a working range of 0.55-0.6 is of greatest benefit and
flexibility. Below an IV of 0.55 there is need for manipulation of the recipe
(increased co-monomer) and SSP conditions to avoid over-crystallization. That being
11. said, it is very important that the feed IV into SSP be controlled as tightly as possible.
If the feed IV is varying by more than this amount, most times the cause can be traced
to how well the vacuum system is working on the Melt Plant finishing reactor.
The trend in the largest world-class lines is converging toward a single chip
composition recipe and IV leaving the melt plant. Rarely is it optimal to make grade
changes with simultaneous variations in base resin properties and SSP conditions.
Making product grade changes—hitting the target.
In the UOP Sinco SSP process, shown in Figure 4, the reactor is simply a silo in
which clean inert gas moves upward and chips downward. Since chips are fed on
mass flow control and the holdup is regulated in level control, in principle the process
should be easy to control and robust toward moving between recipe and product IV
grade changes. There are, however some practical considerations which must be
taken into account to limit variability:
• There must be conditions of optimal mass flow in the silo
• There must be minimal radial temperature gradient
• Conditions of free flow-ability must be maintained
Figure 4.
UOP Sinco SSP Process Flow Diagram
A..frequently-asked question relating to process control is: “What is the effect of
dispersion in the cone on the variability of the upgraded product IV.” If the flow
pattern is established and stable, there will only be a slight broadening of the
12. residence time distribution. The IV gradient, between outside and center, within a
single chip (1) is likely greater than the small variation in IV that could be introduced
by a modest broadening of residence time distribution in the process. UOP Sinco
experience has been that by using a simple but effective cone and gas injection
design, together with a proprietary exit design at the base of the cone, the conditions
of mass flow can be maintained and IV variation due to flow disturbances is zero even
under severe SSP conditions.
A scenario of what could potentially cause product control problems is provided in
Figure 5, adapted from reference 12. The tail of the residence time distribution in the
poor operation is caused by regions of very slow flow or practically "dead spots". An
example known to material handling specialists is that of changing products through a
line in which there might be a short hopper (like a surge silo) with a relatively shallow
cone angle. The shear forces are too weak at the transition of the straight side to the
cone. This, in combination with the shallow cone, means that some of the older
material may accumulate and then come out in an unpredictable way, hours or even
days later!
Figure 5
Dispersion in Cone Without Mass Flow
(adapted from ref.12)
Non-flowing
regions
1
1
0.9
0.9
0.8
0.8
0.7 Vr Vr
0.7
Fraction of tracer added
Fraction of tracer added
0.6 0.6
0.5
Vc 0.5 Vc
0.4 0.4
0.3 0.3
Vr Vr
0.2 0.2
0.1
Vc 0.1 Vc
0 0
0 10 20 30 40 50 60 70 80 90 0 10 20 30 40 50 60 70 80 90
Volume of solid discharged Volume of solid discharged
Dynamic simulation as a practical tool for grade changes.
Execution of the SSP plant startup, shutdown and grade change with the UOP Sinco
Dynamic Simulation planning tool can be made quite easily. Figure 6 shows a typical
simulation for a commercial plant where SSP reactor temperature and residence time
are changed simultaneously to make an IV change. Moving from high to low IV or
back from low to high IV by step-changing temperature in the UOP Sinco process is
13. almost immediate and involves negligible interface material. Also the amount of
transition material would be the same changing from one amorphous resin
formulation to another.
Figure 6
Simulator Example of Controlling a Grade Change
Feed/Product rate
42000
40000
38000
36000
34000
32000
Rate (kg/hr)
30000
28000
26000
24000
22000
20000
18000
Product IV 0.82→0.76 change
16000
14000
12000
0 10 20 30 40 50 60
with minimal “interface” out of
Feed rate vs. time
Time(h)
Product rate vs. time
control limits
0.9
Temperature 0.85
Feed chip temperature vs. time
230
0.8
Product IV (dl/g))
225
220
Temperature (C)
215
210
0.75
205
200
0.7
195
190
0 10 20 30 40 50 60
Time(h) 0.65
Feed chip temperature vs. time
0.6
0 10 20 30 40 50 60
Reactor level Time(h)
100
Product IV vs. time
Level of Reactor (%)
80
60
40
20
0
0 10 20 30 40 50 60
Time(h)
Level of reactor vs. time
Another example of the possible application of the UOP Sinco planning tool is a
change in capacity while maintaining constant IV. In principle, the feed rate can be
stepped down directly to the lower rate while drawing off product at a constant rate to
ramp down the reactor level to a new standard set of conditions. This would be
accompanied by stepping the temperature to the new specifications. If this is all done
at once, the “unmanaged” change to the new standard conditions results in about 10
hours production of off-class product material, shown in Figure 7. But if
compensated by programming a temperature ramp slightly ahead of the level change,
the IV stays within the control limits (Figure 8). It is even possible using such
production planning to organize a standard transition procedure which is built into the
DCS using UOP Sinco's SSP mass flow control and process temperature control
packages.
Software-based tracking and scheduling of products through large and complex
material movement systems has been routine for many years. Management of SSP
plants by such a predictive technique is a practice we expect to become more
common. This is the most effective way to quickly respond to customer requirements
with product campaigns without large storage volumes or waste.
14. Figure 7
Example of an Unmanaged Grade Change
Feed/Prod. rate stepped to new target
24000
22000
20000
18000
16000
Nearly 1 reactor volume
Rate (kg/hr)
14000
12000
10000
8000
6000
4000
2000
outside IV specification!
0
0 10 20 30 40 50 60 1
Time(h)
Feed rate vs. time Product rate vs. time
0.95
Temp. stepped to new target 0.9
Product IV (dl/g))
Feed chip temperature vs. time
0.85
230
225
220 0.8
Temperature (C)
215
210
205 0.75
200
195
190
0.7
0 10 20 30 40 50 60 0 10 20 30 40 50 60
Time(h)
Time(h)
Feed chip temperature vs. time
Product IV vs. time
Reactor level
100
Level of Reactor (%)
80
60
40
20
0
0 10 20 30 40 50 60
Time(h)
Level of reactor vs. time
Figure 8
Programming a Major Capacity Change
Feed/Product Rate input to rotary valves speed
24000
22000
20000
18000
16000 Product IV stays within
Rate (kg/hr)
14000
12000
10000
8000
6000
specification limits
4000 1
2000
0
0 10 20 30 40 50 60
Time(h) 0.95
Feed rate vs. time Product rate vs. time
0.9
Product IV (dl/g))
Temperature ramped ahead 0.85
Feed chip temperature vs. time
230
225
0.8
220
Temperature (C)
215
0.75
210
205
200
0.7
195
0 10 20 30 40 50 60
190
Time(h)
0 10 20 30 40 50 60
Time(h)
Feed chip temperature vs. time Product IV vs. time
100
Reactor level
80
Indicated level (%)
60
40
20
0
0 10 20 30 40 50 60
Time(h)
Level of reactor vs. time
15. A Look Ahead – Will Future Technology Trends Lower the
Production Cost for PET?
The focus of this paper has centered on practical suggestions for maximizing the
profitability of high quality PET using the current process technology. However, as
the market continues to develop, it is fair to ask the question: “Could some future
trend drastically lower the cost of production for PET?”
Technology developments.
As seen earlier, raw material costs are greater than three quarters of PET NCOP.
Therefore, this aspect of technology development has the highest potential payout.
Unfortunately, no single, industry-changing development seems likely in the near
term, but progress is being made in the area of up-stream technologies such as UOP’s
Parex™ and MX Sorbex™ technologies for p-X and m-X production, as well as in
oxidation technologies for PTA. Table 3 lists some of the areas of effort.
Table 3
Longer Term Technology Development for PET Raw Materials
Development Status
Direct route to p-xylene from non Research
aromatic feedstock
Simplified, lower cost TA production Research
(oxidation) technology
Simplified purification of TA Development & moving towards
commercialization
Direct production and sale of bis-HET Research (13)
(ethylene oxide / TA reaction)
Economical recovery of raw materials Development & commercialization of
from recycle PET economically viable processes
An alternate production technology to radically lower the cost of production seems
some time off. However, the large and complex purification scheme originally
developed to serve the requirements of the fibers industry has undergone great
simplification and cost-cutting while still meeting product requirements (14). Recent
announcements (15) point to the potential of integrating up-stream process technology
to lower the capital cost per ton of PET. However, this application may be very site
and technology specific.
The near-medium term path forward. Beyond the developments tabulated above,
it is interesting to consider additional developments that may ultimately impact
profitability of the PET industry. There appear to be two major technical areas that are
receiving the greatest focus -- larger plants (1200-1500 T/d class) and the close
integration of the melt plant with SSP to lower capital and utilities costs.
The move toward large, world-class plants has already been noted in this paper. For
close integration and synergy of Melt Plant and SSP, the paradigm for the industry
has long been the simple conversion. In this case a PET plant having direct melt-
16. spinning of homo-polymer fiber adds a co-monomer system and granulation, with
storage and movement of these chips to SSP. Now, with the larger plant capacities,
there is incentive to break out of this model toward the objective of closely integrating
the Melt Plant and SSP, as a means of lowering operating cost and improving product
quality.
A step-out approach must consider several realities. The technology improvements
defined below can impact the energy and process equipment costs in various ways:
Direct production of high IV polyester in melt phase without SSP.
This is currently practiced for industrial fibers through special finisher design, and is
in development for bottle resin. For bottle resin this has not yet been commercialized.
The significant issue is that the extended handling of the melt with the present
antimony-based catalysts leads to degradation reactions, producing higher than
desirable acetaldehyde and color bodies. In order to bring the acetaldehyde content to
values tolerable for packaging application, extensive use of chemical additives is
required. Widespread commercialization seems doubtful in the near future.
Production of lower molecular weight granule followed by SSP.
Invista NG3™ PET resin technology (direct production of pastille shaped chips at <
0.3 initial IV suitable for SSP) is the prime example (16). This technology has been
commercialized in 2004 and is beginning to gain operational experience. UOP Sinco
is the exclusive SSP technology provider for Invista NG3 PET resin technology.
Alternate granulation and crystallization techniques.
This is an interesting recent development. From the beginning, commercial PET
container resin has almost universally been a 12-25 mg square-cylindrical chip made
by a low-temperature, strand-type water bath granulator and thereafter cooled to near
ambient temperature. More recently, the use of underwater pelletizers (of the die-face
type) to produce uniform beads has been gaining experience on PET. This type of
unit has long been standard in the polyolefin industries.
It has been suggested in recent literature (17, 18) to crystallize PET after the
granulation step. Alternate crystallization/granulation techniques are beginning to be
offered to the industry by manufacturers of strand pelletizers or underwater melt
cutters. UOP Sinco has already gained large scale solid stating experience on this
type of material. We expect these systems to become more important as operating
experience and reliability is established.
CONCLUSIONS
The PET industry is entering the era of 1000+ T/d PET lines with correspondingly
larger SSP plants. To meet this challenge, UOP Sinco has developed and further
refined the solid stating process and successfully applied these developments to the
largest capacity plants that now operate in the world. The modern SSP technology
offers lower cost of production, higher reliability, and longer run lengths.
There are profitability factors within operations control which, when well-managed,
can minimize cost of production. Minimization of waste through process management
and techniques for minimizing down-time are well understood, but frequently
overlooked.
17. The technology for PET production will continue to improve to lower cost of
production. Although in the raw materials area, no single, industry-changing
development is likely in the near term, some progress is being made. The greatest
interest for the future PET melt/SSP plant will likely be directed toward even larger
plant sizes and better integration of the overall melt/SSP process.
18. REFERENCES
1. Thiele, Ulrich, “Structural Change in the Polyester Industry” Chem. Fibers Int.
Man-Made Fiber Year Book 2000, p.4
2. McGehee, J. F. "Flexible Low-Cost SSP Technology" Polyester 2000 5th World
Congress, Zurich, 29 Nov. 2000.
3. Peebles, L. H., Huffman, M. W. and Ablett, C. T. "Isolation and Identification of
the Linear and Cyclic Oligomers of Poly(ethylene Terephthalate) and the Mechanism
of Cyclic Oligomer Formation. J. Polymer Science A 7 (1969) 479-496
4. Zahn, H. and Gleitsman, G. B. "Oligomers and Pleionomers of Synthetic Fiber-
Forming Polymers" Angew. Chem. Internat. Edition v2 n 8 (1963) 410-420
5. Youk, J. H., Kambour, R. and MacKnight, W. J. "Polymerization of Ethylene
Terephthalate Cyclic Oligomers with Antimony Trioxide". Macromolecules 33
(2000) 3594-3599.
6. Patton, J. D. Preventive Maintenance, 3 ed. Raleigh, NC: Instrumentation
Society of America 2004
7. Levitt, J. Complete Guide to Preventive and Predictive Maintenance. New York:
Industrial Press, 2003
8. Holland, B. J., Hay, J. N. "Analysis of Comonomer Content and Cyclic Oligomers
of Poly(Ethylene Terephthalate)" Polymer, 43 (2002) 1797-1804
9. Duh, B. “Effects of the Carboxyl Concentration on the Solid State Polymerization
of Poly(Ethylene Terephthalate)”
10. Duh, B. "Semiempirical Rate Equation for Solid State Polymerization of
Poly(Ethylene Terephthalate) J. Appl. Polymer Sci. 84, 857-870 (2002)
11. Scheir, J., Long, T. E. (eds.) Modern Polyesters: Chemistry and Technology of
Polyesters and Copolyesters, Wiley 2003
12. Johanson, J. R. "Solids Material Handling: In Bin Blending" Chem. Engr.
Progress., 66, 6 (1970) 50-55
13. Jabarin, S.A., unpublished notes for course, “PET Technology: Properties and
Processing” 1999
14. “Finding the X-factor” Frontiers: The BP Magazine of Technology and
Innovation” 8 (Dec, 2003)
15. Whitehead, J., “Eastman Announces Major PET Investment”, Plastics & Rubber
Weekly, (October, 2004)
16. McGehee, J. F., Witt, A. R. "Future Directions in Solid State Polymerization of
Polyethylene Terephthalate" AIChE Spring Meeting, March 2003, New Orleans,
Louisiana, USA