Weitere ähnliche Inhalte Ähnlich wie Daily livestock report feb 08 2013 Ähnlich wie Daily livestock report feb 08 2013 (20) Mehr von joseleorcasita (20) 1. Sponsored by
Vol. 11, No. 28 / February 8, 2013
The first Seasonal Trader Reports is now posted on the ANALYSTS' ESTIMATES
Daily Livestock Report website (www.dailylivestockreport.com).
Supporters — those who have contributed $149 or more — can access 2013 US YEAR-END STOCKS
the President’s Day report by clicking on Quarterly Report on the menu February 8, 2013 Crop Production/WASDE Reports
bar at the top of the home page. Click here to get Adobe Acrobat Analysts' Estimates, February*
2012 USDA
with which you can read the Report. A guide to using the report from Low High Average
our January 22 edition is reprinted on page 3. USDA January
If you weren’t very satisfied with the chart regarding the (Billion Bushels)
sources of U.S. slaughter cattle that we included in yesterday’s Corn 0.988 0.602 0.502 0.697 0.616
DLR, join the club. Neither were we. We encountered a printing prob- Soybeans 0.169 0.135 0.103 0.140 0.130
lem on the way to the Adobe Acrobat version that we didn’t have time to Wheat 0.743 0.716 0.512 0.783 0.717
solve. But we got it done thanks to Altin Kalo of Steiner’s and the chart *Source: Bloomberg
we intended to include appears on page 2. We’re pretty confident that
you’ll find it far more illuminating than that pile of lines at the bottom of ANALYSTS' ESTIMATES
yesterday’s version. The areas in this chart are cumulative so they
show the contribution of each source of animals to total steer and heifer
2013 SOUTH AMERICAN CROPS
slaughter. February 8, 2013 WASDE Report
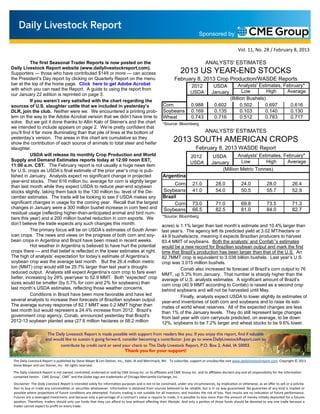
USDA will release its monthly Crop Production and World 2012 USDA Analysts' Estimates, February*
Supply and Demand Estimates reports today at 12:00 noon EST, Low High Average
USDA January
11:00 a.m. CST. The February report is not usually a huge news item
for U.S. crops as USDA’s final estimate of the prior year’s crop is pub- (Million Metric Tonnes)
lished in January. Analysts expect no significant change in projected Argentina
year-end stocks. Their 616 million bu. average for corn is slightly larger
Corn 21.0 28.0 24.0 28.0 26.4
than last month while they expect USDA to reduce year-end soybean
stocks slightly, taking them back to the 130 million bu. level of the De- Soybeans 41.0 54.0 50.5 55.7 52.9
cember estimates. The trade will be looking to see if USDA makes any Brazil
significant changes in usage for the coming year. Recall that the largest Corn 73.0 71.0 69.8 73.5 71.3
changes in January were a 300 million bushel increase in corn feed and Soybeans 66.5 82.5 81.0 84.0 82.7
residual usage (reflecting higher-than-anticipated animal and bird num-
bers this year) and a 200 million bushel reduction in corn exports. We *Source: Bloomberg
don’t believe the trade expects any such changes this month. acres) is 1.1% larger than last month’s estimate and 10.4% larger than
The primary focus will be on USDA’s estimates of South Amer- last year’s. The agency left its predicted yield at 3.02 MT/hectare or
ican crops. The news and views on the progress of both corn and soy- 44.9 bushels/acre, meaning it expects Brazilian producers to harvest
bean crops in Argentina and Brazil have been mixed in recent weeks. 83.4 MMT of soybeans. Both the analysts’ and Confab’’s estimates
Hot weather in Argentina is believed to have hurt the potential would be a new record for Brazilian soybean output and mark the first
crops there — and that belief is reflected in the lower estimates at right. time that Brazil’s production has been larger than that of the U.S. An
The high of analysts’ expectation for today’s estimate of Argentina’s 82.7MMT crop is equivalent to 3.038 billion bushels. Last year’s U.S.
soybean crop was the average last month. But the 26.4 million metric crop was 3.015 million bushels.
ton (MMT) crop would still be 25.7% larger than last year’s drought- Conab also increased its forecast of Brazil’s corn output to 76
reduced output. Analysts still expect Argentina’s corn crop to fare even MMT, up 5.3% from January. That number is sharply higher than the
better, increasing by 29% year/year to 52.9 MMT. Both “expected” crop average of U.S. analysts estimates. A significant amount of Brazil’s
sizes would be smaller (by 5.7% for corn and 2% for soybeans) than corn crop (40.9 MMT according to Confab) is raised as a second crop
last month’s USDA estimates, reflecting those weather concerns. behind soybeans and will not be harvested until May.
Conditions in Brazil have been more favorable and have led Finally, analysts expect USDA to lower slightly its estimates of
several analysts to increase their forecasts of Brazilian soybean output. year-end inventories of both corn and soybeans and to raise its esti-
The average survey response of 82.7 MMT was 0.2 MMT higher than mates of world wheat reserves. All of the expected changes are less
last month but would represent a 24.4% increase from 2012. Brazil’s than 1% of the January levels. They do still represent large changes
government crop agency, Conab, announced yesterday that Brazil’s from last year with corn carryouts predicted, on average, to be down
2012-13 soybean planted area (27.6 million hectares or 68.2 million 12%, soybeans to be 7.2% larger and wheat stocks to be 9.6% lower.
The Daily Livestock Report is made possible with support from readers like you. If you enjoy this report, find if valuable
and would like to sustain it going forward, consider becoming a contributor. Just go to www.DailyLivestockReport.com to
contribute by credit card or send your check to The Daily Livestock Report, P.O. Box 2, Adel, IA 50003.
Thank you for your support!
The Daily Livestock Report is published by Steve Meyer & Len Steiner, Inc., Adel, IA and Merrimack, NH. To subscribe, support or unsubscribe visit www.dailylivestockreport.com. Copyright © 2013
Steve Meyer and Len Steiner, Inc. All rights reserved.
The Daily Livestock Report is not owned, controlled, endorsed or sold by CME Group Inc. or its affiliates and CME Group Inc. and its affiliates disclaim any and all responsibility for the informa on
contained herein. CME Group®, CME® and the Globe logo are trademarks of Chicago Mercan le Exchange, Inc.
Disclaimer: The Daily Livestock Report is intended solely for informa on purposes and is not to be construed, under any circumstances, by implica on or otherwise, as an offer to sell or a solicita-
on to buy or trade any commodi es or securi es whatsoever. Informa on is obtained from sources believed to be reliable, but is in no way guaranteed. No guarantee of any kind is implied or
possible where projec ons of future condi ons are a empted. Futures trading is not suitable for all investors, and involves the risk of loss. Past results are no indica on of future performance.
Futures are a leveraged investment, and because only a percentage of a contract’s value is require to trade, it is possible to lose more than the amount of money ini ally deposited for a futures
posi on. Therefore, traders should only use funds that they can afford to lose without affec ng their lifestyle. And only a por on of those funds should be devoted to any one trade because a
trader cannot expect to profit on every trade.
2. Sponsored by
Vol. 11, No. 28 / February 8, 2013
MONTHLY U.S. STR/HFR SLAUGHTER BY
SOURCE, U.S. INVENTORY & CALF CROP
Canada Feeders Canada Fed Cattle Mexico Feeders
U.S. Calves U.S. Jan 1 Cattle Inv. U.S. Calf Crop
Slaughter -- Inventory & Calf
Thousand Hd. Crop, Mil. Hd.
1800 120
1500 100
1200 80
900 60
600 40
300 20
0 0
90 91 92 93 94 95 96 97 98 99 00 01 02 03 04 05 06 07 08 09 10 11 12
3. Sponsored by
Vol. 11, No. 28 / February 8, 2013
How to Use DLR Seasonal Trader Reports Expected 4/26 Price = 1/18 Price x 4/16 factor/1/18 factor
The Seasonal Trader Reports are a set of four reports con- The expected price based on the 7-year seasonal pattern is:
taining daily price histories of over 60 agricultural futures and Expected 4/26 Price = $126.25 * 0.9811 / 1.0089
spreads. This resource will be posted quarterly to the Daily Livestock = $122.77
Report website in .pdf (Adobe) format. Based on the 15-year seasonal pattern, the expected prices is:
Each book will contain information for 100 work days cen- Expected 4/26 Price = $126.25 * 0.9971 / 1.0016
tered on four US holidays that are always on the same day of the
= $125.68
week. They are Presidents Day, Memorial Day, Labor Day, and
Thanksgiving Day. The seasonal price pattern can also be observed in the chart
on page 7. The seasonal factor lines indicate that prices on April 26
The set will include daily prices going back either 15 years
(the last observation in the chart) are significantly lower than those on
or, if the contract has existed for less than 15 years, as far back in
the 15th trading day of January. The charts can thus be used find
time as available history allows. It will also include daily price factors
periods during which futures prices have changed dramatically and
for both 7 and 15 year periods and an easy to read chart featuring
have thus historically offered profits on seasonal trades.
both seasonal factors for each contract and spread.
All of the charts in a given quarterly book will be placed on
An example of the Seasonal Trader Resource Book — this
the same scale so the degree of price change can be compared
one for June Live Cattle — appears on pages 4 through 7. across commodity and across contract or spread. The example here
Note that this seasonal factor set is anchored on President’s has a range of 0.92 to 1.08. That may or may not be the scale for a
Day which falls this year on February 18. That date is on page 2 of given book but the scale will be the same throughout each respective
the table and is day 51 of the 100 days of data. Day 1 represents quarterly book.
December 10, 2012 or the equivalent date relative to President’s Day
in past years. Day 100 represents Friday, April 26. The Seasonal Trader Report contains a number of im-
portant explanations and warnings and readers are urged to read
The reason that we use holidays that fall on set days of the all of them carefully. The following one is particularly important:
week is, we think, obvious by observing what happens to the other
“The graphs tell you what the average percentage price
holidays included in this June Live Cattle President’s Day set. Christ-
change has been and the direction. However, by themselves
mas and New Year’s Day move steadily around, influenced by the
the charts do not tell you how reliable the tendency has been.
year’s 365th day and leap year. Martin Luther King Day switches
It is very possible for the seasonal tendency to be up because
weeks — relative to President’s Day — in some years. And Easter,
the data is dominated by one year. So it is possible for prices
since it is based on the spring equinox and moon phases, is all over
to move lower six out of seven years and still have an upward
the calendar. The same relationship of other holidays will be ob- trending line on the graph because the one year that prices
served in the data based on Memorial Day, Labor Day and Thanks- moved up, they did it with enough of a magnitude to more
giving. than compensate for the other six years.
The right-most columns contain seasonal factors for the So, the charts may suggest direction but they do not represent the vari-
most recent 7 years and the entire 15 years of data. They represent ability of that direction. Only the data tables will provide that infor-
the relationship of that day’s historical price to the average price for mation.
the period. The 7-year factor column tells us that the average price of
June Live Cattle futures over 2006-2012 on day 1 of the period was
97.71% (.9771) of the average price for the 100-day period centered
on President’s Day. The average price on Day 51 was 101.49% of
the average for the period.
Ratios of these factors can be used to compute expected
prices based on the historical seasonal pattern. For instance. Friday,
January 18 would be Day 30 in the table. The seasonal factors for
Day 30 are 1.0089 for the past 7 years and 1.0016 for the past 15
years. Friday’s closing price for June Live Cattle was $126.25. If one
is interested in what the June Live Cattle price might be on April 26,
Day 100, one would use the factors for that day (0.9811 and 0.9971)
and those for January 18 along with the closing June Live Cattle fu-
tures price on January 18 to compute it as:
4. 2013 Seasonal Trader Report: President's Day Base
JUNE LIVE CATTLE - SEVEN & FIFTEEN YEAR AVERAGE SEASONAL FACTORS FOR A PRESIDENT'S DAY BASE
1998 1999 2000 2001 2002 2003 2004 2005 2006 2007 2008 2009 2010 2011 2012 2013 SEASONAL SEASONAL
JUNE JUNE JUNE JUNE JUNE JUNE JUNE JUNE JUNE JUNE JUNE JUNE JUNE JUNE JUNE JUNE FACTOR 7 YR FACTOR 15 YR
Line (2006-2012) (1998-2012)
No. (LCM) (LCM) (LCM) (LCM) (LCM) (LCM) (LCM) (LCM) (LCM) (LCM) (LCM) (LCM) (LCM) (LCM) (LCM) (LCM) Year Month Date Day of Week Holiday BASE BASE
1 71.10 62.95 68.52 73.70 67.87 71.72 75.55 80.60 86.60 87.32 94.25 81.17 83.90 105.52 120.10 12 DEC 10 MON 0.9771 0.9868
2 70.05 62.37 68.62 74.20 74.62 72.05 74.62 80.00 86.90 86.82 94.10 80.47 83.60 104.87 121.50 12 DEC 11 TUE 0.9758 0.9902
3 69.80 61.85 68.80 74.35 74.55 71.85 74.55 80.92 87.05 87.12 93.80 81.72 83.22 104.67 120.67 12 DEC 12 WED 0.9764 0.9904
4 69.65 61.30 68.90 74.02 75.15 71.25 75.15 80.82 86.50 86.87 93.22 82.35 83.50 105.02 120.70 12 DEC 13 THUR 0.9761 0.9898
5 68.60 61.05 68.87 74.27 75.00 71.15 75.00 81.75 86.55 87.70 93.65 81.75 84.27 105.95 120.37 12 DEC 14 FRI 0.9792 0.9905
6 68.27 61.75 68.97 74.70 75.57 71.67 75.57 81.87 86.50 88.37 93.95 82.77 84.70 106.67 121.25 12 DEC 17 MON 0.9849 0.9957
7 68.47 60.60 69.05 74.22 74.70 71.52 74.70 82.65 86.67 87.72 94.45 85.55 85.32 107.12 122.22 12 DEC 18 TUE 0.9924 0.9968
8 69.02 61.67 68.90 74.30 75.20 71.30 75.20 82.32 86.40 88.42 94.45 85.80 85.47 108.27 122.55 12 DEC 19 WED 0.9955 1.0002
9 68.62 61.85 69.17 73.67 74.65 71.80 74.65 82.15 86.25 88.10 94.22 84.95 85.47 108.57 123.40 12 DEC 20 THUR 0.9943 0.9985
10 68.35 61.65 HOLIDAY 74.02 74.92 72.10 74.92 HOLIDAY 86.25 87.77 94.37 85.57 85.67 HOLIDAY 124.90 12 DEC 21 FRI 0.9972 1.0004
11 67.92 61.45 69.12 HOLIDAY 75.32 72.05 75.32 82.22 HOLIDAY HOLIDAY 93.45 85.02 85.90 108.87 HOLIDAY 12 DEC 24 MON 0.9956 0.9997
12 68.07 62.15 69.20 73.77 75.47 72.05 75.47 82.05 86.30 88.22 HOLIDAY 85.47 85.45 108.95 125.10 HOLIDAY 12 DEC 25 TUE Christmas 0.9967 1.0011
13 68.15 62.72 69.22 74.27 73.97 HOLIDAY 73.97 80.82 86.25 89.72 93.87 86.47 86.30 109.32 125.87 12 DEC 26 WED 1.0040 1.0020
14 HOLIDAY 63.02 69.77 74.50 HOLIDAY 72.05 HOLIDAY 80.62 86.45 89.75 94.72 HOLIDAY 85.82 108.35 125.35 12 DEC 27 THUR 1.0031 1.0025
15 68.55 HOLIDAY HOLIDAY 74.82 70.97 71.95 70.97 80.62 86.75 89.30 94.77 84.92 HOLIDAY HOLIDAY 124.50 12 DEC 28 FRI 0.9994 0.9958
16 68.47 63.52 69.65 HOLIDAY 69.92 71.87 69.92 HOLIDAY HOLIDAY HOLIDAY 95.02 85.90 86.50 108.47 HOLIDAY 12 DEC 31 MON 1.0027 0.9957
17 68.17 63.02 69.47 74.95 68.97 72.52 68.97 81.60 87.00 89.30 HOLIDAY 85.97 86.45 108.12 124.75 HOLIDAY 13 JAN 1 TUE New Years 1.0030 0.9947
18 68.27 62.92 69.40 74.62 68.82 HOLIDAY 68.82 81.35 86.85 89.60 95.22 86.20 86.62 108.25 124.65 13 JAN 2 WED 1.0043 0.9944
19 HOLIDAY 63.00 69.90 74.35 HOLIDAY 72.87 HOLIDAY 80.62 87.15 88.85 94.07 HOLIDAY 87.72 108.60 124.45 13 JAN 3 THUR 1.0038 0.9942
20 67.02 HOLIDAY 70.42 74.05 69.20 72.95 69.20 81.55 86.80 88.92 94.05 88.00 HOLIDAY 108.40 123.95 13 JAN 4 FRI 1.0055 0.9955
21 66.90 62.55 70.57 73.75 70.70 72.37 70.70 82.30 87.05 89.20 94.62 87.92 87.25 109.27 123.85 13 JAN 7 MON 1.0074 0.9985
22 67.37 63.75 70.55 74.30 70.35 72.15 70.35 83.60 87.60 88.87 94.42 88.20 87.80 110.70 124.80 13 JAN 8 TUE 1.0118 1.0029
23 67.10 64.72 70.17 74.55 71.85 71.82 71.85 83.47 85.85 89.80 93.95 86.45 87.65 112.37 124.40 13 JAN 9 WED 1.0078 1.0040
24 67.05 63.97 70.25 74.55 72.00 71.92 72.00 83.35 86.40 89.77 94.32 85.37 88.02 112.52 124.05 13 JAN 10 THUR 1.0078 1.0035
25 67.07 64.40 70.40 74.35 72.15 71.77 72.15 83.37 86.65 89.80 94.10 85.70 88.02 112.30 124.17 13 JAN 11 FRI 1.0084 1.0044
26 67.27 64.67 HOLIDAY HOLIDAY 70.95 71.55 70.95 HOLIDAY HOLIDAY HOLIDAY 94.50 85.45 87.70 HOLIDAY HOLIDAY 13 JAN 14 MON 1.0081 1.0023
27 68.25 64.45 70.12 74.67 70.75 71.07 70.75 83.17 87.25 89.97 94.05 86.00 87.65 113.07 125.37 13 JAN 15 TUE 1.0119 1.0039
28 68.95 63.95 69.67 73.90 72.05 69.70 72.05 82.15 87.15 90.02 93.50 85.70 87.45 112.45 125.15 13 JAN 16 WED 1.0091 1.0019
29 68.60 64.47 69.57 73.52 71.50 70.37 71.50 82.25 87.05 89.85 93.45 85.70 87.92 112.67 125.65 13 JAN 17 THUR 1.0102 1.0018
30 69.02 65.00 69.52 73.07 71.45 70.42 71.45 82.15 86.40 89.07 93.27 86.20 87.92 112.62 126.05 13 JAN 18 FRI 1.0089 1.0016
31 HOLIDAY HOLIDAY 69.45 73.30 HOLIDAY HOLIDAY HOLIDAY 81.37 86.95 89.07 HOLIDAY HOLIDAY HOLIDAY 111.75 126.12 HOLIDAY 13 JAN 21 MON MLK 1.0088 1.0011
32 68.90 65.02 69.65 72.60 71.92 70.45 71.92 82.07 86.45 88.95 92.82 84.05 88.27 110.95 127.30 13 JAN 22 TUE 1.0043 0.9999
33 69.12 65.02 69.50 72.85 71.75 70.97 71.75 82.00 86.55 89.10 92.55 84.10 88.42 112.52 127.05 13 JAN 23 WED 1.0063 1.0012
34 69.12 64.87 69.07 72.52 71.42 70.77 71.42 82.30 86.45 89.42 93.07 84.17 88.22 112.45 126.50 13 JAN 24 THUR 1.0065 0.9999
35 69.70 64.87 69.42 72.55 70.65 70.35 70.65 82.37 85.35 89.70 93.00 84.17 88.30 113.37 126.60 13 JAN 25 FRI 1.0063 0.9990
36 69.52 65.17 69.90 72.02 70.67 70.57 70.67 82.62 84.80 89.47 92.57 83.82 88.20 114.55 126.25 13 JAN 28 MON 1.0046 0.9988
37 68.62 64.67 70.32 71.32 70.80 70.65 70.80 82.87 84.67 89.27 93.37 82.30 87.45 114.52 127.15 13 JAN 29 TUE 1.0026 0.9967
38 68.60 64.05 69.80 71.57 70.25 71.97 70.25 82.45 84.55 89.85 93.52 82.30 87.20 114.20 127.50 13 JAN 30 WED 1.0031 0.9959
39 69.15 64.22 70.05 72.67 69.90 72.02 69.90 82.75 83.75 89.65 93.52 82.02 87.57 114.02 127.97 13 JAN 31 THUR 1.0018 0.9969
40 68.65 64.20 69.97 72.25 70.60 72.17 70.60 82.42 83.90 90.95 93.95 82.45 87.82 113.62 126.75 13 FEB 1 FRI 1.0040 0.9981
© 2012 Steiner Consulting Group (1-800-526-4612)
5. 2013 Seasonal Trader Report: President's Day Base
JUNE LIVE CATTLE - SEVEN & FIFTEEN YEAR AVERAGE SEASONAL FACTORS FOR A PRESIDENT'S DAY BASE
1998 1999 2000 2001 2002 2003 2004 2005 2006 2007 2008 2009 2010 2011 2012 2013 SEASONAL SEASONAL
JUNE JUNE JUNE JUNE JUNE JUNE JUNE JUNE JUNE JUNE JUNE JUNE JUNE JUNE JUNE JUNE FACTOR 7 YR FACTOR 15 YR
Line (2006-2012) (1998-2012)
No. (LCM) (LCM) (LCM) (LCM) (LCM) (LCM) (LCM) (LCM) (LCM) (LCM) (LCM) (LCM) (LCM) (LCM) (LCM) (LCM) Year Month Date Day of Week Holiday BASE BASE
41 68.10 64.47 70.37 72.57 70.22 72.22 70.22 82.77 83.65 91.85 94.30 84.35 87.22 112.62 126.50 13 FEB 4 MON 1.0062 0.9992
42 67.82 64.47 69.85 72.80 69.92 71.77 69.92 82.97 83.82 92.27 94.52 83.75 87.77 111.95 127.00 13 FEB 5 TUE 1.0071 0.9982
43 67.62 65.40 69.62 72.45 68.42 71.47 68.42 82.72 84.02 92.32 93.87 83.67 88.05 112.27 127.25 13 FEB 6 WED 1.0075 0.9955
44 67.50 65.60 69.40 72.30 69.80 70.60 69.80 82.12 84.05 91.75 95.00 84.05 87.85 113.45 126.45 13 FEB 7 THUR 1.0093 0.9972
45 67.27 66.12 69.20 72.70 70.05 70.30 70.05 82.25 84.60 91.92 94.20 84.07 88.10 113.25 125.80 13 FEB 8 FRI 1.0087 0.9977
46 67.45 66.22 68.95 72.72 70.55 70.97 70.55 82.45 83.25 92.72 94.45 84.92 88.45 114.60 126.25 13 FEB 11 MON 1.0122 1.0011
47 67.72 65.62 68.65 72.65 69.52 71.27 69.52 82.52 83.32 93.50 94.35 85.40 88.90 114.40 127.10 13 FEB 12 TUE 1.0156 1.0005
48 67.85 65.65 68.72 72.57 70.15 69.77 70.15 82.75 83.12 93.22 93.77 85.17 89.12 115.10 127.10 13 FEB 13 WED 1.0148 1.0002
49 68.17 65.57 68.75 72.40 70.05 69.07 70.05 82.65 83.10 93.00 93.55 85.22 89.12 116.30 127.15 13 FEB 14 THUR 1.0157 0.9998
50 68.85 65.57 68.67 72.15 70.27 69.50 70.27 81.05 82.77 93.05 93.82 84.80 88.55 116.17 128.07 13 FEB 15 FRI 1.0149 0.9993
51 HOLIDAY HOLIDAY HOLIDAY HOLIDAY HOLIDAY HOLIDAY HOLIDAY HOLIDAY HOLIDAY HOLIDAY HOLIDAY HOLIDAY HOLIDAY HOLIDAY HOLIDAY HOLIDAY 13 FEB 18 MON Pres. Day 1.0149 0.9993
52 68.12 65.92 67.82 72.75 70.15 69.65 70.15 81.25 82.85 92.57 94.15 82.25 89.97 114.77 128.20 13 FEB 19 TUE 1.0111 0.9970
53 67.62 65.02 68.17 73.32 70.57 69.97 70.57 81.72 83.22 93.67 94.97 81.07 90.12 115.27 128.25 13 FEB 20 WED 1.0137 0.9990
54 66.97 65.07 68.50 73.52 70.10 70.45 70.10 81.95 82.50 93.95 94.62 82.52 90.90 115.02 127.70 13 FEB 21 THUR 1.0151 0.9994
55 66.82 65.30 68.62 73.20 70.02 70.85 70.02 81.90 82.00 94.15 94.40 81.55 90.87 115.85 127.70 13 FEB 22 FRI 1.0135 0.9988
56 66.05 64.80 68.75 73.55 70.37 71.32 70.37 82.35 81.90 95.85 95.02 81.85 90.95 114.65 126.65 13 FEB 25 MON 1.0148 1.0000
57 66.50 65.57 68.65 73.70 71.85 70.45 71.85 82.62 82.05 95.70 95.77 83.32 90.50 113.60 126.00 13 FEB 26 TUE 1.0157 1.0038
58 65.97 65.30 69.17 73.95 72.47 70.85 72.47 82.92 82.35 95.50 95.42 82.95 90.17 114.17 126.50 13 FEB 27 WED 1.0155 1.0054
59 66.67 66.12 69.25 73.72 72.87 69.62 72.87 84.35 81.70 94.37 95.37 83.75 90.30 115.15 127.12 13 FEB 28 THUR 1.0161 1.0077
60 66.57 65.60 69.67 73.42 72.92 70.40 72.92 84.40 81.42 95.50 95.32 83.90 90.40 115.05 127.25 13 MAR 1 FRI 1.0177 1.0089
61 67.15 65.52 69.67 73.95 74.00 69.75 74.00 84.87 81.15 95.42 94.37 82.20 90.60 114.75 125.70 13 MAR 4 MON 1.0109 1.0084
62 67.10 65.45 69.50 74.42 73.57 70.15 73.57 85.20 80.35 95.72 92.90 82.45 91.25 115.90 123.85 13 MAR 5 TUE 1.0084 1.0072
63 66.72 65.50 69.22 74.57 73.75 69.60 73.75 87.50 78.55 96.82 92.32 83.05 91.47 117.45 123.15 13 MAR 6 WED 1.0086 1.0085
64 66.95 65.17 69.32 73.82 73.85 69.67 73.85 86.72 78.85 98.75 92.10 82.35 91.67 116.95 123.92 13 MAR 7 THUR 1.0112 1.0086
65 67.15 65.17 69.37 73.67 74.32 69.92 74.32 85.85 78.30 98.60 92.00 81.07 91.57 116.95 123.55 13 MAR 8 FRI 1.0071 1.0072
66 67.10 65.17 69.32 73.67 74.57 69.62 74.57 85.57 78.55 98.42 91.50 81.57 92.27 116.65 122.75 13 MAR 11 MON 1.0071 1.0071
67 67.22 66.02 69.25 73.77 74.92 68.47 74.92 85.87 78.50 97.40 91.70 81.25 92.32 113.65 124.30 13 MAR 12 TUE 1.0033 1.0061
68 67.32 65.85 69.47 72.92 76.37 68.95 76.37 86.20 77.80 96.42 92.02 80.95 91.72 110.65 123.85 13 MAR 13 WED 0.9953 1.0051
69 67.47 65.07 68.87 72.52 76.45 69.65 76.45 85.32 78.35 95.75 90.97 81.82 91.95 111.77 122.77 13 MAR 14 THUR 0.9956 1.0037
70 67.47 64.72 68.72 72.72 75.87 69.37 75.87 84.10 77.75 94.27 90.95 82.10 92.80 111.80 121.70 13 MAR 15 FRI 0.9928 0.9998
71 67.02 64.02 68.72 72.47 75.97 68.12 75.97 84.57 77.92 94.85 89.97 82.07 93.60 113.67 121.97 13 MAR 18 MON 0.9964 0.9995
72 66.67 64.45 68.82 72.85 77.35 68.50 77.35 84.65 77.87 94.95 91.50 81.92 93.62 113.85 121.40 13 MAR 19 TUE 0.9982 1.0038
73 67.37 64.30 69.30 72.30 77.00 68.85 77.00 84.25 77.45 94.92 89.95 81.40 93.97 113.35 121.90 13 MAR 20 WED 0.9946 1.0020
74 66.82 64.32 69.40 72.55 76.12 68.77 76.12 84.87 77.30 95.35 90.97 83.12 95.17 114.77 121.80 13 MAR 21 THUR 1.0031 1.0046
75 66.67 63.87 69.40 72.17 75.05 68.97 75.05 HOLIDAY 76.50 94.70 HOLIDAY 82.85 95.12 117.75 120.25 13 MAR 22 FRI 1.0021 1.0014
76 66.95 64.07 69.72 72.40 75.12 69.55 75.12 85.77 75.80 95.12 90.85 83.40 94.07 116.97 120.77 13 MAR 25 MON 1.0002 1.0029
77 66.85 64.47 69.95 72.85 73.57 70.05 73.57 85.82 75.35 93.35 90.85 83.37 92.37 117.90 121.70 13 MAR 26 TUE 0.9962 0.9997
78 65.75 63.85 68.77 72.72 72.92 70.05 72.92 85.17 74.55 93.42 90.05 82.47 92.87 119.57 120.10 13 MAR 27 WED 0.9932 0.9936
79 65.30 63.22 68.80 73.07 73.10 69.82 73.10 85.25 74.70 93.95 88.60 81.85 92.12 120.97 117.80 13 MAR 28 THUR 0.9889 0.9910
80 65.97 64.12 68.97 72.67 73.62 70.02 73.62 85.42 74.30 94.87 87.87 HOLIDAY HOLIDAY 121.25 116.10 HOLIDAY 13 MAR 29 FRI Good Friday 0.9868 0.9927
© 2012 Steiner Consulting Group (1-800-526-4612)
6. 2013 Seasonal Trader Report: President's Day Base
JUNE LIVE CATTLE - SEVEN & FIFTEEN YEAR AVERAGE SEASONAL FACTORS FOR A PRESIDENT'S DAY BASE
1998 1999 2000 2001 2002 2003 2004 2005 2006 2007 2008 2009 2010 2011 2012 2013 SEASONAL SEASONAL
JUNE JUNE JUNE JUNE JUNE JUNE JUNE JUNE JUNE JUNE JUNE JUNE JUNE JUNE JUNE JUNE FACTOR 7 YR FACTOR 15 YR
Line (2006-2012) (1998-2012)
No. (LCM) (LCM) (LCM) (LCM) (LCM) (LCM) (LCM) (LCM) (LCM) (LCM) (LCM) (LCM) (LCM) (LCM) (LCM) (LCM) Year Month Date Day of Week Holiday BASE BASE
81 65.55 64.02 69.15 73.07 74.30 70.37 74.30 84.12 74.15 96.40 87.75 80.07 92.90 120.90 115.60 13 APR 1 MON 0.9859 0.9928
82 65.77 63.97 68.67 73.42 76.15 70.50 76.15 84.47 72.75 95.00 88.12 81.70 93.17 120.00 115.45 13 APR 2 TUE 0.9838 0.9956
83 66.87 63.60 69.10 73.50 76.22 71.45 76.22 83.52 72.87 95.55 87.55 81.37 93.55 118.25 114.50 13 APR 3 WED 0.9807 0.9956
84 67.72 64.45 68.75 73.70 75.65 71.30 75.65 83.42 73.90 96.32 89.07 83.00 93.52 117.65 115.20 13 APR 4 THUR 0.9888 0.9997
85 67.82 HOLIDAY 69.10 73.37 75.72 71.22 75.72 83.72 74.45 HOLIDAY 89.20 84.17 93.52 116.95 HOLIDAY 13 APR 5 FRI 0.9911 1.0012
86 67.60 65.22 69.12 73.45 76.20 71.95 76.20 83.67 74.70 96.70 89.50 84.37 94.20 116.90 115.60 13 APR 8 MON 0.9944 1.0049
87 67.72 65.30 69.27 72.57 76.80 71.77 76.80 84.67 74.42 95.80 89.57 83.75 93.57 115.60 114.25 13 APR 9 TUE 0.9874 1.0029
88 68.02 64.92 69.15 72.10 76.07 71.92 76.07 84.27 75.00 94.62 87.75 83.77 94.75 115.77 113.95 13 APR 10 WED 0.9855 0.9999
89 68.45 63.77 69.45 72.10 76.67 71.67 76.67 84.85 75.00 92.47 89.80 84.60 94.32 116.50 116.60 13 APR 11 THUR 0.9901 1.0029
90 HOLIDAY 65.20 69.35 HOLIDAY HOLIDAY 71.90 HOLIDAY 84.42 HOLIDAY 92.70 89.77 84.60 94.75 115.30 115.70 13 APR 12 FRI 0.9885 1.0034
91 68.22 65.00 68.97 72.45 78.95 71.72 78.95 84.55 74.92 92.90 90.10 84.60 94.05 115.80 115.35 13 APR 15 MON 0.9883 1.0069
92 68.22 64.32 69.27 72.47 78.67 71.87 78.67 85.40 75.20 93.27 91.57 83.80 93.47 117.17 116.27 13 APR 16 TUE 0.9922 1.0086
93 67.82 63.60 69.52 72.25 78.52 70.47 78.52 85.52 75.10 92.82 91.65 84.77 92.95 116.50 114.80 13 APR 17 WED 0.9897 1.0049
94 68.12 63.17 69.07 71.47 76.95 70.60 76.95 85.45 75.15 92.72 92.65 85.12 94.30 115.22 115.15 13 APR 18 THUR 0.9927 1.0022
95 68.00 63.35 HOLIDAY 71.75 76.07 HOLIDAY 76.07 85.72 74.10 92.27 92.32 84.52 94.65 HOLIDAY 115.20 13 APR 19 FRI 0.9892 0.9995
96 67.67 62.90 69.27 72.05 76.22 71.05 76.22 87.12 72.92 93.15 91.95 82.62 94.50 112.80 113.60 13 APR 22 MON 0.9796 0.9965
97 68.27 63.70 69.65 71.55 77.92 71.32 77.92 87.12 72.95 93.30 92.10 83.27 94.60 112.30 111.57 13 APR 23 TUE 0.9783 1.0006
98 68.80 63.50 69.72 71.27 76.92 71.67 76.92 85.62 73.45 93.32 92.87 83.15 95.45 113.55 112.00 13 APR 24 WED 0.9837 1.0005
99 67.70 62.67 69.40 71.70 75.67 71.12 75.67 85.60 72.95 92.70 92.67 83.47 95.60 113.17 112.00 13 APR 25 THUR 0.9818 0.9950
100 68.17 62.72 69.27 71.95 76.47 71.47 76.47 85.62 73.12 93.27 93.37 82.60 94.82 113.35 111.55 13 APR 26 FRI 0.9811 0.9971
101 67.81 64.17 69.32 73.19 73.22 70.87 73.29 83.36 81.44 92.23 92.78 83.77 89.87 113.28 122.54 AVERAGE PRICE 1.0000 1.0000
© 2012 Steiner Consulting Group (1-800-526-4612)
7. 2013 Seasonal Trader Report: President's Day Base
JUNE LIVE CATTLE - SEVEN & FIFTEEN YEAR AVERAGE SEASONAL FACTORS FOR A PRESIDENT'S DAY BASE
1.0800
7 Year Seasonal Factor
1.0600 15 Year Seasonal Factor
1.0400
1.0200
SEASONAL FACTOR
1.0000
0.9800
0.9600
0.9400
0.9200
Dec Jan Feb Mar Apr
12/10/2012 4/26/2013
© 2012 Steiner Consulting Group (1-800-526-4612)