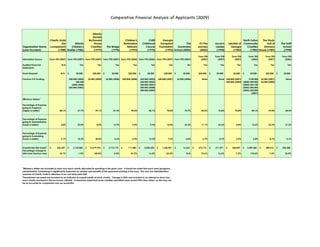
1. Comparative Financial Analysis of Applicants (2009)
Atlanta
Ronald
Charity Guild McDonald Children's CURE Georgia North Fulton The Study
(for Atlanta House Restoration Childhood Transplant The It's The Jacob's Lekotek of Community Hall at The Swift
Organization Name comparison) Children's Charities The Bridge Network Cancer Foundation Governess Journey Ladder Georgia Charities Emmaus School
(year founded) (1988) Shelter (1986) (1979) (1970) (1993) (1975) (1992) School (2005) (2002) (1998) (1983) (1983) House (1989) (1998)
Form 990 Form 990 Form 990 Form 990 Form 990 Form 990
Information Source Form 990 (2007) Form 990 (2007) Form 990 (2007) Form 990 (2007) Form 990 (2006) Form 990 (2006) Form 990 (2007) Form 990 (2007) (2007) (2007) (2007) (2006) (2007) (2006)
N/A Yes Yes Yes Yes Yes Yes No Yes Yes Yes Yes Yes Yes
Audited Financial
Statements
Grant Request: N/A $ 20,000 $20,000 $ 20,000 $20,000 $ 20,000 $20,000 $ 20,000 $20,000 $ 20,000 $5,000 $ 20,000 $20,000 $ 20,000
Previous CG Funding: $38,000 (2004) $5,000 (2008) $5,000 (2008) $40,000 (2008) $30,000 (2003) $40,000 (2007) $5,000 (2008) None None $68,000 (2001) $140,000 $5,000 (2007) None
$40,000 $30,000 (2005) $40,000 (2003) (2000) $40,000 $4,000 (2008)
(2006,2008) $40,000 (2007) (2004) $43,100
$50,000 (2003) $40,000 (2008) (2005) $40,000
$40,000 (2009) (2006) $40,000
(2007)
Efficiency Ratios:1
Percentage of Expense
going to Programs
(higher is better) 88.1% 67.7% 59.1% 81.5% 90.4% 82.1% 78.8% 74.7% 83.2% 76.8% 92.8% 84.1% 69.0% 68.5%
Percentage of Expense
going to Administration
(lower is better) 2.8% 22.0% 8.0% 13.9% 5.4% 4.5% 14.0% 25.3% 11.1% 22.6% 4.8% 13.6% 22.3% 31.3%
Percentage of Expense
going to Fundraising
(lower is better) 9.1% 10.3% 30.0% 4.6% 4.3% 13.5% 7.2% 0.0% 5.7% 0.7% 2.5% 2.4% 8.7% 0.1%
Unrestricted Net Assets2 $ 236,229 $ 2,135,085 $ 12,679,955 $ 3,712,172 $ 111,482 $ 2,030,350 $ 1,606,421 $ 16,663 $ 672,716 $ 211,471 $ 368,429 $ 2,209,682 $ 680,316 $ 506,388
Percentage Change in
UNA from Previous Year 14.1% -1.9% 100.4% -5.3% 47.5% 16.3% -25.5% N/A 75.6% 16.6% -7.2% 110.6% 7.3% 22.9%
1
Efficiency Ratios are included to show how each charity allocated its spending in the given year. It should be noted that each area (programs,
administration, fundraising) is significantly impacted by salaries and benefits of the personnel working in the area. The very low administration
expense of Charity Guild is reflective of our not using paid staff.
2
Unrestricted net assets are included as an indicator of overall wealth of each charity. Change in UNA was included in an attempt to show how
each charity has fared in this economic cllimate. It should be noted that some charities submitted more recent 990's than others, so this may not
be as accurate for comparison was we would like.