The saturday economist investment update august 2015
•
1 gefällt mir•436 views

The Saturday Economist - Investment Update Chart book reviews the latest ONS data and outlines the forecasts for 2015 and 2016. The Charts accompany the LinkedIn article "Ten things everyone should know about UK Investment"

Empfohlen
Weitere ähnliche Inhalte
Was ist angesagt?
Was ist angesagt? (20)
Andere mochten auch
Andere mochten auch (8)
Ähnlich wie The saturday economist investment update august 2015
Ähnlich wie The saturday economist investment update august 2015 (20)
Mehr von John Ashcroft
Mehr von John Ashcroft (20)
Kürzlich hochgeladen
Kürzlich hochgeladen (20)
The saturday economist investment update august 2015
- 1. The Saturday Economist . com Investment Update August 2015 For more information - Check out The Saturday Economist .com
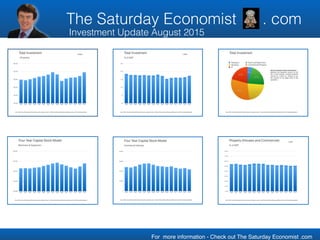
- 2. 100,000 150,000 200,000 250,000 300,000 350,000 2000 2001 2002 2003 2004 2005 2006 2007 2008 2009 2010 2011 2012 2013 2014 Total Investment All sectors Data : ONS : Gross Fixed Capital Formation by sector and type of asset : £ million Chained Volume Measures (Reference Year 2011) Seasonally Adjusted. £ million For more information - Check out The Saturday Economist .com
- 3. 0.0 5.0 10.0 15.0 20.0 25.0 2000 2001 2002 2003 2004 2005 2006 2007 2008 2009 2010 2011 2012 2013 2014 17.3 16.416.116.116.0 15.4 17.2 18.0 17.517.517.717.617.817.8 18.5 Total Investment % of GDP Data : ONS : Gross Fixed Capital Formation by sector and type of asset : £ million Chained Volume Measures (Reference Year 2011) Seasonally Adjusted. % GDP For more information - Check out The Saturday Economist .com
- 4. 21% 31% 22% 21% 5% Transport Plant and Machinery Housing Commercial Property IP Total Investment Data : ONS : Gross Fixed Capital Formation by sector and type of asset : £ million Chained Volume Measures (Reference Year 2011) Seasonally Adjusted. Not all investment is plant and machinery … Machinery and Equipment accounts for just 22% of total investment. Transport equipment accounts for a further 5%. Property at over 50% accounts for the largest share of total expenditure. For more information - Check out The Saturday Economist .com
- 5. 100,000 150,000 200,000 250,000 300,000 2000 2001 2002 2003 2004 2005 2006 2007 2008 2009 2010 2011 2012 2013 2014 Four Year Capital Stock Model Machinery & Equipment Data : ONS : Gross Fixed Capital Formation by sector and type of asset : £ million Chained Volume Measures (Reference Year 2011) Seasonally Adjusted. For more information - Check out The Saturday Economist .com
- 6. 0 20,000 40,000 60,000 80,000 2000 2001 2002 2003 2004 2005 2006 2007 2008 2009 2010 2011 2012 2013 2014 Four Year Capital Stock Model Commercial Vehicles Data : ONS : Gross Fixed Capital Formation by sector and type of asset : £ million Chained Volume Measures (Reference Year 2011) Seasonally Adjusted. For more information - Check out The Saturday Economist .com
- 7. 0.0% 10.0% 20.0% 30.0% 40.0% 50.0% 60.0% 70.0% 80.0% 2000 2001 2002 2003 2004 2005 2006 2007 2008 2009 2010 2011 2012 2013 2014 51.0%50.8%51.7%52.3%51.7%52.6%52.6% 54.8%55.0%55.3% 54.1% 52.5%53.1% 54.7%54.1% Property (Houses and Commercial) % of GDP Data : ONS : Gross Fixed Capital Formation by sector and type of asset : £ million Chained Volume Measures (Reference Year 2011) Seasonally Adjusted. % GDP For more information - Check out The Saturday Economist .com
- 8. 100,000 150,000 200,000 250,000 300,000 350,000 2000 2001 2002 2003 2004 2005 2006 2007 2008 2009 2010 2011 2012 2013 2014 2015 2016 Total Investment All sectors Data : ONS : Gross Fixed Capital Formation by sector and type of asset : £ million Chained Volume Measures (Reference Year 2011) Seasonally Adjusted. £ million For more information - Check out The Saturday Economist .com Forecasts For a copy of the data sets to accompany the charts - download the Quarterly Economics Outlook - August out soon.
- 9. Total Investment Data : ONS : Gross Fixed Capital Formation by sector and type of asset : £ million Chained Volume Measures (Reference Year 2011) Seasonally Adjusted. For more information - Check out The Saturday Economist .com
- 10. The Saturday Economist . com Investment Update August 2015 For more information - Check out The Saturday Economist .com