India's Crude Oil and Natural Gas Production For Month of April, May and June 2014
•Als DOCX, PDF herunterladen•
0 gefällt mir•728 views

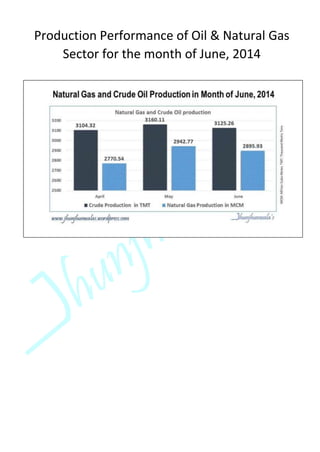
#India's #CrudeOil and #NaturalGasProduction in the Month of April, May and June 2014 In month of June Natural Gas production stood at 2895.93 and Crude Oil production at 3125.26 #CrudeOil #NaturalGas #CrudeOilProduction #IndiaCrudeOil #PetroleumProducts For more Informative post click : https://www.linkedin.com/company/jhunjhunwalas

Empfohlen
Empfohlen
Weitere ähnliche Inhalte
Was ist angesagt?
Was ist angesagt? (8)
Andere mochten auch
Ähnlich wie India's Crude Oil and Natural Gas Production For Month of April, May and June 2014
Ähnlich wie India's Crude Oil and Natural Gas Production For Month of April, May and June 2014 (20)
Mehr von Jhunjhunwalas
Mehr von Jhunjhunwalas (20)
Kürzlich hochgeladen
Kürzlich hochgeladen (20)
India's Crude Oil and Natural Gas Production For Month of April, May and June 2014
- 1. Production Performance of Oil & Natural Gas Sector for the month of June, 2014
- 2. I. A. CRUDE OIL PRODUCTION – PERFORMANCE Month / Period Planned Target (TMT) Actual Production (TMT) %age achievement Surplus(+) Shortfall(-) Vis-à-vis target (%age) Surplus(+) Shortfall(-) over last year (%age) June, 2014* 3191.079 3125.266 97.9 -2.1 0.1 April,2014-June, 2014* 9556.704 9389.707 98.3 -1.7 -0.1 April,2013-June, 2013 9398.418 TMT: Thousand Metric Tonnes. *: Provisional. B. COMPANY WISE ACHIEVEMENT Company / State Planned Target (TMT) Actual Production (TMT) %age achievement Surplus(+) Shortfall(-) (%age) ONGC Gujarat Andhra Pradesh Tamil Nadu Assam Offshore 1902.284 396.342 22.040 19.325 100.820 1363.757 1854.222 374.868 23.144 19.763 93.129 1343.318 97.5 94.6 105.0 102.3 92.4 98.5 -2.5 OIL Assam Arunachal Pradesh 277.920 277.330 0.590 277.921 277.330 0.591 100.0 100.0 100.2 0.0 PRIVATE/JVC 1010.875 993.123 98.2 -1.8 TOTAL 3191.079 3125.266 97.9 -2.1
- 3. C. REASONS FOR SHORTFALL A statement showing Crude Oil Production during June, 2014 and cumulatively for the period April,2014- June, 2014 vis-à-vis 2013-14 is at Annexure-I. II. A. NATURAL GAS PRODUCTION PERFORMANCE Month / Period Planned Target (MCM) Actual Production (MCM) %age achieve- ment Surplus(+) Shortfall(-) Vis-à-vis target (%age) Surplus(+) Shortfall(-) over last year (%age) June, 2014* 2918.864 2895.934 99.2 -0.8 -1.7 April,2014-June, 2014* 8870.720 8607.787 97.0 -3.0 -3.9 April,2013-June, 2013 8956.691 MCM: Million Cubic Meters. *: Provisional. Company / State Reasons for shortfall ONGC (offshore) Less production from NBP (D-1) due to Electrical Submersible Pump (ESP) failure in a few wells. Less line condensate receipt from offshore. ONGC (Gujarat) Increasing water cut, frequent power failure & ageing of fields resulting in decline in reservoir pressure affected production. ONGC (Assam) Poor influx, frequent power failure affected production. OIL (Assam ) High water cut in a few wells and local obstruction at Loc NHK-612. Replacement Pvt/JVCs (Arunachal Pradesh) Sand and water ingress issues in older wells. Pvt/JVCs (Rajasthan) Production is less than target due to well intervention jobs in Mangala Wells in RJ- ON-90/1 field. Pvt/JVCs (Off-shore) Natural decline of the RAVVA & CB-OS/2 field. A total of 10 wells in D1, D3 and 2 wells in MA have ceased to flow due to water /sand ingress in KG-DWN-98/3 field.
- 4. B. COMPANY-WISE ACHIEVEMENT Company / State Planned Target (MCM) Actual Production (MCM) %age achievement Surplus(+) Shortfall(-) (%age) ONGC Gujarat Rajasthan Andhra Pradesh 1954.061 98.244 1.280 88.482 1910.195 122.265 0.072 89.250 97.8 124.5 5.6 100.9 -2.2 Tamil Nadu Assam Tripura Mumbai High Offshore 110.253 35.971 98.034 1521.798 106.805 38.823 97.104 1455.876 96.9 107.9 99.1 95.7 OIL Assam Arunachal Pradesh Rajasthan 221.400 211.830 0.900 8.670 222.542 212.963 0.909 8.670 100.5 100.5 101.0 100.0 0.5 PRIVATE/JVC Onshore $ Offshore 743.403 120.385 623.018 763.197 98.200 664.997 102.7 81.6 106.7 2.7 TOTAL 2918.864 2895.934 99.2 -0.8 $: Including Coal Bed Methane production
- 5. C. REASONS FOR SHORTFALL Company / State Reasons for shortfall ONGC (Rajasthan) Less offtake by consumers. ONGC (Tripura) Less offtake by consumers. ONGC (Tamilnadu) Less offtake by M/s. Gail. ONGC (Offshore) Plant modification at EOA affected production. G-1-11 well was shut down due to umbilical repair operations. Non availability of booster compressor affected production in Bassein region. Pvt/JVCs (West Bengal) Produced CBM is being sold in small quantities as the field is currently under development. Gas productions in line with the offtake. Pvt/JVCs (M.P.) CBM produced in small quantities is being internally used and flared as no market in near vicinity. Pvt/JVCs (Rajasthan) Production is less than target due to well intervention jobs in Mangala Wells in RJ-ON-90/1 field. Pvt/JVCs (Jharkhand) Produced CBM is being sold in small quantities. Pvt/JVCs (Off-shore) A total of 10 wells in D1, D3 and 3 wells in MA have ceased to flow due to water /sand ingress in KG- DWN-98/3 field. Tapti gas production is less than target due to early well loading of MTA 2 and STA 7 well integrity issue. A statement showing natural gas production during June, 2014 and cumulatively for the period April,2014- June, 2014 vis-à-vis 2013-14 is at Annexure-II. III. A. REFINERY CRUDE THROUGHPUT (IN TERMS OF CRUDE OIL PROCESSED) Month / Period Planned Target (TMT) Actual Production (TMT) %age achievement Surplus(+) Shortfall(-) Vis-à-vis target (in %age) Surplus(+) Shortfall(-) over last year (in %age) June, 2014* 17988.208 18353.453 102.0 2.0 1.2 April,2014-June, 2014* 54437.502 54169.498 99.5 -0.5 -1.0 April,2013-June, 2013 54697.996 Note: 1. RIL (SEZ) production figures for May, 2014-June, 2014 are on pro rata basis. The crude throughput in IOC (Barauni), BPCL (Mumbai & Kochi), HPCL( Visakh), CPCL (Manali), NRL (Numaligarh), ONGC (Tatipaka), BORL (Bina), HMEL (Bhatinda), RIL(SEZ) & Essar (Vadinar) refineries have exceeded their planned target. The crude throughput in IOC (Guwahati, Gujarat, Haldia, Mathura, Digboi, Panipat & Bongaigaon), HPCL (Mumbai), CPCL (Narimanam), MRPL( Mangalore) & RIL (SEZ) refineries was less than their planned target.
- 6. Company / State Reasons for shortfall IOCL, Guwahati Throughput is marginally lower due to problem in coker unit. IOCL, Gujarat Throughput is lower because of deferment of planned shutdown to the current month. IOCL, Mathura Throughput is restricted because of high black oil stock. IOCL, Panipat Throughput is lower of shifting of planned shutdown to the current month. IOCL, Bongaigoan Throughput is lower of shifting of planned shutdown to the current month & as per the crude availability. CPCL, Narimanam Throughput is lower than planned due to reduced availability of crude. A statement showing refinery-wise production during the month of June, 2014 and cumulatively for the period April,2014-June, 2014 vis-à- vis 2013-14 is at Annexure-III. II. REFINERY CAPACITY UTILISATION Month Utilisation (%) Period Utilisation (%) June, 2014* 103.8 June, 2013- June, 2014 101.0 June, 2013 102.6 June, 2012- June, 2013 102.0 The refinery-wise details of the capacity utilisation during June, 2014 and cumulatively for the period April, 2014 - June, 2014 vies-a-vies 2013-14 are given in Annexure-IV.