SlideShare ist ein Scribd-Unternehmen logo
1 von 49
Downloaden Sie, um offline zu lesen
Patenting Prosperity:
                   Invention and Economic Performance in the
                   United States and its Metropolitan Areas
                   Jonathan Rothwell, José Lobo, Deborah Strumsky, and Mark Muro


                     An analysis of national and metropolitan area invention from 1980 to 2012, using a new compre-
                     hensive database of patents, reveals:

                     n  he rate of patenting in the United States has been increasing in recent decades and
                       T
                       stands at historically high levels. Growth in patent applications slowed after the IT bubble
                       and the Great Recession, but the rate of patenting by U.S. inventors is at its highest point
                       since the Industrial Revolution. Moreover, patents are of objectively higher value now than in
“ nventive
 I                     the recent past and more evenly dispersed among owners than in previous decades. Still, the
                       United States ranks just ninth in patents per capita using appropriate international metrics, as
capacity and           global competition has increased.

activity—            n  ost U.S. patents—63 percent—are developed by people living in just 20 metro areas,
                       M
                       which are home to 34 percent of the U.S. population. Reflecting the advantages of large
                       metropolitan economies, 92 percent of U.S. patents are concentrated in just 100 metro areas,
including RD          with 59 percent of the population. For patents applied for from 2007 to 2011, the metro areas
                       with the highest number per capita are San Jose; Burlington, VT; Rochester, MN; Corvallis, OR;
investment, a          and Boulder, CO.

science-oriented     n  nventions, embodied in patents, are a major driver of long-term regional economic
                       I
                       performance, especially if the patents are of higher quality. In recent decades, patenting
workforce,             is associated with higher productivity growth, lower unemployment rates, and the creation of
                       more publicly-traded companies. The effect of patents on growth is roughly equal to that of
collaboration,         having a highly educated workforce. A low-patenting metro area could gain $4,300 more per
                       worker over a decade’s time, if it became a high-patenting metro area.
and patented         n  esearch universities, a scientifically-educated workforce, and collaboration play an
                       R
                       important role in driving metropolitan innovation. Metro areas with high patenting rates
output—are             are significantly more likely to have graduate programs in science, especially high-ranking
                       programs, even adjusting for tech sector employment. A high share of college graduates from
realized most          science fields is also strongly related to higher patenting levels and rates. Additionally, metro
                       areas that collaborate more on patenting, patent more.
completely in
                     n  atents funded by the U.S. government tend to be of especially high quality, and federal
                       P
the nation’s           small business RD funding is associated with significantly higher metropolitan produc-
                       tivity growth. The U.S. government supports more basic research than the private sector,
metropolitan           and so outputs are more likely to be scientific publications than patents. Still, the patents and
                       other research projects that are supported appear to be highly valuable to both regions and
                       society.
areas.”
                     For all the success of the United States, the value of invention is not evenly shared across
                     regions because of the clustering of assets like science majors, tech sector workers, and leading
                     research universities. As a result, metropolitan, state, and federal policy makers need to consider
                     ways to foster these attributes more broadly and generally support research and development,
                     as discussed below. The report also recommends reforms to patent law to protect startups and
                     other productive companies from frivolous and expensive legal challenges.


                   BROOKINGS | February 2013                                                                               1
Introduction


    I
           nnovation is central to economic growth.1 Arguably, the most valuable innovations have been
           embodied in technologies that perform work, such as the provision of energy or health, product
           assembly, information storage and retrieval, and transportation, to name just a few functions.
           Such technologies have radically transformed the way humans live for the better and, along with
    political reforms, have allowed hundreds of millions of men and women descended from serfs, slaves,
    and peasants to obtain a measure of health and affluence previously available only to elites.2
       In the midst of a weak recovery from a particularly severe recession, many people are wondering
    whether the United States is in a state of decline, lacking the dynamism it once had.3 According to one
    recent survey, more Americans think the nation’s best days are in the past, not the future.4 Among the
    long-run drivers of innovation, economists have been identified factors such as education and political
    institutions that enforce basic rights and treat people as equals.5 There are reasons to be concerned:
    The growth rate of adults obtaining a college education has slowed over the last three decades, test
    scores are low compared to other developed countries, income inequality has increased, and U.S.
    political institutions have become ideologically polarized.6 Moreover, some argue that U.S. inventive
    output is flagging in the face of other related challenges, including global competition, increasing tech-
    nological complexity, and weak public sector support relative to other countries.7
       More fundamentally, the United States still ranks very high globally on a number of important
    measures of innovative capacity, though other developed countries have caught up or overtaken it.
    One study rates the United States fourth in the world in terms of innovative capacity but notes that
    it ranks near the bottom on changes over the previous ten years in the underlying variables.8 On the
    weaker side, using internationally-oriented patent applications filed from 2000 to 2010 per resi-
    dent, the United States ranks somewhat lower at ninth, and it is just 13th on science and engineering
    publications per capita.9 More positively, the United States ranks third on GDP per worker, behind only
    Luxembourg and oil-rich Norway.10 On RD spending per capita, it ranks second, behind only Finland.11
    Finally, according to the Leiden Ranking (from Leiden University in the Netherlands), all ten of the
    world’s top research universities are in the United States and 43 of the top 50, led by MIT, Princeton,
    Harvard, and Stanford.12 All of these factors play a role in American innovation.
       The focus of this report is on inventive activity, which yields enormous benefits to society that go
    well beyond the gains from inventors and producers.13 One measure of inventive activity—the num-
    ber of patents granted per person—has been increasing in the United States, alongside research
    and development.14 Some scholars have even suggested that too many patents have been granted
    and attribute an increase to the declining rigor of approval standards.15 Yet, there is a large body of
    compelling evidence showing that most patents do actually represent valuable inventions, especially
    “high quality” patents—meaning those that are highly cited or those that advance more intellectual
    property claims.16 Despite wide variation in value, economists have calculated that the average patent
    is worth over half a million dollars in direct market value (and considerably more in social value as the
    technology and its ideas become diffused).17 These estimates are consistent with recent patent sales
    reported in the media from Eastman Kodak, Motorola, Nortel, and Nokia, which have ranged $477,000
    to $760,000 per patent, and even single patents from relatively unknown companies list patent prices
    at an online website for $1 million.18 Still, some are sold for much less, and others never generate any
    market or social value or become obsolete after a few years. For example, despite the large legal costs
    of obtaining a patent, 16 percent of patents are allowed to expire after just four years because the
    owners refuse to pay even a $900 maintenance fee.19 In any case, there is evidence that patent value
    is increasing. One indication is that scientific and technical research is increasingly collaborative in the
    United States and globally, and this appears to be leading to more valuable patents and publications.20
    Another is that corporate income from manufacturing sector royalties—which come largely from the
    licensing of patents—increased by 89 percent from 1994 to 2009, almost double the growth rate of
    patents granted to domestic inventors.21
       However measured, inventive capacity and activity—including RD investment, a science-oriented
    workforce, collaboration, and patented output—are realized most completely in the nation’s metro-
    politan areas. Their overlapping social and infrastructure networks, linking and fostering interactions
    among individuals and businesses have made cities and their surrounds, since their very beginnings,


2                                                                                  BROOKINGS | February 2013
the privileged settings for invention and innovation. As Adam Smith argued in the 18th Century,
the large population size of metropolitan regions fosters trade and specialization, which increases
productivity and frees people up for research activity.22 Moreover, metropolitan areas facilitate the
matching of workers to firms, learning between specialists, and the sharing of suppliers, customers,
and regional assets.23 Consequently, patenting activity in the United States has always been largely
an urban phenomenon and is highly concentrated in large metro areas today.24 This is also true glob-
ally: 93 percent of the world’s recent patent applications were filed by inventors living in metropolitan
areas with just 23 percent of the world’s population.25
   While U.S. invention remains a global force, a survey of the innovation related literature reveals
that the country needs to work out a few crucial problems if it is to realize its potential for economic
and social progress. First, while RD spending continues to increase at roughly the same rate as GDP,
there is evidence that inventions are becoming more expensive, more difficult, and more internation-
ally competitive such that an even deeper commitment will be needed in both the near term and
thereafter. Moreover, as the nation addresses its public finance problems, there will be pressure to
cut RD support. In fact, the federal commitment has already been shrinking in that spending has
not kept up with GDP. This trend should be reversed. The public sector has a vital role to play in sup-
porting innovation and invention.
   Second, the nation’s unequal access to high quality schooling means that too few—especially those
born into lower income families—are academically prepared to meaningfully contribute to invention,
and that not only delimits economic opportunity, it deprives the innovation system of a large number
of people who might otherwise make or commercialize important discoveries.26 This was not the case
during America’s most productive decades of the industrial revolution—after the Civil War and into
the early 20th Century—when patenting was “democratized” and mostly done by blue collar workers,
many of whom were not professional inventors.27
   Third, while the patent system is not fundamentally broken, neither is it functioning as effica-
ciously as possible. Some have concluded that the entire system should be abolished based on such
considerations.28 That would be a big mistake. Recognizing that ideas can be easily transmitted, cop-
ied, and reproduced, the nation’s founders, including Madison and Jefferson, took for granted that
the patent system was an obvious and necessary means to promote invention.29 All but a tiny fraction
of the early industrial revolution’s great inventions were patented.30 Of 5,000 start-up companies
founded in 2004, the share receiving venture capital financing—an indicator of market viability—was
14 times higher for companies with patents.31 Comparative economic studies of patent systems tend
to verify the Madisonian view, and industries that rely more on patenting are more competitive than
those that do not.32 The increase in formal litigation is a problem, but it has roughly grown at the
same pace as the increase in patents.33
   Still, in patent law’s delicate balancing of incentives to invent with competition, the academic
community has largely concluded that the balance leans too heavily in favor of intellectual prop-
erty protection, especially with respect to the U.S. Patent and Trademark Office (USPTO), which
is regarded by some scholars as less rigorous than the European Patent Office (EPO) or even the
Japanese Patent Office (JPO).34 Concerns include, but are not limited to, a decline in the quality of
patents being issued, the granting of excessively broad claims over questionable subject matter, the
granting of patent protection to “nature,” to functions, or otherwise inappropriate subject matter, the
difficulty of entering markets with many patents, and abuse of the legal system to extract rewards for
infringement without contributing to innovation. The growing popularity of open-source software is
something of a rebuke to the patent system.35
   It should be noted that Congress and the USPTO are aware of these concerns, and the pendulum
may be swinging in the other direction.36 The American Invents Act, signed into law in 2011, was
designed, in part, to address them by taking steps to increase examination quality and make abu-
sive litigation less likely. Likewise, a 2012 Supreme Court decision clarified limitations on patenting
laws of nature.37 A similar clarification of rules with respect to software patents would be valuable in
clarifying that functions, as opposed to the means of performing functions through software code or
processes, should not be granted patents.38 Moreover, there is disturbing evidence that non-produc-
ing entities (NPEs or firms deemed “trolls”) are taxing productivity activity by buying up large patent
portfolios with the sole purpose of suing producers. Such is the problem that the Department of


BROOKINGS | February 2013                                                                                   3
Justice and the Federal Trade Commission hosted a recent workshop on the anti-competitive impli-
    cations of these trends.39 More specifically, survey-based evidence reveals that trolls are extracting
    billions of dollars (as much as $29 billion in 2011) in payment, and that they often target small players,
    often startups, imposing huge cost burdens, while suppressing production.40 In 2011, they initiated an
    estimated 40 percent of lawsuits, up from 22 percent in 2007.41 Other studies have shown that NPEs
    account for most cases involving frequently litigated patents, and that NPEs tend to acquire very high-
    value patents for that purpose.42 Settlements reached out of court often do not result in any public
    records, but there is now abundant anecdotal evidence and a growing sense of outrage that non-pro-
    ducers are effectively extorting companies on a large scale.43 This needs to be resolved.
       Finally, the nation must wrestle with the geography of innovation. As economist Enrico Moretti has
    persuasively argued, highly educated metropolitan areas have grown increasingly apart on measures
    of income and even health than less educated metropolitan areas in recent decades, reflecting the
    importance of industry clusters and urban economics in a technologically-infused world that increas-
    ingly rewards education.44 Less educated areas where temporarily bolstered by the housing bubble
    because of their cheap land value and labor costs, and even highly educated areas were often seduced
    into supporting large and wasteful public investments in consumer projects—like new sports com-
    plexes.45 A better use of local, state, and—when appropriate—federal dollars would be on shoring up a
    region’s market failures or otherwise helping to solve pressing needs for things like educated work-
    ers, investment capital, infrastructure, or research institutions. For example, a remarkable study from
    Finland found that the opening of three technical research universities boosted patenting there by 20
    percent, with large effects on engineering education near the universities.46
       With these concerns in mind, this report examines the importance of patents as a measure of inven-
    tion to economic growth and explores why some areas are more inventive than others. Why should we
    expect there to be a relationship between patenting and urban economic development? As economist
    Paul Romer has written, the defining nature of ideas, in contrast to other economic goods, is that they
    are non-rival: their use by any one individual does not preclude others from using them.47 Although
    useful ideas can be freely transmitted and copied, the patent system guarantees, in principle, tem-
    porary protection from would-be competitors in the marketplace (i.e. excludability). Thus, one would
    expect regions to realize at least some of the value of invention, as has been shown for individual
    inventors and companies that patent.48 Yet there is no guarantee that patents generated in a spe-
    cific location will generate wealth in that same location—a set of conditions (the presence of a skilled
    and diverse labor force, an “ecosystem” of businesses providing complementary goods and services,
    financing and marketing capabilities among them) have to be met for invention to be commercialized.
    Research has established that patents are correlated with economic growth across and within the
    same country over time.49 Yet, metropolitan areas play a uniquely important role in patenting, and the
    study of metropolitan areas within a single large country—the United States—allows one to isolate the
    role of patents from other potentially confounding factors like population size, industry concentration,
    and workforce characteristics.
       After briefly summarizing the methods used to address these issues, the report proceeds with an
    analysis of U.S. trends in patenting, with a view to addressing the vibrancy, or lack thereof, in U.S. eco-
    nomic performance. It also assesses how the quality of patents has changed over time and depends on
    the source of funding. Then the analysis turns to the role of metro areas in invention and the effects
    that invention has on regional economic development, measured by productivity and unemployment.
    This study also goes deeper to explore the role of universities and other local institutions as well as
    science-educated workforce in accounting for why some areas patent more than others. The report
    concludes with reform proposals to protect innovative companies from unwarranted legal costs and
    boost innovation. It also explains why public investments in RD and deployment are needed to real-
    ize the country’s full potential to innovate, and how educational inequality is hindering U.S. economic
    performance.


4                                                                                 BROOKINGS | February 2013
Methods

Source and Description of Patent Data
The USPTO maintains patent records from its founding in 1790. Yet, for research purposes, much of
the information from previous centuries has not been digitized and thus is not readily available for
research use. Starting with patents granted in1975, however, the USPTO has digitized information on
inventor and assignee (patent owner) names, as well as addresses and other detailed characteristics of
the patent.
   More detailed methodology can be found on the report’s web page at www.brookings.edu/research/
reports/2013/02/patenting-prosperity-rothwell or directly at www.brookings.edu/sitecore/shell/~/
media/Research/Files/Reports/2013/02/patenting prosperity rothwell/patenting-prosperity-rothwell-
appendix.pdf.
   Deborah Strumsky has assembled this information and organized it into what is the most up-to-
date and complete research database of all patenting activity that the authors are aware of, which is
why we call it the Strumsky Patent Database. It is similar in many respects to the COMETS database
and the NBER patents database, which are both excellent resources for patent scholars.50 Still, the
Strumsky Database has some unique features listed here:
   •	  omplete coverage of all patents—including plant and design patents—from 1975 to 2012
      C
      (March 20, 2012 for this analysis).
   •	  sing a distinct algorithm, it links inventors to their metropolitan area of residence allowing for
      U
      detailed spatial analysis (COMETS offers a different version of this).51 A metropolitan area time
      series is thereby available.
   •	 t provides a large number of “quality” metrics for each patent. Those emphasized in this report
      I
      are claims and citations. Claims define the patent’s invention and what is legally enforceable
      about it; patents with multiple distinct inventions enumerate multiple claims.52 Citations to a pat-
      ent are made if subsequent patents utilize relevant or related knowledge, as determined by the
      applicant (who is legally bound to mention such references) and the examiner. Both measures are
      widely acknowledged as indicating value in the academic literature on patents.
   •	  ach patent has a USPTO technology code (class number), as well as a more aggregate classifica-
      E
      tion and sub-classification scheme created by Strumsky, which provides a sense of the industrial
      orientation of each patent.
   •	  atents are linked to inventors and patent owners (assignees), thereby allowing researcher to
      P
      match inventor address information to assignees to calculate ownership statistics by metropolitan
      area and according to different technological categories.
   •	 Government grant funding is indicated using information on the patent record.
   •	  niversities, government agencies, foreign and domestic individuals and corporations are identi-
      U
      fied as distinct categories of assignees.
   Patent data was combined with other public data sources for the United States and all of its 366
metropolitan areas, which are statistical approximations of local and regional labor markets (e.g. a
city and its suburbs). In the United States, Metropolitan Statistical Areas are defined by the U.S. Office
of Management and Budget (OMB) based on data gathered by the Census Bureau. OMB locates these
areas around a densely populated core, typically a city, of at least 50,000 people. Counties that have
strong commuting ties to the core are then included in the definition of the metropolitan area.53
   Focusing on the period from 1980 to 2010, the main measure of metropolitan economic perfor-
mance used here is productivity, measured as value-added (or GDP) per worker. Unemployment rates
were also analyzed as an outcome variable. In order to explain productivity and unemployment trends
in metropolitan areas, a number of control variables were analyzed alongside patenting levels (the
number of patents invented in a metropolitan area) and rates (patents invented per worker). These
variables include population, the share of adults with a bachelor’s degree or higher, the share of
workers employed in the tech sector (see appendix for definition), housing prices, and the level of
productivity predicted by a metro area’s industrial mix and national averages of productivity in those
sectors (i.e. predicted productivity). The motivation for using this variable is that it captures the effect
of national productivity trends on metropolitan industrial sectors, and thus makes places like New York
(with a large financial sector) comparable to Las Vegas (which has a large hospitality sector).54


BROOKINGS | February 2013                                                                                      5
The econometric analysis predicts the outcome variables using independent variables measured ten
    years in the past to avoid bias from reverse causation. The analysis also includes metropolitan effects,
    to control for unchanging characteristics of metropolitan areas, such as weather, history, and political
    institutions, and decade effects to capture national trends (in commodity or stock market prices, for
    example) that affect all metropolitan areas.
       The appendix discusses more specific details of the data and analysis. Otherwise, the sources for
    information introduced into the text below are cited either directly or through endnotes. Much of the
    summary data here will be made available on the Brookings website at the report’s homepage.


    Findings
    The rate of patenting in the United States has been increasing in recent decades and
    stands at historically high levels.

    Though the United States was still recovering from the Great Recession, 2011 marked a new record
    high for the number of patents granted by the USPTO for both foreign and domestic-based inventors.55
        As noted earlier, some economists and scholars have argued that invention is harder today than
    ever before because the “low-hanging fruit” has already been plucked. Yet, even if this is true, there
    are more scientists working today than ever before and research and development (RD) spending
    is at an all time high. Science professors, engineers, and scientists comprised less than 1 out of every
    1000 U.S. workers in 1910, but 25 out of every 1000 in 2010.56 Perhaps, that is why the rate of patent-
    ing is nearly as high today as any point in U.S. history, as Figure 1 demonstrates covering 212 years of
    invention.
       To be more exact, consider the 10 most inventive years in U.S. history, measured by patents per
    capita. The data excludes patents granted to foreign inventors. They are 1916, 1915, 1885, 1932, 2010,
    2011, 1931, 1883, 1890, and 1917. In other words, two of these years came just after the Great Recession.
    The others were in the midst of the Industrial Revolution and post-Civil War America.


             Figure 1. History of Patented U.S. Inventions per Capita, 1790–2011 by Year Granted
       450

       400

       350

       300

       250

       200

       150

       100

        50

         0
             1790
             1795
             1800
             1805
             1810
             1815
             1820
             1825
             1830
             1835
             1840
             1845
             1850
             1855
             1860
             1865
             1870
             1875
             1880
             1885
             1890
             1895
             1900
             1905
             1910
             1915
             1920
             1925
             1930
             1935
             1940
             1945
             1950
             1955
             1960
             1965
             1970
             1975
             1980
             1985
             1990
             1995
             2000
             2005
             2010


                10-year moving average of patents per million population   Patents per million residents


6                                                                                 BROOKINGS | February 2013
Stepping back, one can pick out a few eras of U.S. inventiveness. From 1790 to 1853, the rate of
invention was very low, but it exploded in the Industrial Revolution starting in the mid-19th Century
and lasting all the way until the Great Depression. Scholars have characterized this period of U.S.
history as the “golden age” of invention when industries such as textiles, garments, household
utensils, and farming implements experienced tremendous innovation.57 With the onset of the Great
Depression, the rate of invention plummeted from the 1930s to 1955, but there was a noticeable
post-war rebound from 1956 to 1973, when the major research breakthroughs in modern information
technology were first made. The decade from 1974 to 1984 saw a precipitous decline in inventive activ-
ity, but since, then, and starting in 1985, a post-industrial era of invention has begun and patent rates
have steadily increased and remained high.
   There was one exceptional period with respect to this current trend towards higher patenting rates.
The years from 2002 to 2005 saw one of the largest four-year drops in patent per capita since the
Civil War—a decline of 17 percent, compared to a 2 percent increase for the average four year period
since 1870. This was the height of the investment bubble in subprime mortgages, but this drop off also
reflects slowed application growth from 2001 to 2002 in the wake of the IT-bubble. Still, patent growth
has been very strong since the Great Recession officially ended in 2009. The data in Figure 1 refer to
granted patents by the year they were granted, which has been 3 to 4 years after its application in
recently, but the trend is similar for applications; patent application growth was zero from 2007 to
2009 but accelerated to 7 percent from 2009 to 2010 and 3 percent from 2010 to 2011. One would,
therefore, expect a spike in grants in 2013.
   Scholars have noted the strong growth in patenting over the last two decades. Some have argued
that it is the result of changes in patent law, particularly changes that allowed for software patents, or
a relaxation of standards. In other words: Has quantity been achieved at the expense of quality?
   There is evidence here to suggest otherwise. As others have found, objective measures of pat-
ent quality have been increasing in recent decades, such as the number of claims per patent.58 The
trend is illustrated in Figure 2. The number of claims per patent has increased steadily since 1975
and reached a high point in 2005 at 17.4. The measure declined during 2006 and 2007 and started


   Figure 2. Trend in Claims and Citations (Within Eight Years of Grant) for all USPTO Patents
                        Granted Between 1975 and 2012, by Year Granted
      20

      18

      16

      14

      12

      10

       8

       6

       4

       2

       0
           1975197719791981198319851987198919911993199519971999200120032005200720092011


BROOKINGS | February 2013                                                                                    7
growing again in 2010. No recent decade has seen as many claims per patent as the 2000s. The slight
    dip in claims in recent years could be due to increases in the fees charged by the USPTO for over 20
    claims.59 Other scholars have found that the upward trend in claims is partly attributable to the inter-
    nationalization of patent applications and the growing complexity of patenting, but much of the time
    trend cannot readily be explained.60
       The increase in measured patent quality and patent rates coincides with an increase in RD spend-
    ing and does not appear to be entirely driven by legal changes, as patent scholars have noted.61
    Indeed, RD expenditures, adjusted for inflation, increased by an annualized rate of 3.6 percent each
    year from 1980 to 2009, with roughly 70 percent coming from industry sources, and RD spending
    since 1953 is highly correlated with patenting and the patent rate.62 In 2008, inflation-adjusted RD
    reached a record high, with 2009 as the last available year of data.63
       If measured as a share of GDP, RD spending has been more steady over the decades, but in 2009,
    the ratio—2.9 percent—equaled the historic high last achieved in 1964. RD classified as basic, rather
    than applied or developmental, has increased the most rapidly since 1953.64 The U.S. trend is less
    impressive, however, when compared to some other developed countries, when compared data is
    examined. From1981 to 2008, U.S. RD growth was slower than a number of highly developed coun-
    tries such as each of the Scandinavian countries, Spain, Australia, Canada, and Japan, though higher
    than many larger economies like Germany, the United Kingdom and France.65
       The only modest relative growth in U.S. RD may explain why, as noted in the introduction, the
    United States ranks just ninth in patents per capita, using appropriate international data. Patent schol-
    ars have noted a “home-office bias,” meaning that European inventors tend to rely disproportionately
    on the EPO, Japanese inventors on the JPO, and US inventors on the USPTO.66 The Organization for
    Economic Cooperation and Development (OECD), however, provides data on applications filed under
    the Patent Cooperation Treaty (PCT), which creates a universal application for patents that can be
    used across the major patent offices.67 Such patents tend to be more valuable than those using only
    the domestic office applications.68 This limits the comparison to potentially international patents.
    On this score the United States ranks ninth on patent applications filed under the PCT system from
    2000 to 2010, below (in order from the highest) Sweden, Finland, Switzerland, Israel, the Netherlands,
    Denmark, Germany, and Japan. Using only 2010 data, the United States falls to 12th, as Korea, Norway,
    and Austria move ahead. The average Swede is roughly twice as likely to file a PCT application as the
    average American. Those U.S. rankings are identical using data on patents granted by the USPTO and
    filed at all three major offices (EPO, JPO, and USPTO).69
       The inventions from these countries, on net, will likely benefit U.S. consumers, even as some compa-
    nies and workers lose out from competition, but what is more troubling is that additional RD spend-
    ing has not translated into as many patents as one might have expected. Consistent with the concern
    that technologies are becoming more complex, fewer inventions are patented for every dollar of RD.
    From 1953 to 1974, one patent was generated for every $1.8 million of RD. Since 1975, the average
    implicit “cost” has been $3.5 million, about twice as high, in inflation adjusted dollars. As other schol-
    ars have found, the increased cost of RD per patent could be at least partly attributed to an increase
    in quality, but it means RD growth must accelerate.70
       The trend in RD and claims suggest that the increase in the patenting rate may reflect a real
    increase in the number of valuable inventions. Skeptical readers, however, may still want further
    evidence that the trend is not the result of relaxed approval standards, a surge in foreign-inventor
    contributions, or the perverse incentives of litigation. While these and other explanations cannot be
    definitely rejected, the broad evidence is consistent with the conclusion that the rate of invention
    is increasing along with the rate of patenting. The share of patents that have received no citations—
    which does not necessarily indicate that they are or poor quality—has held steady between five and
    six percent in the 1980s and 1990s.71 Moreover, while the share of USPTO patented granted to foreign
    inventors has increased dramatically (and is now almost half), those granted to domestic inventors
    make significantly more intellectual property claims and receive more subsequent citations by a wide
    margin, as Table 1 displays.
       It is also unlikely that changes in litigation practice explain the increased patenting rate. Annualized
    growth in re-examinations from 1981 to 2011 was 4.9 percent compared to 4.8 percent patent growth.72
    Median damages amounted to $2 million in 2010, according to one study, but there was no upward


8                                                                                  BROOKINGS | February 2013
Table 1. Intellectual Property Claims and Citations Within Eight Years of Grant by
              Foreign Status of Inventor, for All Granted Patents Applied For, 1975–2012
     	
    	                                                                             Claims	         Citations within 8 years
    U.S. Inventors	                                                                15.1	                     8.0
    Foreign Inventors	                                                             12.1	                     5.1


    Source: Brookings analysis of Strumsky patent database


                     Table 2. Claims per Patent, and Eight-Year Citations per Patent, in the 10 Largest Subcategories
     	
    		                                        Annual Granted Patents, applications 	             Claims per patent, applied for	              Citations per patent,
	    Subcategory	                                      from 2006-2010	                                 from 2006-2010	                     applied for from 1991-1995
    Communications	                                          10,711	                                          17.2	                                      16.0
    Computer Software	                                        8,395	                                          17.5	                                      18.9
    Semiconductor Devices	                                    8,258	                                          14.2	                                      14.1
    Computer Hardware  Peripherals	                          7,327	                                          16.1	                                      16.2
    Power Systems	                                            6,904	                                          11.7	                                       9.4
    Electrical Systems  Devices	                             5,540	                                          13.8	                                       8.0
    Biotechnology	                                            5,189	                                          15.3	                                       7.0
    Measuring  Testing	                                      4,652	                                          13.5	                                       7.2
    Information Storage	                                      4,626	                                          15.6	                                      11.8
    Transportation	                                           4,533	                                           9.0	                                       6.6
    10 largest subcategories	                                66,134	                                          14.4	                                      11.5
    All subcategories	                                      138,312	                                          12.8	                                       9.8


    Source: Brookings analysis of Strumsky patent database. Patents years are determined by year of application. Each period observation is the average of the five year
    period ending that year. The subtotal and total rows display totals in the first column and un-weighted averages in the second and third columns.


trend compared to recent years.73 While litigation has been increasing, the rate of growth is consis-
tent with the rate of growth in patenting. The number of patent cases filed at U.S. District Courts as a
percentage of all patents remained stable from 1970 to 2008.74 The rate has hovered between 1.2 and
1.6 percent of patents granted.75 By historic standards, this is actually not particularly high, though
comparisons across different institutional arrangements and eras are subject to considerable error.
In the early years of the industrial revolution, the rate was as high as 3.6 percent in the 1840s and
2.1 in the 1850s; many disputes concerned manufacturing industry inventions, the tech sector of the
19th century.76 Before Bell Labs established itself as the darling of invention, Alexander Graham Bell
won large patent infringement cases in the 1870s.77 Likewise, industrial giants GE, founded by Thomas
Edison, and Westinghouse filed hundreds of patent suits in the 1890s.78 None of this is to suggest that
the threat of law suits or the trend in undisclosed settlements have not increased or that of the patent
system’s rules are optimal.79
   To better understand patenting trends, one can start by looking at which technologies are repre-
sented in patents. First of all, almost half (46 percent) of all patents can be grouped in the 10 largest
categories; the patents in this group tend to make more claims and receive more citations compared
to smaller technological groups, which may or may not reflect underlying value.
   The most prominent technological category is communications. Over the five year period ending
in 2010, 10,000 patents were granted to communications technologies, and as Table 2 shows, these
patents were also highly valuable in terms of claims and citations. Leading patent owners over the five
year period include Cisco, IBM, ATT, Qualcom. Two of the next four categories are directly linked to
computers—software (e.g. Microsoft) and hardware (e.g. Apple), and also score highly on citations and


BROOKINGS | February 2013                                                                                                             9
Table 3. Subcategories with the Fastest and Slowest Growth Rates in Patenting from 1980 To 2005,
                                                    by Change in Value Measures
  	
  		                                        Annual Growth Rate in Patents, 	   Change in Claims per Patent, 	                     Change in Eight- year Citations
	 Subcategory	                               1980-2005 (moving average)	              1980 to 2005	                                 per Patent, 1980 to 1995
                                                    Subcategories with the fastest growth in patents
  Computer Software	                                       11%	                              7.3	                                                      12.1
  Data Processing	                                         11%	                              6.3	                                                      11.0
  Semiconductor Devices	                                   10%	                              6.0	                                                       8.1
  Video Distribution Systems	                              10%	                              7.0	                                                      36.1
  Computer Hardware  Peripherals	                           8%	                             7.0	                                                       9.2
  Chemical-Crystals	                                         8%	                             5.4	                                                       7.6
  Nanotechnology	                                            8%	                            10.3	                                                       5.5
  Information Storage	                                       6%	                             7.3	                                                       6.8
  Communications	                                            6%	                             8.4	                                                      11.7
  Design	                                                    5%	                             0.0	                                                       2.4
                                                    Subcategories with the slowest growth in patents
  Chemical-Purification/Evaporation/Distillation	           -2%	                             6.0	                                                       3.6
  Chemical-General Compound  Compositions	                 -3%	                             5.4	                                                       3.0
  Time Measurement  Horology	                              -3%	                             5.1	                                                       3.1
  Machine Element or Mechanism	                             -3%	                             5.7	                                                       2.9
  Chemical-Manufacture Specific	                            -3%	                             7.5	                                                       3.9
  Organic Compounds	                                        -3%	                             5.0	                                                       2.5
  Pipes  Joints	                                           -3%	                             5.2	                                                       3.1
  Education  Demonstration	                                -4%	                             7.4	                                                      10.9
  Hazardous Waste	                                          -4%	                             5.7	                                                       0.5
  Heating, Refrigeration  Ventilation	                     -4%	                             6.8	                                                       2.8


  Source: Brookings analysis of Strumsky patent database. Patents years are determined by year of application. Each period observation is the average of the five year
  period ending that year.


                                          claims. In general, the computer and information technology patents tend to make the most claims
                                          and receive the most citations; the large number of citations may reflect the large scale of the indus-
                                          try’s patenting activities, which would require documenting previous work.
                                             Other large technological groups tend to receive fewer citations and make fewer claims, but none-
                                          theless make large contributions to U.S. and global invention, including a number of older industrial
                                          categories related to power, electrical systems, measuring devices, and transportation. For Electrical
                                          Systems and Devices, some of the leading owners of patents granted between 2006 and 2010 were
                                          IBM, Tyco Electronics (now TE Connectivity), Intel, Broadcom, Texas Instruments, Micron, and the
                                          Eaton Corporation. Transportation includes the auto and aerospace industries, with prominent patent
                                          owners including Goodyear, Ford, GM, Boeing, Honda, Delphi, Lockheed Martin, and Caterpillar. Large
                                          inventors of Power Systems patents include GE, IBM, GM, HP, Lutron Electronics, and Honeywell.
                                          Leading Measuring and Testing patent owners include some lesser known companies like KLA-Tencor,
                                          Schlumberger, Agilent, Applied Materials, and Zygo.
                                             Table 3 reports the technological categories with the strongest and weakest growth rates in patent-
                                          ing from the five year period ending in 1980 to the five year period ending in 2005. Again information
                                          and communication technologies are among the strongest growing technological categories, led by
                                          Computer Software, Data Processing, Video Distribution Systems, Computer Hardware, Information
                                          Storage, and Communications. Computer and information related technologies have also seen sharp
                                          increases in claims and citations per patent. The Nanotechnology category is not frequently used by
                                          the patent examiners, considering that it has less than 1000 total patents, but it has been growing rap-
                                          idly in recent years. It refers mostly to microscopic measurement devices. The Design category refers


                                     10                                                                                                 BROOKINGS | February 2013
Figure 3. Share of Patents Held by Largest 5, 10, 50, and 100 Patent Owners
                                   by Year of Grant, 1976-2012
  50%


  45%


  40%

                                                                                                     Top 100 Share
  35%


  30%
                                                                                                     Top 50 Share

  25%


  20%


                                                                                                     Top 10 Share
  15%

                                                                                                     Top 5 Share
  10%


   5%


   0%
        1976 1978 1980 1982 1984 1986 1988 1990 1992 1994 1996 1998 2000 2002 2004 2006 2008 2010 2012


to the design aspects of miscellaneous machines and cosmetic products, with leading patent owners
including Black and Decker, Procter and Gamble, and Gillette.
   One implication of the industry category analysis becomes clear: Most patents, especially of higher
value, are being generated by a small number of industries, disproportionately and primarily in fields
like computer and information technology, electronics, biotechnology, energy, and transportation. As
a recent report from the USPTO documented, patent intensive industries employ just a small fraction
of the U.S. workforce, and yet these industries drive most of the technological changes that increase
living standards, by reducing the costs of things like food, energy, and information.80
   Yet, that industry concentration has not coincided with limited competition. As Figure 4 shows, pat-
ent ownership has become more dispersed since the mid 1970s and 1980s, at least outside the very
largest firms. The share of patents held by the top 5 patent owning companies has increased slightly
from 9 percent in 1976 to 11 percent in 2012, but the top 10 share has remained stable, and the top 50
and top 100 shares have fallen by 7 and 11 percentage points respectively. The trend is similar even in
the more concentrated and controversial category of software patents.
   Even these data understate the creative destruction of high-tech companies for the list of compa-
nies at the top has changed. In recent years (2011 and 2012), just 4 of the top 10 owners of patents
granted those years were in the top 10 between 1976 and 1980: IBM, GE, GM, and ATT (counting Bell
Labs as the antecedent). Of the rest, Hewlett-Packard cracked the top 10 for the first time in 1992,
Microsoft and Intel in 1996, Cisco in 2006, Broadcom in 2009, and Apple not until 2010. In other
words, even while a few tech giants account for a large share of the nation’s patents, patent ownership
as a whole has become broader and more competitive with considerable churn both at the top and
throughout the distribution, including a massive increase in the number of firms with just one pat-
ent per year. In 1976, 2,677 companies or organizations (like universities or federal agencies) owned
exactly one patent granted that year; by 2011, that number had soared to 9,909.
   From 1980 to 2011, the average metropolitan area saw a 7 percentage point drop in the share of
newly granted patents held by the largest patent owner and a 2 percentage point drop in the share


BROOKINGS | February 2013                                                                                            11
Figure 4. Concentration of U.S. Patents Invented in Most Inventive Metro Areas
                       from 2000-2012 Relative to 2010 Population Shares

                                                  Share of U.S. Patents   Share of U.S. Population
                                 100%
                                                                                                      92%
                                            90%

                                            80%

                                            70%


                Metro Share of U.S. Total
                                                                                       63%
                                            60%
                                                                                                      59%
                                            50%                      46%

                                            40%
                                                   30%
                                            30%                                        34%

                                            20%
                                                                     20%
                                            10%    12%

                                            0%
                                                     5              10               20                100
                                                            Number of most inventive metro areas


 held by the top 5 assignees. Many high patenting metropolitan areas saw patents disperse widely
 across firms. In Indianapolis, for example, there was a 29 percentage point decrease from 1980
 to 2011 in the share of patents owned by the top 5; in Boulder, Colorado there was a 27 percentage
 point decrease; a 17 percentage point decrease in Austin, and an 8 percentage point decline for
 San Francisco. In general, the more patents in a region, the wider the dispersion across firms at any
 given time.
    To summarize this section, patent data implies that the rate of invention—at least of patentable
 inventions—is near historic highs, quality appears to be increasing and not as the result of changes
 in litigation practices, a few industries are responsible for most patenting activity, and competition
 between patent owners seems to have increased.
    Still, give the geographic concentration of industries and production, the gains from patenting may
 be similarly concentrated and of little benefit to large numbers of Americans. For all the dispersal of
 invention, relative to the hierarchical corporate labs of the 1970s, there remains a massively unequal
 distribution of patents across metropolitan areas. The next sections turn to the spatial geography of
 patenting and its effect on economic performance.

 Most U.S. patents—63 percent—are developed by people living in just 20 metro areas,
 which are home to 34 percent of the U.S. population
 Metropolitan areas play a critical role in setting the productivity of the U.S. economy.81 Large metros in
 particular account for a disproportionate share of GDP and educated workers, but they are especially
 crucial for patenting. The 100 largest metro areas are home to 65 percent of the U.S population in
 2010, but they are home to for 80 percent of all U.S. inventors of granted patents since 1976 and
 82 percent since 2005. Few patents are invented outside of metro areas. In fact, 93 percent of all U.S.
 patent inventors have lived in metro areas since 1976 (using the year of application).
   U.S. patented invention is highly concentrated in a relatively small number of cities and their sub-
 urbs, as Figure 1 reinforces. Indeed, just the five most patent intensive metro areas accounted for 30
 percent of all patents from U.S. inventors. The average resident in these five metro areas is 2.4 times


12                                                                                                   BROOKINGS | February 2013
Table 4. Total Granted Patents and Patenting Rate by Metropolitan Area of Inventor, 2007–2011
     	
    		                                           Average Granted Patents 	                             Patents per million 	                  Largest subcategory
	    	                                             per year, 2007-2011	                               residents, 2007-2011	                          of patents
    San Jose-Sunnyvale-Santa Clara, CA	                   9,237	                                              5,066	                      Computer Hardware  Peripherals
    San Francisco-Oakland-Fremont, CA	                    7,003	                                              1,638	                               Biotechnology
    New York-Northern New Jersey-Long Island, NY-NJ-PA	   6,907	                                                366	                             Communications
    Los Angeles-Long Beach-Santa Ana, CA	                 5,456	                                                424	                             Communications
    Seattle-Tacoma-Bellevue, WA	                          3,968	                                              1,174	                            Computer Software
    Boston-Cambridge-Quincy, MA-NH	                       3,965	                                                877	                               Biotechnology
    Chicago-Joliet-Naperville, IL-IN-WI	                  3,886	                                                409	                             Communications
    San Diego-Carlsbad-San Marcos, CA	                    3,165	                                              1,041	                             Communications
    Minneapolis-St. Paul-Bloomington, MN-WI	              3,068	                                                945	                       Surgery  Medical Instruments
    Detroit-Warren-Livonia, MI	                           2,720	                                                621	                               Transportation
    Austin-Round Rock-San Marcos, TX	                     2,497	                                              1,503	                      Computer Hardware  Peripherals
    Philadelphia-Camden-Wilmington, PA-NJ-DE-MD	          2,370	                                                402	                               Biotechnology
    Houston-Sugar Land-Baytown, TX	                       2,202	                                                379	                           Earth Working  Wells
    Dallas-Fort Worth-Arlington, TX	                      1,945	                                                310	                             Communications
    Portland-Vancouver-Hillsboro, OR-WA	                  1,844	                                                837	                      Computer Hardware  Peripherals
    Atlanta-Sandy Springs-Marietta, GA	                   1,506	                                                285	                             Communications
    Washington-Arlington-Alexandria, DC-VA-MD-WV	         1,479	                                                271	                             Communications
    Phoenix-Mesa-Glendale, AZ	                            1,437	                                                343	                          Semiconductor Devices
    Raleigh-Cary, NC	                                     1,273	                                              1,164	                      Computer Hardware  Peripherals
    Poughkeepsie-Newburgh-Middletown, NY	                 1,226	                                              1,829	                          Semiconductor Devices
    Average of all metropolitan areas	                       299	                                               296	


    Source: Brookings analysis of Strumsky Patent Database and American Community Survey. One patent is assigned to a metro area if at least one inventor lives there.
    Year refers to year of application, not grant. Since it takes a few years for an application to become granted, these patent totals are artificially low.


more likely to invent a patent than the average American. The 10 most inventive metro areas account
for nearly half of all patents, 46 percent, and the 100 most inventive metros account for 92 percent.
These metro areas contain a hugely disproportionate number of highly specialized researchers, engi-
neers, and entrepreneurs who are coming up with new technologies.
   This degree of concentration has not changed much since the 1980s, though two trends are worth
noting. The concentration of patents in the 100 most inventive metro areas has increased from 90
in the 1980s to 92 (since 2000), even as the share concentrated in the top five fell from 32 to 30. In
other words, invention is slightly more concentrated in large metro areas than it was three decades
ago, but the dominant regions have lost market share to other highly inventive areas.
   From 1980 to 2011, a few large metros notably changed their share of U.S patents.82 At the top, San
Jose moved up from ninth to first, and San Francisco moved from seventh to fourth, moving ahead of
Chicago, Philadelphia, Detroit, and Boston. Seattle and San Diego moved up 15 and nine places, respec-
tively, to become seventh and eighth. Meanwhile, Austin and Raleigh moved up 41 and 55 places,
respectively, to become 11th and 20th. Cleveland fell 10 slots from 13th to 23rd, while Philadelphia fell
from fourth to 13th.
   Although the high-patenting metro areas are all large, patenting per capita rates (a measure of the
inventive productivity of an area) vary widely. Table 4 lists the metro areas of any size with the high-
est number of granted patent over the five year period ending in 2011. In the last column, the largest
patenting subcategory is listed for each metro to provide a sense of the most prominent patenting
industries.
   With computer hardware and peripherals as the lead category, San Jose stands out with 9,237
patents per year, from 2007 to 2011. This is 2000 more patents than the next highest metro area—its
neighbor, San Francisco. Of the other large metros on the list, New York, Chicago, Washington D.C.,


BROOKINGS | February 2013                                                                                                                  13
Table 5. Total Granted Patents and Patenting Rate by Metropolitan Area of Inventor, 2007–2011
     	
    		                                  Patents per million residents, 	                 Average Granted Patents 	                  Largest subcategory
	     	                                          2007-2011	                                per year, 2007-2011	                           of patents
    San Jose-Sunnyvale-Santa Clara, CA	             5,066	                                        9,237	                        Computer Hardware  Peripherals
    Burlington-South Burlington, VT	                3,951	                                           826	                           Semiconductor Devices
    Rochester, MN	                                  3,300	                                           606	                       Computer Hardware  Peripherals
    Corvallis, OR	                                  2,319	                                           194	                           Semiconductor Devices
    Boulder, CO	                                    2,274	                                           666	                              Communications
    Poughkeepsie-Newburgh-Middletown, NY	           1,829	                                        1,226	                            Semiconductor Devices
    Ann Arbor, MI	                                  1,697	                                           590	                           Motors, Engines  Parts
    San Francisco-Oakland-Fremont, CA	              1,638	                                        7,003	                                 Biotechnology
    Austin-Round Rock-San Marcos, TX	               1,503	                                        2,497	                        Computer Hardware  Peripherals
    Santa Cruz-Watsonville, CA	                     1,204	                                           310	                       Computer Hardware  Peripherals
    Seattle-Tacoma-Bellevue, WA	                    1,174	                                        3,968	                              Computer Software
    Raleigh-Cary, NC	                               1,164	                                        1,273	                        Computer Hardware  Peripherals
    Rochester, NY	                                  1,149	                                        1,198	                                     Optics
    Durham-Chapel Hill, NC	                         1,120	                                           552	                                Biotechnology
    Trenton-Ewing, NJ	                              1,073	                                           393	                                Biotechnology
    Sheboygan, WI	                                  1,045	                                           120	                            Invalid USPTO Code
    San Diego-Carlsbad-San Marcos, CA	              1,041	                                        3,165	                               Communications
    Albany-Schenectady-Troy, NY	                      981	                                           846	                               Power Systems
    Ithaca, NY	                                       959	                                            97	                                Biotechnology
    Minneapolis-St. Paul-Bloomington, MN-WI	          945	                                        3,068	                         Surgery  Medical Instruments


    Source: Brookings analysis of Strumsky Patent Database and American Community Survey. One patent is assigned to a metro area if at least one inventor lives there.
    Year refers to year of application, not grant.


                                              Miami, and Atlanta have rather low patenting rates—less than 10 times the rate of invention in San
                                              Jose. On the other hand, San Francisco, Boston, Austin, Seattle, San Diego, Portland, Rochester, and
                                              Minneapolis are in an upper tier of large metros that produce patents at high volumes and rates.
                                                 Many of the metro areas just mentioned also develop patents at extraordinarily high rates, espe-
                                              cially San Jose; with over 5,000 patents per million residents in any given year from 2007 to 2011 it is
                                              the most inventive metro area by size and intensity. As Table 5 shows, highly inventive metro areas are
                                              scattered across each region of the country. In the Northeast there is Burlington, Vermont, one in New
                                              Jersey (Trenton in Mercer County, which includes Princeton), and three more in New York. The West
                                              is represented by 7 of the top 20 metro areas, including 4 in California, as well as Corvallis, Oregon,
                                              Seattle, and Boulder Colorado. The Midwest has four—with Rochester, Minnesota rating the highest—
                                              and the south three, with Austin, Texas and two in North Carolina.
                                                 The differences in patenting rates are truly large, when metro areas at the extremes are placed
                                              side by side. A resident living in one of the 100 most inventive metropolitan areas is seven times more
                                              likely to invent a patent than someone living in lower ranked metropolitan area. A resident of the San
                                              Jose metropolitan area is 600 times more likely to invent a patent than a resident of McAllen, Texas,
                                              160 times more likely than a resident of Johnstown, Pennsylvania, and 100 times more likely than resi-
                                              dents of Fresno, California or Lakeland-Winter Haven, Florida. Even compared to a high-patenting area
                                              like metropolitan Detroit, a San Jose resident is 8 times more likely to invent.

                                              Inventions, embodied in patents, are a major driver of long-term regional economic
                                              performance, especially if the patents are of higher quality.
                                              It is well documented that inventors and companies do not benefit from the full value of their prod-
                                              ucts.83 Much goes to consumers or society, in form of better health and higher quality, more affordable
                                              goods and services. Regions too are unlikely to capture the full benefits of ideas invented there that


                                         14                                                                                             BROOKINGS | February 2013
Figure 5. Average 10-Year Marginal Effect of Metro Area Patents and Other Variables on Total
       Metro Area Productivity Growth, with 95 Percent Confidence Intervals, 1980-2010


                                  14.0%


                                  12.0%
       Effect on GDP per Worker


                                  10.0%                                           10.2%

                                                                                                  8.8%
                                   8.0%


                                   6.0%


                                   4.0%

                                                2.7%              2.5%
                                   2.0%


                                   0.0%
                                          Patents      Bachelor's Degree     Sector       Population
                                                       Attainment Rate     Employment


eventually become commercialized, traded, implemented, and perhaps even copied. With this in mind,
the question arises: Do regions benefit from having many inventors?
   To answer this question, regression analysis was used to assess the relationship between patents
and productivity growth—measured as GDP per worker—from 1980 to 2010 for every metropolitan area
in the United States (with available data that came to 358). Since many other factors affect productiv-
ity but might be correlated with patenting, the analysis controls for the share of college graduates
living in the metro area, population size, industry concentration, housing prices, and constant met-
ropolitan specific characteristics (which would include geographic advantages, history, and political
institutions). The econometric details are shown in the appendix
   The results clearly show that patenting is associated with higher metropolitan area productivity. The
analysis cannot rule out that the link is caused by some missing variable or reverse causality, but given
the control variables and the fact that patents were lagged ten years in the analysis, the most likely
explanation is that patents cause growth. In order to translate the evidence into concrete terms, one
can group metropolitan areas into quartiles of patenting, with the most inventive metros (by number
of patents) in the top quartile.
   If the metro areas in the lowest quartile, patented as much as those in the top quartile, they would
boost their economic growth by 6.5 percent over a ten year period. By comparison, the average metro
area in this bottom quartile grew by 13 percent each decade over this period, so an extra 6.5 percent
would be a large boost, representing an extra $4,300 per worker (adjusted for inflation). That would
require, roughly, an extra 960 patents per year. Though not without difficulty, such figures could be
generated by a few large corporate RD offices or universities.
   The other notable finding is that patents compare rather well to other growth-enhancing factors,
like human capital. First of all, five variables analyzed in this analysis are all statistically significant and
economically meaningful. With that said, the patenting effect is somewhat larger than the effect from
bachelor’s degree attainment. A one standard deviation of growth in the number of patents (or, more
precisely, the natural log of patents) granted to metro area inventors is associated with a 2.7 percent
increase in economic growth—measured as output per worker. That compares to 2.5 percent for a one


BROOKINGS | February 2013                                                                                      15
Figure 6. Average 10-Year Marginal Effect of Metro Area Claims and Other Variables on Total
           Metro Area Productivity Growth, with 95 Percent Confidence Intervals, 1980-2010


                                      14.0%

                                      12.0%


           Effect on GDP per Worker
                                      10.0%                                         10.2%

                                       8.0%

                                       6.0%                                                        6.4%

                                       4.0%
                                                       3.5%
                                       2.0%                           1.9%                                         2.3%

                                       0.0%

                                      -2.0%
                                              Patent Claims    Bachelor's      Sector       Population    Tech Industry
                                                                Degree       Employment                    Employment
                                                              Attainment
                                                                Rate


     standard deviation increase in the bachelor’s degree attainment rate and slightly less for the sector
     employment effect.
        The patenting effect is important, but it is smaller than the effects from population size and sector
     employment concentrations. The sector effect is the largest. The interpretation is intuitive: Where
     employment is concentrated in high-productivity industries (e.g. energy, utilities, finance, information,
     and professional services), metropolitan area output per worker is consistently higher. Where it is in
     low-productivity sectors---like health care, leisure and hospitality (tourism), education, restaurants,
     and agriculture—metro area productivity is low.
        Population also has a large effect on productivity. This is the well documented phenomena that
     firms are more productive when they exist in clusters of related businesses and in large urban areas.84

     Patenting Quality
     Patent claims have a larger effect on metropolitan productivity than patents themselves. This makes
     sense if one considers that a patent with many claims is akin to multiple patents with few claims. In
     fact, after accounting for the number of claims, patents do not add value to a metropolitan economy.
        To test the strength of these conclusions, the analysis also considered the effects of employment in
     tech industries, which are high-patent industries. The motivation for this is that tech sector workers
     and their companies may have other characteristics—besides high patenting rates—that are associated
     with productivity (e.g. higher education levels, export orientation, and wages).85
        The effects of patent claims are compared to other variables, as was done above with patents, in
     Figure 7, shown above. Patent claims are highly significant and strongly associated with productivity
     growth. Industrial sector and population effects are larger, though the effects of population and pat-
     ent claims overlap, so one cannot be sure that they differ. Meanwhile, bachelor’s degree attainment
     is now marginally insignificant, as is tech-sector employment. They are highly correlated, and further
     analysis shows that their combined effect is highly significant.86

     Metropolitan Level Trends in Productivity
     The aggregate results reported above become more concrete when looking at specific metropolitan
     areas. Table 6 lists the large metropolitan areas with the largest increase in patents per worker from
     1980 to 2010, along with their performance on productivity growth, the change in the bachelor degree


16                                                                                                  BROOKINGS | February 2013
Figure 7. Average Unemployment Rates of Metropolitan Areas with Above and Below
                         Average Growth in Patents from 1990 to 2010

                                     7.0
                                                 6.4

                                     6.0
                                                                 5.3
         Average Unemployment Rate


                                     5.0


                                     4.0
                                                                             Average Unemployment
                                                                             Rate, 1990-2010
                                     3.0


                                     2.0


                                     1.0


                                     0.0                    Above average
                                           Below average
                                           patent growth,   patent growth,
                                             1990-2010        1990-2010


attainment rate, and growth in predicted productivity (based on how national trends in sector produc-
tivity would be expected to affect metro areas, given their sector mix).
   San Jose, again, tops the list, with an increase of 13,206 patents per million workers from the 1980
to 2010. Stated otherwise, the probability that a given worker in San Jose invented a patent increased
by 1.3 percentage points—and the increase will be even higher as pending patents become granted in
the next few years. As it happens, San Jose also experienced the highest productivity growth, and
much of that growth cannot be explained by its re-orientation towards more productive economic sec-
tors, as a comparison between the second and the third columns suggests.
   Patenting is correlated with productivity growth: 14 of the 20 metro areas with the largest increase
in patents per worker from 1980 to 2010 (out of the 358 with complete data) experienced above
average productivity growth. Indeed, in addition to San Jose, four of those other metro areas are also
ranked in the top 20 on productivity growth: Corvallis, OR; Boulder, CO; Raleigh, NC; and Portland, OR.
In each case, sector re-orientation towards higher-productivity industries would predict lower growth
rates than they actually experienced, suggesting that other factors were at work. In addition to explo-
sive patent growth, Raleigh and Boulder had rapid increases in human capital, measured by the share
of adults aged 25 and older with a bachelor’s degree or higher, but this was not the case in Corvallis
and Portland, where the increase in bachelor degree attainment shares was below average.
   For the six metro areas with a large patent increase but low productivity growth, five of them shifted
employment towards low productivity but stable economic sectors like education and health care (e.g.
in Provo, home to BYU, 22 percent of workers were employed in education and health care, compared
to 14 percentage nationally). The other—Racine, Wisconsin—suffered from stagnant population growth
and a meager increase in the bachelor’s degree attainment rate.
   The same relationship between patents and productivity changes can be drawn by examining met-
ropolitan areas with that developed fewer patents per worker over the three decades. Rust belt metro
areas with low productivity growth—like Pittsburgh, Toledo, and Buffalo—actually saw a decrease in the
number of patents per worker. This is also true of Tulsa, Oklahoma, Louisville, and Baton Rouge, all


BROOKINGS | February 2013                                                                               17
Table 6. Productivity Growth in the 20 Metropolitan Areas with the Largest Increase in Patents per Worker, 1980–2010
        	
    	                                       Change in patents 	                   Annual Productivity	           Predicted Productivity	          Change in Bachelors
	                                          per million workers, 	                      Growth,	                          Growth,	                 Degree Attainment
	                                              1980-2010	                            1980-2010	                        1980-2010	                     1980-2010
    San Jose-Sunnyvale-Santa Clara, CA	          13,206	                                 3.3%	                            2.2%	                         18.4%
    Burlington-South Burlington, VT	              8,355	                                 2.1%	                            1.7%	                         16.6%
    Corvallis, OR	                                6,644	                                 2.6%	                            1.1%	                         11.3%
    Winchester, VA-WV	                            6,633	                                 1.6%	                            1.6%	                         10.5%
    Rochester, MN	                                6,536	                                 1.6%	                            0.9%	                         14.0%
    Charlottesville, VA	                          4,491	                                 1.4%	                            1.4%	                         15.1%
    Poughkeepsie-Newburgh-Middletown, NY	         4,219	                                 1.8%	                            1.4%	                         12.7%
    San Francisco-Oakland-Fremont, CA	            4,059	                                 1.9%	                            1.2%	                         17.5%
    Blacksburg-Christiansburg-Radford, VA	        3,709	                                 1.3%	                            1.2%	                         11.5%
    Austin-Round Rock-San Marcos, TX	             3,591	                                 1.9%	                            1.3%	                         12.8%
    Santa Cruz-Watsonville, CA	                   3,547	                                 1.7%	                            1.1%	                         13.7%
    Boulder, CO	                                  3,182	                                 2.3%	                            1.8%	                         20.6%
    Seattle-Tacoma-Bellevue, WA	                  2,957	                                 1.3%	                            1.5%	                         14.8%
    Raleigh-Cary, NC	                             2,848	                                 2.3%	                            1.9%	                         19.8%
    Ann Arbor, MI	                                2,602	                                 1.1%	                            1.5%	                         14.7%
    San Diego-Carlsbad-San Marcos, CA	            2,357	                                 2.2%	                            1.3%	                         13.1%
    Durham-Chapel Hill, NC	                       2,212	                                 1.9%	                            1.5%	                         17.8%
    Provo-Orem, UT	                               2,062	                                 0.5%	                            1.3%	                         12.0%
    Portland-Vancouver-Hillsboro, OR-WA	          2,056	                                 2.5%	                            1.3%	                         13.9%
    Racine, WI	                                   2,046	                                 1.0%	                            1.8%	                           9.0%
    Average for top 20 metros	                    4,366	                                1.8%	                             1.5%	                         14.5%
    Average of all metro areas	                      395	                               1.4%	                             1.4%	                           9.7%


    Source: Brookings analysis of Strumsky database, U.S. Census Bureau, and Moody’s Analytics. Patent totals for 1980 and 2010 are based on five year moving averages
    that end in those years, since patent data fluctuates from year to year. Figures are based on application year of patents already granted. Predicted industry productiv-
    ity multiplies metro area employment shares by sector by national productivity for each sector. The growth rate is calculated using 1980 and 2010 measures.


                                            three of which had very slow productivity growth.
                                              On the other hand, a metropolitan area like Detroit does not fit the model in any simple way. It
                                            ranked 37th on the increase in patents per worker, but 306th in productivity growth, 185th on pre-
                                            dicted productivity growth, 248th on tech sector job growth, and 316th on population growth. Here,
                                            the outsourcing of production to the U.S. South and other countries is likely a major factor. The case
                                            of Detroit serves as a warning that patenting alone will not guarantee prosperity; rather it must be
                                            combined with other pro-growth attributes that Detroit evidently has been lacking.

                                            Invention and Unemployment in Metropolitan Areas
                                            While granting that patents add value to a regional economy, some may be concerned about how
                                            technology-led productivity growth affects labor demand, since new technologies require few work-
                                            ers.87 On the other hand, more productive metro areas have more money available to spend on local
                                            services, which should boost job creation.
                                               This analysis finds that patent growth is strongly correlated with better employment opportuni-
                                            ties. From 1990 to 2010, metro areas with faster growth in patenting had significantly lower average
                                            unemployment rates during those two decades. The analysis, which is summarized in Figure 8, was
                                            conducted using all metro areas and controlling for changes in college educational attainment rates,
                                            population growth, housing price growth, tech sector growth, and predicted industry growth. (The
                                            results are shown in more detail in Appendix Table 2). Focusing on just the 100 largest metro areas for
                                            ease of comparison, lists those with the highest and lowest patent growth rates.


                                       18                                                                                                   BROOKINGS | February 2013
Table 7. Average Unemployment Rates from 1990 to 2010 and Patent Growth in the 100 Largest Metro Areas
    	
	                                       Unemployment	            Patent Growth,	            Change in share of	                                 Job growth,
	                                        Rate, average	           annual average	        population with Bachelor’s	                           annual average
	                                         1990-2010	                1990-2010	             or higher, 1990-2010	                                 1990-2010
                                        Metro Areas with the highest growth in patents from 1990 to 2010
    Boise City-Nampa, ID	                     4.6	                    11.90%	                      8.40%	                                           2.90%
    Provo-Orem, UT	                           4.1	                     8.90%	                      9.20%	                                           2.90%
    Seattle-Tacoma-Bellevue, WA	              5.5	                     8.90%	                     10.00%	                                           1.20%
    Raleigh-Cary, NC	                           4	                     8.80%	                     11.40%	                                           2.60%
    San Jose-Sunnyvale-Santa Clara, CA	       5.9	                     8.10%	                     12.40%	                                           0.20%
    Austin-Round Rock-San Marcos, TX	         4.3	                     8.10%	                      8.70%	                                           3.40%
    Las Vegas-Paradise, NV	                     6	                     7.20%	                      7.90%	                                           3.80%
    San Francisco-Oakland-Fremont, CA	        5.4	                     7.00%	                     11.50%	                                           0.20%
    Poughkeepsie-Newburgh-Middletown, NY	     4.9	                     6.60%	                      7.70%	                                           0.40%
    Tucson, AZ	                               4.7	                     6.50%	                      6.30%	                                           1.70%
    Average for high growth metro areas	      4.9	                     8.20%	                      9.30%	                                           1.90%
                                        Metro Areas with the lowest growth in patents from 1990 to 2010
    Lakeland-Winter Haven, FL	                7.1	                    -1.10%	                      5.10%	                                           1.10%
    Pittsburgh, PA	                           5.6	                    -1.10%	                     10.10%	                                           0.30%
    Buffalo-Niagara Falls, NY	                5.9	                    -1.20%	                      8.50%	                                          -0.10%
    Toledo, OH	                               6.8	                    -1.30%	                      6.10%	                                          -0.20%
    El Paso, TX	                              9.2	                    -1.40%	                      4.10%	                                           1.40%
    Dayton, OH	                               5.7	                    -1.60%	                      5.30%	                                          -0.60%
    Tulsa, OK	                                4.8	                    -1.70%	                      5.30%	                                           1.10%
    Chattanooga, TN-GA	                       5.1	                    -2.10%	                      6.90%	                                           0.60%
    New Orleans-Metairie-Kenner, LA	          6.1	                    -2.50%	                      6.40%	                                          -0.20%
    Baton Rouge, LA	                          5.4	                    -5.30%	                      5.20%	                                           1.60%
    Average for low growth metro areas	       6.2	                    -1.90%	                      6.30%	                                           0.50%
    Average for all large metro areas	        5.7	                     2.30%	                      7.90%	                                           1.00%


    Source: Brookings analysis of Moody’s Analytic, Bureau of Labor Statistics, Census Bureau Decennial Census, and Strumsky Patent Database. One patent is assigned
    to metro area if at least one inventor lives there.		


   Metro areas with the fastest growth in patenting tend to have lower unemployment during the
period. Boise, Provo, Raleigh, Austin, Poughkeepsie, and Tucson all had high patenting growth and
average unemployment rates below five percent; the average for the ten fastest growing metro areas
was 4.9 percent. By contrast, large metros with slow patenting growth had an average unemployment
rate of 6.2 percent. Places like Buffalo and Dayton represent once strong manufacturing hubs that lost
their inventive momentum.
   Patenting growth is also correlated with job growth, population growth, and increases in educa-
tional attainment rates. Yet, closer analysis reveals that education is more important to metro area
job growth than patenting, which becomes insignificant. One explanation is that patenting growth only
leads to job growth if it draws highly educated workers to the metropolitan area.
   Overall, the evidence here is that patenting is good for metro area labor markets. The higher pro-
ductivity does not seem to come at the expense of workers. Long-run unemployment rates are lower
in metro areas with faster patent growth, meaning that opportunities for workers are more prevalent.
Net job creation also tends to be higher in metros with higher patenting growth, but this effect is the
result of growth in educational attainment.

Invention and the Creation of Public Companies
During the painfully slow recovery from the Great Recession, many have wondered whether America’s


BROOKINGS | February 2013                                                                                                        19
entrepreneurial vigor has been sapped.88 If patents are associated with the creation of new products
 and economic value, they may also help create new companies. That is, in fact, what the data suggest.
    The effect of patenting on high-technology start-ups can be gleaned by examining the value of
 Initial Public Offerings (IPOs) occurring in metropolitan areas which have high patenting intensity.
 IPOs have come to be associated with high-technology start-ups, and are used by companies to raise
 money for expansion and monetize earlier investments.89 A new database by innovation scholars has
 identified every tech-sector IPO from 1996 to 2006.90 For this study, the IPO data were matched to
 metropolitan areas using the zip codes of the companies’ headquarters. As many as 112 of 358 metro-
 politan areas were home to at least one company that went public between 2000 and 2006.
    The figure below compares the average per capita value of IPOs, over the 2000 to 2006 period, for
 metropolitan areas with above and below average patents per capita over the preceding 1996–2000
 period to allow time for patents to have an effect. Without inferring causality, those metropolitan
 areas with higher patent intensity witnessed IPO activity worth more than five times the per capita
 value. As the appendix discusses, the significant relationship remains after controlling for tech-sector
 employment shares, population, educational attainment, and output per worker.
    Looking at either the value or number of IPOs across metropolitan areas, it is clear that patenting
 activity is highly correlated. Metro areas that patent more generate far more IPOs than those that do
 not. Table 8 sorts metros areas by those with the most value from IPOs from 2000 to 2006. Large
 patenting metros like San Jose, San Francisco, and Boston dominate the top five. Baltimore and Las
 Vegas are the only outliers in the top ten with few patents. Other metro areas with high patenting
 rates like San Diego, Seattle, and Austin also make the list.

 Research universities, a scientifically-educated workforce, and collaboration play an
 important role in driving metropolitan innovation.
 The evidence presented above is clear that patenting is strongly associated with national and regional
 economic performance. With so much at stake, it is worth analyzing why some metro areas patent so
 much more than others, and how others might boost invention. Four factors emerge as particularly


           Figure 8. Average IPO Value per Capita for Metropolitan Areas with Above and Below
                                      Average Patents per Capita.

                                   $2,500
                                                    $2,278


                                   $2,000
       Average Unemployment Rate


                                   $1,500
                                                                                                  Average per
                                                                                                  capita value of
                                   $1,000                                                         IPOs in metro area,
                                                                                                  2000-2006

                                                                                $446
                                    $500


                                      $0
                                            Metro areas with above    Metro areas with below
                                            average patenting rate,   average patenting rate,
                                                  1996–2000                 1996–2000


20                                                                                              BROOKINGS | February 2013
Patenting Prosperity: Invention and Economic Performance in the United States and its Metropolitan Areas

Weitere ähnliche Inhalte

Andere mochten auch

Transportation and the New Generation: Why Young People are Driving Less and...
 Transportation and the New Generation: Why Young People are Driving Less and... Transportation and the New Generation: Why Young People are Driving Less and...
Transportation and the New Generation: Why Young People are Driving Less and...Jesse Budlong
 
City-Level Decoupling
City-Level DecouplingCity-Level Decoupling
City-Level DecouplingJesse Budlong
 
Greenprint Midtown: Sustainability Plan 2012
Greenprint Midtown: Sustainability Plan 2012Greenprint Midtown: Sustainability Plan 2012
Greenprint Midtown: Sustainability Plan 2012Jesse Budlong
 
An Urban Intervention for East Garfield Park (UPP 460 Spring 2011)
An Urban Intervention for East Garfield Park (UPP 460 Spring 2011)An Urban Intervention for East Garfield Park (UPP 460 Spring 2011)
An Urban Intervention for East Garfield Park (UPP 460 Spring 2011)Jesse Budlong
 
Second Revision Syria Regional Response Plan
Second Revision Syria Regional Response PlanSecond Revision Syria Regional Response Plan
Second Revision Syria Regional Response PlanJesse Budlong
 
The WalkUP Wake-Up Call: Atlanta The Poster Child of Sprawl Builds a Walkable...
The WalkUP Wake-Up Call: Atlanta The Poster Child of Sprawl Builds a Walkable...The WalkUP Wake-Up Call: Atlanta The Poster Child of Sprawl Builds a Walkable...
The WalkUP Wake-Up Call: Atlanta The Poster Child of Sprawl Builds a Walkable...Jesse Budlong
 
Infrastructure Financing Options for Transit-Oriented Development
Infrastructure Financing Options for Transit-Oriented DevelopmentInfrastructure Financing Options for Transit-Oriented Development
Infrastructure Financing Options for Transit-Oriented DevelopmentJesse Budlong
 

Andere mochten auch (7)

Transportation and the New Generation: Why Young People are Driving Less and...
 Transportation and the New Generation: Why Young People are Driving Less and... Transportation and the New Generation: Why Young People are Driving Less and...
Transportation and the New Generation: Why Young People are Driving Less and...
 
City-Level Decoupling
City-Level DecouplingCity-Level Decoupling
City-Level Decoupling
 
Greenprint Midtown: Sustainability Plan 2012
Greenprint Midtown: Sustainability Plan 2012Greenprint Midtown: Sustainability Plan 2012
Greenprint Midtown: Sustainability Plan 2012
 
An Urban Intervention for East Garfield Park (UPP 460 Spring 2011)
An Urban Intervention for East Garfield Park (UPP 460 Spring 2011)An Urban Intervention for East Garfield Park (UPP 460 Spring 2011)
An Urban Intervention for East Garfield Park (UPP 460 Spring 2011)
 
Second Revision Syria Regional Response Plan
Second Revision Syria Regional Response PlanSecond Revision Syria Regional Response Plan
Second Revision Syria Regional Response Plan
 
The WalkUP Wake-Up Call: Atlanta The Poster Child of Sprawl Builds a Walkable...
The WalkUP Wake-Up Call: Atlanta The Poster Child of Sprawl Builds a Walkable...The WalkUP Wake-Up Call: Atlanta The Poster Child of Sprawl Builds a Walkable...
The WalkUP Wake-Up Call: Atlanta The Poster Child of Sprawl Builds a Walkable...
 
Infrastructure Financing Options for Transit-Oriented Development
Infrastructure Financing Options for Transit-Oriented DevelopmentInfrastructure Financing Options for Transit-Oriented Development
Infrastructure Financing Options for Transit-Oriented Development
 

Ähnlich wie Patenting Prosperity: Invention and Economic Performance in the United States and its Metropolitan Areas

What's behind technological hype
What's behind technological hypeWhat's behind technological hype
What's behind technological hypeJeffrey Funk
 
State of innovation Thomson Reuters 2016
State of innovation Thomson Reuters 2016 State of innovation Thomson Reuters 2016
State of innovation Thomson Reuters 2016 Dmitry Tseitlin
 
2016 - Disruptive, Game Changing Innovation - SOI Report (5.11.16)
2016 - Disruptive, Game Changing Innovation - SOI Report (5.11.16)2016 - Disruptive, Game Changing Innovation - SOI Report (5.11.16)
2016 - Disruptive, Game Changing Innovation - SOI Report (5.11.16)Bill Harrington
 
VCs Identify Pockets of Innovation Around the Globe
VCs Identify Pockets of Innovation Around the GlobeVCs Identify Pockets of Innovation Around the Globe
VCs Identify Pockets of Innovation Around the Globemensa25
 
Network Based Private Equity Investment
Network Based Private Equity InvestmentNetwork Based Private Equity Investment
Network Based Private Equity InvestmentJose Acosta
 
06.28.2010 - Innovation Climate (to NSA)
06.28.2010 - Innovation Climate (to NSA)06.28.2010 - Innovation Climate (to NSA)
06.28.2010 - Innovation Climate (to NSA)Lisa Currin Fogarty
 
A Strategy for American Innovation - Introduction
A Strategy for American Innovation - IntroductionA Strategy for American Innovation - Introduction
A Strategy for American Innovation - IntroductionObama White House
 
Investment Grade Asset_V6
Investment Grade Asset_V6Investment Grade Asset_V6
Investment Grade Asset_V6Paul Morinville
 
Trump Tariffs Primarily Hit Multinational Supply Chains, Harm US Technology C...
Trump Tariffs Primarily Hit Multinational Supply Chains, Harm US Technology C...Trump Tariffs Primarily Hit Multinational Supply Chains, Harm US Technology C...
Trump Tariffs Primarily Hit Multinational Supply Chains, Harm US Technology C...DESMOND YUEN
 
Rebuilding American Manufacturing Powerhouse | Sridhar Kota
Rebuilding American Manufacturing Powerhouse | Sridhar KotaRebuilding American Manufacturing Powerhouse | Sridhar Kota
Rebuilding American Manufacturing Powerhouse | Sridhar Kotacoldcrease3412
 
Analyzing Patent Information on Canning Technology for Food to Enhance Potent...
Analyzing Patent Information on Canning Technology for Food to Enhance Potent...Analyzing Patent Information on Canning Technology for Food to Enhance Potent...
Analyzing Patent Information on Canning Technology for Food to Enhance Potent...Yolanda Ivey
 
FUTURISTIC TECHNOLOGIES
FUTURISTIC TECHNOLOGIESFUTURISTIC TECHNOLOGIES
FUTURISTIC TECHNOLOGIESChuck Brooks
 
010-25 years of bayh-dole
010-25 years of bayh-dole010-25 years of bayh-dole
010-25 years of bayh-doleguest66dc5f
 
Intermediaries Article
Intermediaries ArticleIntermediaries Article
Intermediaries ArticleAccelerateH2O
 

Ähnlich wie Patenting Prosperity: Invention and Economic Performance in the United States and its Metropolitan Areas (20)

What's behind technological hype
What's behind technological hypeWhat's behind technological hype
What's behind technological hype
 
State of innovation Thomson Reuters 2016
State of innovation Thomson Reuters 2016 State of innovation Thomson Reuters 2016
State of innovation Thomson Reuters 2016
 
2016 - Disruptive, Game Changing Innovation - SOI Report (5.11.16)
2016 - Disruptive, Game Changing Innovation - SOI Report (5.11.16)2016 - Disruptive, Game Changing Innovation - SOI Report (5.11.16)
2016 - Disruptive, Game Changing Innovation - SOI Report (5.11.16)
 
VCs Identify Pockets of Innovation Around the Globe
VCs Identify Pockets of Innovation Around the GlobeVCs Identify Pockets of Innovation Around the Globe
VCs Identify Pockets of Innovation Around the Globe
 
Network Based Private Equity Investment
Network Based Private Equity InvestmentNetwork Based Private Equity Investment
Network Based Private Equity Investment
 
06.28.2010 - Innovation Climate (to NSA)
06.28.2010 - Innovation Climate (to NSA)06.28.2010 - Innovation Climate (to NSA)
06.28.2010 - Innovation Climate (to NSA)
 
Top 100-global-innovators-2014
Top 100-global-innovators-2014Top 100-global-innovators-2014
Top 100-global-innovators-2014
 
A Strategy for American Innovation - Introduction
A Strategy for American Innovation - IntroductionA Strategy for American Innovation - Introduction
A Strategy for American Innovation - Introduction
 
Sub1598
Sub1598Sub1598
Sub1598
 
Powering Advanced Industries: State by State
Powering Advanced Industries: State by StatePowering Advanced Industries: State by State
Powering Advanced Industries: State by State
 
Investment Grade Asset_V6
Investment Grade Asset_V6Investment Grade Asset_V6
Investment Grade Asset_V6
 
DCE5
DCE5DCE5
DCE5
 
Trump Tariffs Primarily Hit Multinational Supply Chains, Harm US Technology C...
Trump Tariffs Primarily Hit Multinational Supply Chains, Harm US Technology C...Trump Tariffs Primarily Hit Multinational Supply Chains, Harm US Technology C...
Trump Tariffs Primarily Hit Multinational Supply Chains, Harm US Technology C...
 
Rebuilding American Manufacturing Powerhouse | Sridhar Kota
Rebuilding American Manufacturing Powerhouse | Sridhar KotaRebuilding American Manufacturing Powerhouse | Sridhar Kota
Rebuilding American Manufacturing Powerhouse | Sridhar Kota
 
The learning society
The learning societyThe learning society
The learning society
 
Ten Trends To Watch
Ten Trends To WatchTen Trends To Watch
Ten Trends To Watch
 
Analyzing Patent Information on Canning Technology for Food to Enhance Potent...
Analyzing Patent Information on Canning Technology for Food to Enhance Potent...Analyzing Patent Information on Canning Technology for Food to Enhance Potent...
Analyzing Patent Information on Canning Technology for Food to Enhance Potent...
 
FUTURISTIC TECHNOLOGIES
FUTURISTIC TECHNOLOGIESFUTURISTIC TECHNOLOGIES
FUTURISTIC TECHNOLOGIES
 
010-25 years of bayh-dole
010-25 years of bayh-dole010-25 years of bayh-dole
010-25 years of bayh-dole
 
Intermediaries Article
Intermediaries ArticleIntermediaries Article
Intermediaries Article
 

Mehr von Jesse Budlong

Emory NRSG 537 - Student Notes (2012)
Emory NRSG 537 - Student Notes (2012)Emory NRSG 537 - Student Notes (2012)
Emory NRSG 537 - Student Notes (2012)Jesse Budlong
 
Debt, Deficits, and Demographics: Why We Can Afford the Social Contract
Debt, Deficits, and Demographics: Why We Can Afford the Social ContractDebt, Deficits, and Demographics: Why We Can Afford the Social Contract
Debt, Deficits, and Demographics: Why We Can Afford the Social ContractJesse Budlong
 
NACTO Urban Street Design Guide
NACTO Urban Street Design GuideNACTO Urban Street Design Guide
NACTO Urban Street Design GuideJesse Budlong
 
Placemaking and the Future of Cities
Placemaking and the Future of CitiesPlacemaking and the Future of Cities
Placemaking and the Future of CitiesJesse Budlong
 
Amendment 64 would produce $60 million in new revenue and savings for Colorado
Amendment 64 would produce $60 million in new  revenue and savings for ColoradoAmendment 64 would produce $60 million in new  revenue and savings for Colorado
Amendment 64 would produce $60 million in new revenue and savings for ColoradoJesse Budlong
 
Climate Change in the American Mind: Americans’ Global Warming Beliefs and A...
Climate Change in the American Mind:  Americans’ Global Warming Beliefs and A...Climate Change in the American Mind:  Americans’ Global Warming Beliefs and A...
Climate Change in the American Mind: Americans’ Global Warming Beliefs and A...Jesse Budlong
 
Walk this Way: The Economic Promise of Walkable Places in Metropolitan Wash...
Walk this Way:  The Economic Promise of Walkable  Places in Metropolitan Wash...Walk this Way:  The Economic Promise of Walkable  Places in Metropolitan Wash...
Walk this Way: The Economic Promise of Walkable Places in Metropolitan Wash...Jesse Budlong
 
Mastering the Metro: How Metro Regions Can Win Friends and Influence Economies
Mastering the Metro: How Metro Regions Can Win Friends and Influence EconomiesMastering the Metro: How Metro Regions Can Win Friends and Influence Economies
Mastering the Metro: How Metro Regions Can Win Friends and Influence EconomiesJesse Budlong
 
Next steps in obesity Prevention: Altering early life systems to support he...
Next steps in obesity Prevention:  Altering early life systems to support  he...Next steps in obesity Prevention:  Altering early life systems to support  he...
Next steps in obesity Prevention: Altering early life systems to support he...Jesse Budlong
 
Digital Media in the Arab World One Year After the Revolutions
Digital Media in the Arab World One Year After the RevolutionsDigital Media in the Arab World One Year After the Revolutions
Digital Media in the Arab World One Year After the RevolutionsJesse Budlong
 

Mehr von Jesse Budlong (11)

Emory NRSG 537 - Student Notes (2012)
Emory NRSG 537 - Student Notes (2012)Emory NRSG 537 - Student Notes (2012)
Emory NRSG 537 - Student Notes (2012)
 
Debt, Deficits, and Demographics: Why We Can Afford the Social Contract
Debt, Deficits, and Demographics: Why We Can Afford the Social ContractDebt, Deficits, and Demographics: Why We Can Afford the Social Contract
Debt, Deficits, and Demographics: Why We Can Afford the Social Contract
 
NACTO Urban Street Design Guide
NACTO Urban Street Design GuideNACTO Urban Street Design Guide
NACTO Urban Street Design Guide
 
Placemaking and the Future of Cities
Placemaking and the Future of CitiesPlacemaking and the Future of Cities
Placemaking and the Future of Cities
 
Amendment 64 would produce $60 million in new revenue and savings for Colorado
Amendment 64 would produce $60 million in new  revenue and savings for ColoradoAmendment 64 would produce $60 million in new  revenue and savings for Colorado
Amendment 64 would produce $60 million in new revenue and savings for Colorado
 
Cities outlook 1901
Cities outlook 1901Cities outlook 1901
Cities outlook 1901
 
Climate Change in the American Mind: Americans’ Global Warming Beliefs and A...
Climate Change in the American Mind:  Americans’ Global Warming Beliefs and A...Climate Change in the American Mind:  Americans’ Global Warming Beliefs and A...
Climate Change in the American Mind: Americans’ Global Warming Beliefs and A...
 
Walk this Way: The Economic Promise of Walkable Places in Metropolitan Wash...
Walk this Way:  The Economic Promise of Walkable  Places in Metropolitan Wash...Walk this Way:  The Economic Promise of Walkable  Places in Metropolitan Wash...
Walk this Way: The Economic Promise of Walkable Places in Metropolitan Wash...
 
Mastering the Metro: How Metro Regions Can Win Friends and Influence Economies
Mastering the Metro: How Metro Regions Can Win Friends and Influence EconomiesMastering the Metro: How Metro Regions Can Win Friends and Influence Economies
Mastering the Metro: How Metro Regions Can Win Friends and Influence Economies
 
Next steps in obesity Prevention: Altering early life systems to support he...
Next steps in obesity Prevention:  Altering early life systems to support  he...Next steps in obesity Prevention:  Altering early life systems to support  he...
Next steps in obesity Prevention: Altering early life systems to support he...
 
Digital Media in the Arab World One Year After the Revolutions
Digital Media in the Arab World One Year After the RevolutionsDigital Media in the Arab World One Year After the Revolutions
Digital Media in the Arab World One Year After the Revolutions
 

Kürzlich hochgeladen

How Europe Underdeveloped Africa_walter.pdf
How Europe Underdeveloped Africa_walter.pdfHow Europe Underdeveloped Africa_walter.pdf
How Europe Underdeveloped Africa_walter.pdfLorenzo Lemes
 
Nurturing Families, Empowering Lives: TDP's Vision for Family Welfare in Andh...
Nurturing Families, Empowering Lives: TDP's Vision for Family Welfare in Andh...Nurturing Families, Empowering Lives: TDP's Vision for Family Welfare in Andh...
Nurturing Families, Empowering Lives: TDP's Vision for Family Welfare in Andh...narsireddynannuri1
 
Julius Randle's Injury Status: Surgery Not Off the Table
Julius Randle's Injury Status: Surgery Not Off the TableJulius Randle's Injury Status: Surgery Not Off the Table
Julius Randle's Injury Status: Surgery Not Off the Tableget joys
 
Enjoy Night⚡Call Girls Rajokri Delhi >༒8448380779 Escort Service
Enjoy Night⚡Call Girls Rajokri Delhi >༒8448380779 Escort ServiceEnjoy Night⚡Call Girls Rajokri Delhi >༒8448380779 Escort Service
Enjoy Night⚡Call Girls Rajokri Delhi >༒8448380779 Escort ServiceDelhi Call girls
 
Enjoy Night⚡Call Girls Iffco Chowk Gurgaon >༒8448380779 Escort Service
Enjoy Night⚡Call Girls Iffco Chowk Gurgaon >༒8448380779 Escort ServiceEnjoy Night⚡Call Girls Iffco Chowk Gurgaon >༒8448380779 Escort Service
Enjoy Night⚡Call Girls Iffco Chowk Gurgaon >༒8448380779 Escort ServiceDelhi Call girls
 
Gujarat-SEBCs.pdf pfpkoopapriorjfperjreie
Gujarat-SEBCs.pdf pfpkoopapriorjfperjreieGujarat-SEBCs.pdf pfpkoopapriorjfperjreie
Gujarat-SEBCs.pdf pfpkoopapriorjfperjreiebhavenpr
 
AI as Research Assistant: Upscaling Content Analysis to Identify Patterns of ...
AI as Research Assistant: Upscaling Content Analysis to Identify Patterns of ...AI as Research Assistant: Upscaling Content Analysis to Identify Patterns of ...
AI as Research Assistant: Upscaling Content Analysis to Identify Patterns of ...Axel Bruns
 
2024 03 13 AZ GOP LD4 Gen Meeting Minutes_FINAL.docx
2024 03 13 AZ GOP LD4 Gen Meeting Minutes_FINAL.docx2024 03 13 AZ GOP LD4 Gen Meeting Minutes_FINAL.docx
2024 03 13 AZ GOP LD4 Gen Meeting Minutes_FINAL.docxkfjstone13
 
28042024_First India Newspaper Jaipur.pdf
28042024_First India Newspaper Jaipur.pdf28042024_First India Newspaper Jaipur.pdf
28042024_First India Newspaper Jaipur.pdfFIRST INDIA
 
如何办理(BU学位证书)美国贝翰文大学毕业证学位证书
如何办理(BU学位证书)美国贝翰文大学毕业证学位证书如何办理(BU学位证书)美国贝翰文大学毕业证学位证书
如何办理(BU学位证书)美国贝翰文大学毕业证学位证书Fi L
 
30042024_First India Newspaper Jaipur.pdf
30042024_First India Newspaper Jaipur.pdf30042024_First India Newspaper Jaipur.pdf
30042024_First India Newspaper Jaipur.pdfFIRST INDIA
 
Minto-Morley Reforms 1909 (constitution).pptx
Minto-Morley Reforms 1909 (constitution).pptxMinto-Morley Reforms 1909 (constitution).pptx
Minto-Morley Reforms 1909 (constitution).pptxAwaiskhalid96
 
2024 02 15 AZ GOP LD4 Gen Meeting Minutes_FINAL_20240228.docx
2024 02 15 AZ GOP LD4 Gen Meeting Minutes_FINAL_20240228.docx2024 02 15 AZ GOP LD4 Gen Meeting Minutes_FINAL_20240228.docx
2024 02 15 AZ GOP LD4 Gen Meeting Minutes_FINAL_20240228.docxkfjstone13
 
WhatsApp 📞 8448380779 ✅Call Girls In Chaura Sector 22 ( Noida)
WhatsApp 📞 8448380779 ✅Call Girls In Chaura Sector 22 ( Noida)WhatsApp 📞 8448380779 ✅Call Girls In Chaura Sector 22 ( Noida)
WhatsApp 📞 8448380779 ✅Call Girls In Chaura Sector 22 ( Noida)Delhi Call girls
 
Nara Chandrababu Naidu's Visionary Policies For Andhra Pradesh's Development
Nara Chandrababu Naidu's Visionary Policies For Andhra Pradesh's DevelopmentNara Chandrababu Naidu's Visionary Policies For Andhra Pradesh's Development
Nara Chandrababu Naidu's Visionary Policies For Andhra Pradesh's Developmentnarsireddynannuri1
 
TDP As the Party of Hope For AP Youth Under N Chandrababu Naidu’s Leadership
TDP As the Party of Hope For AP Youth Under N Chandrababu Naidu’s LeadershipTDP As the Party of Hope For AP Youth Under N Chandrababu Naidu’s Leadership
TDP As the Party of Hope For AP Youth Under N Chandrababu Naidu’s Leadershipanjanibaddipudi1
 
₹5.5k {Cash Payment} Independent Greater Noida Call Girls In [Delhi INAYA] 🔝|...
₹5.5k {Cash Payment} Independent Greater Noida Call Girls In [Delhi INAYA] 🔝|...₹5.5k {Cash Payment} Independent Greater Noida Call Girls In [Delhi INAYA] 🔝|...
₹5.5k {Cash Payment} Independent Greater Noida Call Girls In [Delhi INAYA] 🔝|...Diya Sharma
 
2024 04 03 AZ GOP LD4 Gen Meeting Minutes FINAL.docx
2024 04 03 AZ GOP LD4 Gen Meeting Minutes FINAL.docx2024 04 03 AZ GOP LD4 Gen Meeting Minutes FINAL.docx
2024 04 03 AZ GOP LD4 Gen Meeting Minutes FINAL.docxkfjstone13
 
Call Girls in Mira Road Mumbai ( Neha 09892124323 ) College Escorts Service i...
Call Girls in Mira Road Mumbai ( Neha 09892124323 ) College Escorts Service i...Call Girls in Mira Road Mumbai ( Neha 09892124323 ) College Escorts Service i...
Call Girls in Mira Road Mumbai ( Neha 09892124323 ) College Escorts Service i...Pooja Nehwal
 
1971 war india pakistan bangladesh liberation.ppt
1971 war india pakistan bangladesh liberation.ppt1971 war india pakistan bangladesh liberation.ppt
1971 war india pakistan bangladesh liberation.pptsammehtumblr
 

Kürzlich hochgeladen (20)

How Europe Underdeveloped Africa_walter.pdf
How Europe Underdeveloped Africa_walter.pdfHow Europe Underdeveloped Africa_walter.pdf
How Europe Underdeveloped Africa_walter.pdf
 
Nurturing Families, Empowering Lives: TDP's Vision for Family Welfare in Andh...
Nurturing Families, Empowering Lives: TDP's Vision for Family Welfare in Andh...Nurturing Families, Empowering Lives: TDP's Vision for Family Welfare in Andh...
Nurturing Families, Empowering Lives: TDP's Vision for Family Welfare in Andh...
 
Julius Randle's Injury Status: Surgery Not Off the Table
Julius Randle's Injury Status: Surgery Not Off the TableJulius Randle's Injury Status: Surgery Not Off the Table
Julius Randle's Injury Status: Surgery Not Off the Table
 
Enjoy Night⚡Call Girls Rajokri Delhi >༒8448380779 Escort Service
Enjoy Night⚡Call Girls Rajokri Delhi >༒8448380779 Escort ServiceEnjoy Night⚡Call Girls Rajokri Delhi >༒8448380779 Escort Service
Enjoy Night⚡Call Girls Rajokri Delhi >༒8448380779 Escort Service
 
Enjoy Night⚡Call Girls Iffco Chowk Gurgaon >༒8448380779 Escort Service
Enjoy Night⚡Call Girls Iffco Chowk Gurgaon >༒8448380779 Escort ServiceEnjoy Night⚡Call Girls Iffco Chowk Gurgaon >༒8448380779 Escort Service
Enjoy Night⚡Call Girls Iffco Chowk Gurgaon >༒8448380779 Escort Service
 
Gujarat-SEBCs.pdf pfpkoopapriorjfperjreie
Gujarat-SEBCs.pdf pfpkoopapriorjfperjreieGujarat-SEBCs.pdf pfpkoopapriorjfperjreie
Gujarat-SEBCs.pdf pfpkoopapriorjfperjreie
 
AI as Research Assistant: Upscaling Content Analysis to Identify Patterns of ...
AI as Research Assistant: Upscaling Content Analysis to Identify Patterns of ...AI as Research Assistant: Upscaling Content Analysis to Identify Patterns of ...
AI as Research Assistant: Upscaling Content Analysis to Identify Patterns of ...
 
2024 03 13 AZ GOP LD4 Gen Meeting Minutes_FINAL.docx
2024 03 13 AZ GOP LD4 Gen Meeting Minutes_FINAL.docx2024 03 13 AZ GOP LD4 Gen Meeting Minutes_FINAL.docx
2024 03 13 AZ GOP LD4 Gen Meeting Minutes_FINAL.docx
 
28042024_First India Newspaper Jaipur.pdf
28042024_First India Newspaper Jaipur.pdf28042024_First India Newspaper Jaipur.pdf
28042024_First India Newspaper Jaipur.pdf
 
如何办理(BU学位证书)美国贝翰文大学毕业证学位证书
如何办理(BU学位证书)美国贝翰文大学毕业证学位证书如何办理(BU学位证书)美国贝翰文大学毕业证学位证书
如何办理(BU学位证书)美国贝翰文大学毕业证学位证书
 
30042024_First India Newspaper Jaipur.pdf
30042024_First India Newspaper Jaipur.pdf30042024_First India Newspaper Jaipur.pdf
30042024_First India Newspaper Jaipur.pdf
 
Minto-Morley Reforms 1909 (constitution).pptx
Minto-Morley Reforms 1909 (constitution).pptxMinto-Morley Reforms 1909 (constitution).pptx
Minto-Morley Reforms 1909 (constitution).pptx
 
2024 02 15 AZ GOP LD4 Gen Meeting Minutes_FINAL_20240228.docx
2024 02 15 AZ GOP LD4 Gen Meeting Minutes_FINAL_20240228.docx2024 02 15 AZ GOP LD4 Gen Meeting Minutes_FINAL_20240228.docx
2024 02 15 AZ GOP LD4 Gen Meeting Minutes_FINAL_20240228.docx
 
WhatsApp 📞 8448380779 ✅Call Girls In Chaura Sector 22 ( Noida)
WhatsApp 📞 8448380779 ✅Call Girls In Chaura Sector 22 ( Noida)WhatsApp 📞 8448380779 ✅Call Girls In Chaura Sector 22 ( Noida)
WhatsApp 📞 8448380779 ✅Call Girls In Chaura Sector 22 ( Noida)
 
Nara Chandrababu Naidu's Visionary Policies For Andhra Pradesh's Development
Nara Chandrababu Naidu's Visionary Policies For Andhra Pradesh's DevelopmentNara Chandrababu Naidu's Visionary Policies For Andhra Pradesh's Development
Nara Chandrababu Naidu's Visionary Policies For Andhra Pradesh's Development
 
TDP As the Party of Hope For AP Youth Under N Chandrababu Naidu’s Leadership
TDP As the Party of Hope For AP Youth Under N Chandrababu Naidu’s LeadershipTDP As the Party of Hope For AP Youth Under N Chandrababu Naidu’s Leadership
TDP As the Party of Hope For AP Youth Under N Chandrababu Naidu’s Leadership
 
₹5.5k {Cash Payment} Independent Greater Noida Call Girls In [Delhi INAYA] 🔝|...
₹5.5k {Cash Payment} Independent Greater Noida Call Girls In [Delhi INAYA] 🔝|...₹5.5k {Cash Payment} Independent Greater Noida Call Girls In [Delhi INAYA] 🔝|...
₹5.5k {Cash Payment} Independent Greater Noida Call Girls In [Delhi INAYA] 🔝|...
 
2024 04 03 AZ GOP LD4 Gen Meeting Minutes FINAL.docx
2024 04 03 AZ GOP LD4 Gen Meeting Minutes FINAL.docx2024 04 03 AZ GOP LD4 Gen Meeting Minutes FINAL.docx
2024 04 03 AZ GOP LD4 Gen Meeting Minutes FINAL.docx
 
Call Girls in Mira Road Mumbai ( Neha 09892124323 ) College Escorts Service i...
Call Girls in Mira Road Mumbai ( Neha 09892124323 ) College Escorts Service i...Call Girls in Mira Road Mumbai ( Neha 09892124323 ) College Escorts Service i...
Call Girls in Mira Road Mumbai ( Neha 09892124323 ) College Escorts Service i...
 
1971 war india pakistan bangladesh liberation.ppt
1971 war india pakistan bangladesh liberation.ppt1971 war india pakistan bangladesh liberation.ppt
1971 war india pakistan bangladesh liberation.ppt
 

Patenting Prosperity: Invention and Economic Performance in the United States and its Metropolitan Areas

  • 1. Patenting Prosperity: Invention and Economic Performance in the United States and its Metropolitan Areas Jonathan Rothwell, José Lobo, Deborah Strumsky, and Mark Muro An analysis of national and metropolitan area invention from 1980 to 2012, using a new compre- hensive database of patents, reveals: n he rate of patenting in the United States has been increasing in recent decades and T stands at historically high levels. Growth in patent applications slowed after the IT bubble and the Great Recession, but the rate of patenting by U.S. inventors is at its highest point since the Industrial Revolution. Moreover, patents are of objectively higher value now than in “ nventive I the recent past and more evenly dispersed among owners than in previous decades. Still, the United States ranks just ninth in patents per capita using appropriate international metrics, as capacity and global competition has increased. activity— n ost U.S. patents—63 percent—are developed by people living in just 20 metro areas, M which are home to 34 percent of the U.S. population. Reflecting the advantages of large metropolitan economies, 92 percent of U.S. patents are concentrated in just 100 metro areas, including RD with 59 percent of the population. For patents applied for from 2007 to 2011, the metro areas with the highest number per capita are San Jose; Burlington, VT; Rochester, MN; Corvallis, OR; investment, a and Boulder, CO. science-oriented n nventions, embodied in patents, are a major driver of long-term regional economic I performance, especially if the patents are of higher quality. In recent decades, patenting workforce, is associated with higher productivity growth, lower unemployment rates, and the creation of more publicly-traded companies. The effect of patents on growth is roughly equal to that of collaboration, having a highly educated workforce. A low-patenting metro area could gain $4,300 more per worker over a decade’s time, if it became a high-patenting metro area. and patented n esearch universities, a scientifically-educated workforce, and collaboration play an R important role in driving metropolitan innovation. Metro areas with high patenting rates output—are are significantly more likely to have graduate programs in science, especially high-ranking programs, even adjusting for tech sector employment. A high share of college graduates from realized most science fields is also strongly related to higher patenting levels and rates. Additionally, metro areas that collaborate more on patenting, patent more. completely in n atents funded by the U.S. government tend to be of especially high quality, and federal P the nation’s small business RD funding is associated with significantly higher metropolitan produc- tivity growth. The U.S. government supports more basic research than the private sector, metropolitan and so outputs are more likely to be scientific publications than patents. Still, the patents and other research projects that are supported appear to be highly valuable to both regions and society. areas.” For all the success of the United States, the value of invention is not evenly shared across regions because of the clustering of assets like science majors, tech sector workers, and leading research universities. As a result, metropolitan, state, and federal policy makers need to consider ways to foster these attributes more broadly and generally support research and development, as discussed below. The report also recommends reforms to patent law to protect startups and other productive companies from frivolous and expensive legal challenges. BROOKINGS | February 2013 1
  • 2. Introduction I nnovation is central to economic growth.1 Arguably, the most valuable innovations have been embodied in technologies that perform work, such as the provision of energy or health, product assembly, information storage and retrieval, and transportation, to name just a few functions. Such technologies have radically transformed the way humans live for the better and, along with political reforms, have allowed hundreds of millions of men and women descended from serfs, slaves, and peasants to obtain a measure of health and affluence previously available only to elites.2 In the midst of a weak recovery from a particularly severe recession, many people are wondering whether the United States is in a state of decline, lacking the dynamism it once had.3 According to one recent survey, more Americans think the nation’s best days are in the past, not the future.4 Among the long-run drivers of innovation, economists have been identified factors such as education and political institutions that enforce basic rights and treat people as equals.5 There are reasons to be concerned: The growth rate of adults obtaining a college education has slowed over the last three decades, test scores are low compared to other developed countries, income inequality has increased, and U.S. political institutions have become ideologically polarized.6 Moreover, some argue that U.S. inventive output is flagging in the face of other related challenges, including global competition, increasing tech- nological complexity, and weak public sector support relative to other countries.7 More fundamentally, the United States still ranks very high globally on a number of important measures of innovative capacity, though other developed countries have caught up or overtaken it. One study rates the United States fourth in the world in terms of innovative capacity but notes that it ranks near the bottom on changes over the previous ten years in the underlying variables.8 On the weaker side, using internationally-oriented patent applications filed from 2000 to 2010 per resi- dent, the United States ranks somewhat lower at ninth, and it is just 13th on science and engineering publications per capita.9 More positively, the United States ranks third on GDP per worker, behind only Luxembourg and oil-rich Norway.10 On RD spending per capita, it ranks second, behind only Finland.11 Finally, according to the Leiden Ranking (from Leiden University in the Netherlands), all ten of the world’s top research universities are in the United States and 43 of the top 50, led by MIT, Princeton, Harvard, and Stanford.12 All of these factors play a role in American innovation. The focus of this report is on inventive activity, which yields enormous benefits to society that go well beyond the gains from inventors and producers.13 One measure of inventive activity—the num- ber of patents granted per person—has been increasing in the United States, alongside research and development.14 Some scholars have even suggested that too many patents have been granted and attribute an increase to the declining rigor of approval standards.15 Yet, there is a large body of compelling evidence showing that most patents do actually represent valuable inventions, especially “high quality” patents—meaning those that are highly cited or those that advance more intellectual property claims.16 Despite wide variation in value, economists have calculated that the average patent is worth over half a million dollars in direct market value (and considerably more in social value as the technology and its ideas become diffused).17 These estimates are consistent with recent patent sales reported in the media from Eastman Kodak, Motorola, Nortel, and Nokia, which have ranged $477,000 to $760,000 per patent, and even single patents from relatively unknown companies list patent prices at an online website for $1 million.18 Still, some are sold for much less, and others never generate any market or social value or become obsolete after a few years. For example, despite the large legal costs of obtaining a patent, 16 percent of patents are allowed to expire after just four years because the owners refuse to pay even a $900 maintenance fee.19 In any case, there is evidence that patent value is increasing. One indication is that scientific and technical research is increasingly collaborative in the United States and globally, and this appears to be leading to more valuable patents and publications.20 Another is that corporate income from manufacturing sector royalties—which come largely from the licensing of patents—increased by 89 percent from 1994 to 2009, almost double the growth rate of patents granted to domestic inventors.21 However measured, inventive capacity and activity—including RD investment, a science-oriented workforce, collaboration, and patented output—are realized most completely in the nation’s metro- politan areas. Their overlapping social and infrastructure networks, linking and fostering interactions among individuals and businesses have made cities and their surrounds, since their very beginnings, 2 BROOKINGS | February 2013
  • 3. the privileged settings for invention and innovation. As Adam Smith argued in the 18th Century, the large population size of metropolitan regions fosters trade and specialization, which increases productivity and frees people up for research activity.22 Moreover, metropolitan areas facilitate the matching of workers to firms, learning between specialists, and the sharing of suppliers, customers, and regional assets.23 Consequently, patenting activity in the United States has always been largely an urban phenomenon and is highly concentrated in large metro areas today.24 This is also true glob- ally: 93 percent of the world’s recent patent applications were filed by inventors living in metropolitan areas with just 23 percent of the world’s population.25 While U.S. invention remains a global force, a survey of the innovation related literature reveals that the country needs to work out a few crucial problems if it is to realize its potential for economic and social progress. First, while RD spending continues to increase at roughly the same rate as GDP, there is evidence that inventions are becoming more expensive, more difficult, and more internation- ally competitive such that an even deeper commitment will be needed in both the near term and thereafter. Moreover, as the nation addresses its public finance problems, there will be pressure to cut RD support. In fact, the federal commitment has already been shrinking in that spending has not kept up with GDP. This trend should be reversed. The public sector has a vital role to play in sup- porting innovation and invention. Second, the nation’s unequal access to high quality schooling means that too few—especially those born into lower income families—are academically prepared to meaningfully contribute to invention, and that not only delimits economic opportunity, it deprives the innovation system of a large number of people who might otherwise make or commercialize important discoveries.26 This was not the case during America’s most productive decades of the industrial revolution—after the Civil War and into the early 20th Century—when patenting was “democratized” and mostly done by blue collar workers, many of whom were not professional inventors.27 Third, while the patent system is not fundamentally broken, neither is it functioning as effica- ciously as possible. Some have concluded that the entire system should be abolished based on such considerations.28 That would be a big mistake. Recognizing that ideas can be easily transmitted, cop- ied, and reproduced, the nation’s founders, including Madison and Jefferson, took for granted that the patent system was an obvious and necessary means to promote invention.29 All but a tiny fraction of the early industrial revolution’s great inventions were patented.30 Of 5,000 start-up companies founded in 2004, the share receiving venture capital financing—an indicator of market viability—was 14 times higher for companies with patents.31 Comparative economic studies of patent systems tend to verify the Madisonian view, and industries that rely more on patenting are more competitive than those that do not.32 The increase in formal litigation is a problem, but it has roughly grown at the same pace as the increase in patents.33 Still, in patent law’s delicate balancing of incentives to invent with competition, the academic community has largely concluded that the balance leans too heavily in favor of intellectual prop- erty protection, especially with respect to the U.S. Patent and Trademark Office (USPTO), which is regarded by some scholars as less rigorous than the European Patent Office (EPO) or even the Japanese Patent Office (JPO).34 Concerns include, but are not limited to, a decline in the quality of patents being issued, the granting of excessively broad claims over questionable subject matter, the granting of patent protection to “nature,” to functions, or otherwise inappropriate subject matter, the difficulty of entering markets with many patents, and abuse of the legal system to extract rewards for infringement without contributing to innovation. The growing popularity of open-source software is something of a rebuke to the patent system.35 It should be noted that Congress and the USPTO are aware of these concerns, and the pendulum may be swinging in the other direction.36 The American Invents Act, signed into law in 2011, was designed, in part, to address them by taking steps to increase examination quality and make abu- sive litigation less likely. Likewise, a 2012 Supreme Court decision clarified limitations on patenting laws of nature.37 A similar clarification of rules with respect to software patents would be valuable in clarifying that functions, as opposed to the means of performing functions through software code or processes, should not be granted patents.38 Moreover, there is disturbing evidence that non-produc- ing entities (NPEs or firms deemed “trolls”) are taxing productivity activity by buying up large patent portfolios with the sole purpose of suing producers. Such is the problem that the Department of BROOKINGS | February 2013 3
  • 4. Justice and the Federal Trade Commission hosted a recent workshop on the anti-competitive impli- cations of these trends.39 More specifically, survey-based evidence reveals that trolls are extracting billions of dollars (as much as $29 billion in 2011) in payment, and that they often target small players, often startups, imposing huge cost burdens, while suppressing production.40 In 2011, they initiated an estimated 40 percent of lawsuits, up from 22 percent in 2007.41 Other studies have shown that NPEs account for most cases involving frequently litigated patents, and that NPEs tend to acquire very high- value patents for that purpose.42 Settlements reached out of court often do not result in any public records, but there is now abundant anecdotal evidence and a growing sense of outrage that non-pro- ducers are effectively extorting companies on a large scale.43 This needs to be resolved. Finally, the nation must wrestle with the geography of innovation. As economist Enrico Moretti has persuasively argued, highly educated metropolitan areas have grown increasingly apart on measures of income and even health than less educated metropolitan areas in recent decades, reflecting the importance of industry clusters and urban economics in a technologically-infused world that increas- ingly rewards education.44 Less educated areas where temporarily bolstered by the housing bubble because of their cheap land value and labor costs, and even highly educated areas were often seduced into supporting large and wasteful public investments in consumer projects—like new sports com- plexes.45 A better use of local, state, and—when appropriate—federal dollars would be on shoring up a region’s market failures or otherwise helping to solve pressing needs for things like educated work- ers, investment capital, infrastructure, or research institutions. For example, a remarkable study from Finland found that the opening of three technical research universities boosted patenting there by 20 percent, with large effects on engineering education near the universities.46 With these concerns in mind, this report examines the importance of patents as a measure of inven- tion to economic growth and explores why some areas are more inventive than others. Why should we expect there to be a relationship between patenting and urban economic development? As economist Paul Romer has written, the defining nature of ideas, in contrast to other economic goods, is that they are non-rival: their use by any one individual does not preclude others from using them.47 Although useful ideas can be freely transmitted and copied, the patent system guarantees, in principle, tem- porary protection from would-be competitors in the marketplace (i.e. excludability). Thus, one would expect regions to realize at least some of the value of invention, as has been shown for individual inventors and companies that patent.48 Yet there is no guarantee that patents generated in a spe- cific location will generate wealth in that same location—a set of conditions (the presence of a skilled and diverse labor force, an “ecosystem” of businesses providing complementary goods and services, financing and marketing capabilities among them) have to be met for invention to be commercialized. Research has established that patents are correlated with economic growth across and within the same country over time.49 Yet, metropolitan areas play a uniquely important role in patenting, and the study of metropolitan areas within a single large country—the United States—allows one to isolate the role of patents from other potentially confounding factors like population size, industry concentration, and workforce characteristics. After briefly summarizing the methods used to address these issues, the report proceeds with an analysis of U.S. trends in patenting, with a view to addressing the vibrancy, or lack thereof, in U.S. eco- nomic performance. It also assesses how the quality of patents has changed over time and depends on the source of funding. Then the analysis turns to the role of metro areas in invention and the effects that invention has on regional economic development, measured by productivity and unemployment. This study also goes deeper to explore the role of universities and other local institutions as well as science-educated workforce in accounting for why some areas patent more than others. The report concludes with reform proposals to protect innovative companies from unwarranted legal costs and boost innovation. It also explains why public investments in RD and deployment are needed to real- ize the country’s full potential to innovate, and how educational inequality is hindering U.S. economic performance. 4 BROOKINGS | February 2013
  • 5. Methods Source and Description of Patent Data The USPTO maintains patent records from its founding in 1790. Yet, for research purposes, much of the information from previous centuries has not been digitized and thus is not readily available for research use. Starting with patents granted in1975, however, the USPTO has digitized information on inventor and assignee (patent owner) names, as well as addresses and other detailed characteristics of the patent. More detailed methodology can be found on the report’s web page at www.brookings.edu/research/ reports/2013/02/patenting-prosperity-rothwell or directly at www.brookings.edu/sitecore/shell/~/ media/Research/Files/Reports/2013/02/patenting prosperity rothwell/patenting-prosperity-rothwell- appendix.pdf. Deborah Strumsky has assembled this information and organized it into what is the most up-to- date and complete research database of all patenting activity that the authors are aware of, which is why we call it the Strumsky Patent Database. It is similar in many respects to the COMETS database and the NBER patents database, which are both excellent resources for patent scholars.50 Still, the Strumsky Database has some unique features listed here: • omplete coverage of all patents—including plant and design patents—from 1975 to 2012 C (March 20, 2012 for this analysis). • sing a distinct algorithm, it links inventors to their metropolitan area of residence allowing for U detailed spatial analysis (COMETS offers a different version of this).51 A metropolitan area time series is thereby available. • t provides a large number of “quality” metrics for each patent. Those emphasized in this report I are claims and citations. Claims define the patent’s invention and what is legally enforceable about it; patents with multiple distinct inventions enumerate multiple claims.52 Citations to a pat- ent are made if subsequent patents utilize relevant or related knowledge, as determined by the applicant (who is legally bound to mention such references) and the examiner. Both measures are widely acknowledged as indicating value in the academic literature on patents. • ach patent has a USPTO technology code (class number), as well as a more aggregate classifica- E tion and sub-classification scheme created by Strumsky, which provides a sense of the industrial orientation of each patent. • atents are linked to inventors and patent owners (assignees), thereby allowing researcher to P match inventor address information to assignees to calculate ownership statistics by metropolitan area and according to different technological categories. • Government grant funding is indicated using information on the patent record. • niversities, government agencies, foreign and domestic individuals and corporations are identi- U fied as distinct categories of assignees. Patent data was combined with other public data sources for the United States and all of its 366 metropolitan areas, which are statistical approximations of local and regional labor markets (e.g. a city and its suburbs). In the United States, Metropolitan Statistical Areas are defined by the U.S. Office of Management and Budget (OMB) based on data gathered by the Census Bureau. OMB locates these areas around a densely populated core, typically a city, of at least 50,000 people. Counties that have strong commuting ties to the core are then included in the definition of the metropolitan area.53 Focusing on the period from 1980 to 2010, the main measure of metropolitan economic perfor- mance used here is productivity, measured as value-added (or GDP) per worker. Unemployment rates were also analyzed as an outcome variable. In order to explain productivity and unemployment trends in metropolitan areas, a number of control variables were analyzed alongside patenting levels (the number of patents invented in a metropolitan area) and rates (patents invented per worker). These variables include population, the share of adults with a bachelor’s degree or higher, the share of workers employed in the tech sector (see appendix for definition), housing prices, and the level of productivity predicted by a metro area’s industrial mix and national averages of productivity in those sectors (i.e. predicted productivity). The motivation for using this variable is that it captures the effect of national productivity trends on metropolitan industrial sectors, and thus makes places like New York (with a large financial sector) comparable to Las Vegas (which has a large hospitality sector).54 BROOKINGS | February 2013 5
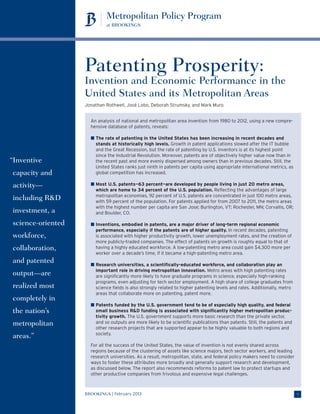
  • 6. The econometric analysis predicts the outcome variables using independent variables measured ten years in the past to avoid bias from reverse causation. The analysis also includes metropolitan effects, to control for unchanging characteristics of metropolitan areas, such as weather, history, and political institutions, and decade effects to capture national trends (in commodity or stock market prices, for example) that affect all metropolitan areas. The appendix discusses more specific details of the data and analysis. Otherwise, the sources for information introduced into the text below are cited either directly or through endnotes. Much of the summary data here will be made available on the Brookings website at the report’s homepage. Findings The rate of patenting in the United States has been increasing in recent decades and stands at historically high levels. Though the United States was still recovering from the Great Recession, 2011 marked a new record high for the number of patents granted by the USPTO for both foreign and domestic-based inventors.55 As noted earlier, some economists and scholars have argued that invention is harder today than ever before because the “low-hanging fruit” has already been plucked. Yet, even if this is true, there are more scientists working today than ever before and research and development (RD) spending is at an all time high. Science professors, engineers, and scientists comprised less than 1 out of every 1000 U.S. workers in 1910, but 25 out of every 1000 in 2010.56 Perhaps, that is why the rate of patent- ing is nearly as high today as any point in U.S. history, as Figure 1 demonstrates covering 212 years of invention. To be more exact, consider the 10 most inventive years in U.S. history, measured by patents per capita. The data excludes patents granted to foreign inventors. They are 1916, 1915, 1885, 1932, 2010, 2011, 1931, 1883, 1890, and 1917. In other words, two of these years came just after the Great Recession. The others were in the midst of the Industrial Revolution and post-Civil War America. Figure 1. History of Patented U.S. Inventions per Capita, 1790–2011 by Year Granted 450 400 350 300 250 200 150 100 50 0 1790 1795 1800 1805 1810 1815 1820 1825 1830 1835 1840 1845 1850 1855 1860 1865 1870 1875 1880 1885 1890 1895 1900 1905 1910 1915 1920 1925 1930 1935 1940 1945 1950 1955 1960 1965 1970 1975 1980 1985 1990 1995 2000 2005 2010 10-year moving average of patents per million population Patents per million residents 6 BROOKINGS | February 2013
  • 7. Stepping back, one can pick out a few eras of U.S. inventiveness. From 1790 to 1853, the rate of invention was very low, but it exploded in the Industrial Revolution starting in the mid-19th Century and lasting all the way until the Great Depression. Scholars have characterized this period of U.S. history as the “golden age” of invention when industries such as textiles, garments, household utensils, and farming implements experienced tremendous innovation.57 With the onset of the Great Depression, the rate of invention plummeted from the 1930s to 1955, but there was a noticeable post-war rebound from 1956 to 1973, when the major research breakthroughs in modern information technology were first made. The decade from 1974 to 1984 saw a precipitous decline in inventive activ- ity, but since, then, and starting in 1985, a post-industrial era of invention has begun and patent rates have steadily increased and remained high. There was one exceptional period with respect to this current trend towards higher patenting rates. The years from 2002 to 2005 saw one of the largest four-year drops in patent per capita since the Civil War—a decline of 17 percent, compared to a 2 percent increase for the average four year period since 1870. This was the height of the investment bubble in subprime mortgages, but this drop off also reflects slowed application growth from 2001 to 2002 in the wake of the IT-bubble. Still, patent growth has been very strong since the Great Recession officially ended in 2009. The data in Figure 1 refer to granted patents by the year they were granted, which has been 3 to 4 years after its application in recently, but the trend is similar for applications; patent application growth was zero from 2007 to 2009 but accelerated to 7 percent from 2009 to 2010 and 3 percent from 2010 to 2011. One would, therefore, expect a spike in grants in 2013. Scholars have noted the strong growth in patenting over the last two decades. Some have argued that it is the result of changes in patent law, particularly changes that allowed for software patents, or a relaxation of standards. In other words: Has quantity been achieved at the expense of quality? There is evidence here to suggest otherwise. As others have found, objective measures of pat- ent quality have been increasing in recent decades, such as the number of claims per patent.58 The trend is illustrated in Figure 2. The number of claims per patent has increased steadily since 1975 and reached a high point in 2005 at 17.4. The measure declined during 2006 and 2007 and started Figure 2. Trend in Claims and Citations (Within Eight Years of Grant) for all USPTO Patents Granted Between 1975 and 2012, by Year Granted 20 18 16 14 12 10 8 6 4 2 0 1975197719791981198319851987198919911993199519971999200120032005200720092011 BROOKINGS | February 2013 7
  • 8. growing again in 2010. No recent decade has seen as many claims per patent as the 2000s. The slight dip in claims in recent years could be due to increases in the fees charged by the USPTO for over 20 claims.59 Other scholars have found that the upward trend in claims is partly attributable to the inter- nationalization of patent applications and the growing complexity of patenting, but much of the time trend cannot readily be explained.60 The increase in measured patent quality and patent rates coincides with an increase in RD spend- ing and does not appear to be entirely driven by legal changes, as patent scholars have noted.61 Indeed, RD expenditures, adjusted for inflation, increased by an annualized rate of 3.6 percent each year from 1980 to 2009, with roughly 70 percent coming from industry sources, and RD spending since 1953 is highly correlated with patenting and the patent rate.62 In 2008, inflation-adjusted RD reached a record high, with 2009 as the last available year of data.63 If measured as a share of GDP, RD spending has been more steady over the decades, but in 2009, the ratio—2.9 percent—equaled the historic high last achieved in 1964. RD classified as basic, rather than applied or developmental, has increased the most rapidly since 1953.64 The U.S. trend is less impressive, however, when compared to some other developed countries, when compared data is examined. From1981 to 2008, U.S. RD growth was slower than a number of highly developed coun- tries such as each of the Scandinavian countries, Spain, Australia, Canada, and Japan, though higher than many larger economies like Germany, the United Kingdom and France.65 The only modest relative growth in U.S. RD may explain why, as noted in the introduction, the United States ranks just ninth in patents per capita, using appropriate international data. Patent schol- ars have noted a “home-office bias,” meaning that European inventors tend to rely disproportionately on the EPO, Japanese inventors on the JPO, and US inventors on the USPTO.66 The Organization for Economic Cooperation and Development (OECD), however, provides data on applications filed under the Patent Cooperation Treaty (PCT), which creates a universal application for patents that can be used across the major patent offices.67 Such patents tend to be more valuable than those using only the domestic office applications.68 This limits the comparison to potentially international patents. On this score the United States ranks ninth on patent applications filed under the PCT system from 2000 to 2010, below (in order from the highest) Sweden, Finland, Switzerland, Israel, the Netherlands, Denmark, Germany, and Japan. Using only 2010 data, the United States falls to 12th, as Korea, Norway, and Austria move ahead. The average Swede is roughly twice as likely to file a PCT application as the average American. Those U.S. rankings are identical using data on patents granted by the USPTO and filed at all three major offices (EPO, JPO, and USPTO).69 The inventions from these countries, on net, will likely benefit U.S. consumers, even as some compa- nies and workers lose out from competition, but what is more troubling is that additional RD spend- ing has not translated into as many patents as one might have expected. Consistent with the concern that technologies are becoming more complex, fewer inventions are patented for every dollar of RD. From 1953 to 1974, one patent was generated for every $1.8 million of RD. Since 1975, the average implicit “cost” has been $3.5 million, about twice as high, in inflation adjusted dollars. As other schol- ars have found, the increased cost of RD per patent could be at least partly attributed to an increase in quality, but it means RD growth must accelerate.70 The trend in RD and claims suggest that the increase in the patenting rate may reflect a real increase in the number of valuable inventions. Skeptical readers, however, may still want further evidence that the trend is not the result of relaxed approval standards, a surge in foreign-inventor contributions, or the perverse incentives of litigation. While these and other explanations cannot be definitely rejected, the broad evidence is consistent with the conclusion that the rate of invention is increasing along with the rate of patenting. The share of patents that have received no citations— which does not necessarily indicate that they are or poor quality—has held steady between five and six percent in the 1980s and 1990s.71 Moreover, while the share of USPTO patented granted to foreign inventors has increased dramatically (and is now almost half), those granted to domestic inventors make significantly more intellectual property claims and receive more subsequent citations by a wide margin, as Table 1 displays. It is also unlikely that changes in litigation practice explain the increased patenting rate. Annualized growth in re-examinations from 1981 to 2011 was 4.9 percent compared to 4.8 percent patent growth.72 Median damages amounted to $2 million in 2010, according to one study, but there was no upward 8 BROOKINGS | February 2013
  • 9. Table 1. Intellectual Property Claims and Citations Within Eight Years of Grant by Foreign Status of Inventor, for All Granted Patents Applied For, 1975–2012 Claims Citations within 8 years U.S. Inventors 15.1 8.0 Foreign Inventors 12.1 5.1 Source: Brookings analysis of Strumsky patent database Table 2. Claims per Patent, and Eight-Year Citations per Patent, in the 10 Largest Subcategories Annual Granted Patents, applications Claims per patent, applied for Citations per patent, Subcategory from 2006-2010 from 2006-2010 applied for from 1991-1995 Communications 10,711 17.2 16.0 Computer Software 8,395 17.5 18.9 Semiconductor Devices 8,258 14.2 14.1 Computer Hardware Peripherals 7,327 16.1 16.2 Power Systems 6,904 11.7 9.4 Electrical Systems Devices 5,540 13.8 8.0 Biotechnology 5,189 15.3 7.0 Measuring Testing 4,652 13.5 7.2 Information Storage 4,626 15.6 11.8 Transportation 4,533 9.0 6.6 10 largest subcategories 66,134 14.4 11.5 All subcategories 138,312 12.8 9.8 Source: Brookings analysis of Strumsky patent database. Patents years are determined by year of application. Each period observation is the average of the five year period ending that year. The subtotal and total rows display totals in the first column and un-weighted averages in the second and third columns. trend compared to recent years.73 While litigation has been increasing, the rate of growth is consis- tent with the rate of growth in patenting. The number of patent cases filed at U.S. District Courts as a percentage of all patents remained stable from 1970 to 2008.74 The rate has hovered between 1.2 and 1.6 percent of patents granted.75 By historic standards, this is actually not particularly high, though comparisons across different institutional arrangements and eras are subject to considerable error. In the early years of the industrial revolution, the rate was as high as 3.6 percent in the 1840s and 2.1 in the 1850s; many disputes concerned manufacturing industry inventions, the tech sector of the 19th century.76 Before Bell Labs established itself as the darling of invention, Alexander Graham Bell won large patent infringement cases in the 1870s.77 Likewise, industrial giants GE, founded by Thomas Edison, and Westinghouse filed hundreds of patent suits in the 1890s.78 None of this is to suggest that the threat of law suits or the trend in undisclosed settlements have not increased or that of the patent system’s rules are optimal.79 To better understand patenting trends, one can start by looking at which technologies are repre- sented in patents. First of all, almost half (46 percent) of all patents can be grouped in the 10 largest categories; the patents in this group tend to make more claims and receive more citations compared to smaller technological groups, which may or may not reflect underlying value. The most prominent technological category is communications. Over the five year period ending in 2010, 10,000 patents were granted to communications technologies, and as Table 2 shows, these patents were also highly valuable in terms of claims and citations. Leading patent owners over the five year period include Cisco, IBM, ATT, Qualcom. Two of the next four categories are directly linked to computers—software (e.g. Microsoft) and hardware (e.g. Apple), and also score highly on citations and BROOKINGS | February 2013 9
  • 10. Table 3. Subcategories with the Fastest and Slowest Growth Rates in Patenting from 1980 To 2005, by Change in Value Measures Annual Growth Rate in Patents, Change in Claims per Patent, Change in Eight- year Citations Subcategory 1980-2005 (moving average) 1980 to 2005 per Patent, 1980 to 1995 Subcategories with the fastest growth in patents Computer Software 11% 7.3 12.1 Data Processing 11% 6.3 11.0 Semiconductor Devices 10% 6.0 8.1 Video Distribution Systems 10% 7.0 36.1 Computer Hardware Peripherals 8% 7.0 9.2 Chemical-Crystals 8% 5.4 7.6 Nanotechnology 8% 10.3 5.5 Information Storage 6% 7.3 6.8 Communications 6% 8.4 11.7 Design 5% 0.0 2.4 Subcategories with the slowest growth in patents Chemical-Purification/Evaporation/Distillation -2% 6.0 3.6 Chemical-General Compound Compositions -3% 5.4 3.0 Time Measurement Horology -3% 5.1 3.1 Machine Element or Mechanism -3% 5.7 2.9 Chemical-Manufacture Specific -3% 7.5 3.9 Organic Compounds -3% 5.0 2.5 Pipes Joints -3% 5.2 3.1 Education Demonstration -4% 7.4 10.9 Hazardous Waste -4% 5.7 0.5 Heating, Refrigeration Ventilation -4% 6.8 2.8 Source: Brookings analysis of Strumsky patent database. Patents years are determined by year of application. Each period observation is the average of the five year period ending that year. claims. In general, the computer and information technology patents tend to make the most claims and receive the most citations; the large number of citations may reflect the large scale of the indus- try’s patenting activities, which would require documenting previous work. Other large technological groups tend to receive fewer citations and make fewer claims, but none- theless make large contributions to U.S. and global invention, including a number of older industrial categories related to power, electrical systems, measuring devices, and transportation. For Electrical Systems and Devices, some of the leading owners of patents granted between 2006 and 2010 were IBM, Tyco Electronics (now TE Connectivity), Intel, Broadcom, Texas Instruments, Micron, and the Eaton Corporation. Transportation includes the auto and aerospace industries, with prominent patent owners including Goodyear, Ford, GM, Boeing, Honda, Delphi, Lockheed Martin, and Caterpillar. Large inventors of Power Systems patents include GE, IBM, GM, HP, Lutron Electronics, and Honeywell. Leading Measuring and Testing patent owners include some lesser known companies like KLA-Tencor, Schlumberger, Agilent, Applied Materials, and Zygo. Table 3 reports the technological categories with the strongest and weakest growth rates in patent- ing from the five year period ending in 1980 to the five year period ending in 2005. Again information and communication technologies are among the strongest growing technological categories, led by Computer Software, Data Processing, Video Distribution Systems, Computer Hardware, Information Storage, and Communications. Computer and information related technologies have also seen sharp increases in claims and citations per patent. The Nanotechnology category is not frequently used by the patent examiners, considering that it has less than 1000 total patents, but it has been growing rap- idly in recent years. It refers mostly to microscopic measurement devices. The Design category refers 10 BROOKINGS | February 2013
  • 11. Figure 3. Share of Patents Held by Largest 5, 10, 50, and 100 Patent Owners by Year of Grant, 1976-2012 50% 45% 40% Top 100 Share 35% 30% Top 50 Share 25% 20% Top 10 Share 15% Top 5 Share 10% 5% 0% 1976 1978 1980 1982 1984 1986 1988 1990 1992 1994 1996 1998 2000 2002 2004 2006 2008 2010 2012 to the design aspects of miscellaneous machines and cosmetic products, with leading patent owners including Black and Decker, Procter and Gamble, and Gillette. One implication of the industry category analysis becomes clear: Most patents, especially of higher value, are being generated by a small number of industries, disproportionately and primarily in fields like computer and information technology, electronics, biotechnology, energy, and transportation. As a recent report from the USPTO documented, patent intensive industries employ just a small fraction of the U.S. workforce, and yet these industries drive most of the technological changes that increase living standards, by reducing the costs of things like food, energy, and information.80 Yet, that industry concentration has not coincided with limited competition. As Figure 4 shows, pat- ent ownership has become more dispersed since the mid 1970s and 1980s, at least outside the very largest firms. The share of patents held by the top 5 patent owning companies has increased slightly from 9 percent in 1976 to 11 percent in 2012, but the top 10 share has remained stable, and the top 50 and top 100 shares have fallen by 7 and 11 percentage points respectively. The trend is similar even in the more concentrated and controversial category of software patents. Even these data understate the creative destruction of high-tech companies for the list of compa- nies at the top has changed. In recent years (2011 and 2012), just 4 of the top 10 owners of patents granted those years were in the top 10 between 1976 and 1980: IBM, GE, GM, and ATT (counting Bell Labs as the antecedent). Of the rest, Hewlett-Packard cracked the top 10 for the first time in 1992, Microsoft and Intel in 1996, Cisco in 2006, Broadcom in 2009, and Apple not until 2010. In other words, even while a few tech giants account for a large share of the nation’s patents, patent ownership as a whole has become broader and more competitive with considerable churn both at the top and throughout the distribution, including a massive increase in the number of firms with just one pat- ent per year. In 1976, 2,677 companies or organizations (like universities or federal agencies) owned exactly one patent granted that year; by 2011, that number had soared to 9,909. From 1980 to 2011, the average metropolitan area saw a 7 percentage point drop in the share of newly granted patents held by the largest patent owner and a 2 percentage point drop in the share BROOKINGS | February 2013 11
  • 12. Figure 4. Concentration of U.S. Patents Invented in Most Inventive Metro Areas from 2000-2012 Relative to 2010 Population Shares Share of U.S. Patents Share of U.S. Population 100% 92% 90% 80% 70% Metro Share of U.S. Total 63% 60% 59% 50% 46% 40% 30% 30% 34% 20% 20% 10% 12% 0% 5 10 20 100 Number of most inventive metro areas held by the top 5 assignees. Many high patenting metropolitan areas saw patents disperse widely across firms. In Indianapolis, for example, there was a 29 percentage point decrease from 1980 to 2011 in the share of patents owned by the top 5; in Boulder, Colorado there was a 27 percentage point decrease; a 17 percentage point decrease in Austin, and an 8 percentage point decline for San Francisco. In general, the more patents in a region, the wider the dispersion across firms at any given time. To summarize this section, patent data implies that the rate of invention—at least of patentable inventions—is near historic highs, quality appears to be increasing and not as the result of changes in litigation practices, a few industries are responsible for most patenting activity, and competition between patent owners seems to have increased. Still, give the geographic concentration of industries and production, the gains from patenting may be similarly concentrated and of little benefit to large numbers of Americans. For all the dispersal of invention, relative to the hierarchical corporate labs of the 1970s, there remains a massively unequal distribution of patents across metropolitan areas. The next sections turn to the spatial geography of patenting and its effect on economic performance. Most U.S. patents—63 percent—are developed by people living in just 20 metro areas, which are home to 34 percent of the U.S. population Metropolitan areas play a critical role in setting the productivity of the U.S. economy.81 Large metros in particular account for a disproportionate share of GDP and educated workers, but they are especially crucial for patenting. The 100 largest metro areas are home to 65 percent of the U.S population in 2010, but they are home to for 80 percent of all U.S. inventors of granted patents since 1976 and 82 percent since 2005. Few patents are invented outside of metro areas. In fact, 93 percent of all U.S. patent inventors have lived in metro areas since 1976 (using the year of application). U.S. patented invention is highly concentrated in a relatively small number of cities and their sub- urbs, as Figure 1 reinforces. Indeed, just the five most patent intensive metro areas accounted for 30 percent of all patents from U.S. inventors. The average resident in these five metro areas is 2.4 times 12 BROOKINGS | February 2013
  • 13. Table 4. Total Granted Patents and Patenting Rate by Metropolitan Area of Inventor, 2007–2011 Average Granted Patents Patents per million Largest subcategory per year, 2007-2011 residents, 2007-2011 of patents San Jose-Sunnyvale-Santa Clara, CA 9,237 5,066 Computer Hardware Peripherals San Francisco-Oakland-Fremont, CA 7,003 1,638 Biotechnology New York-Northern New Jersey-Long Island, NY-NJ-PA 6,907 366 Communications Los Angeles-Long Beach-Santa Ana, CA 5,456 424 Communications Seattle-Tacoma-Bellevue, WA 3,968 1,174 Computer Software Boston-Cambridge-Quincy, MA-NH 3,965 877 Biotechnology Chicago-Joliet-Naperville, IL-IN-WI 3,886 409 Communications San Diego-Carlsbad-San Marcos, CA 3,165 1,041 Communications Minneapolis-St. Paul-Bloomington, MN-WI 3,068 945 Surgery Medical Instruments Detroit-Warren-Livonia, MI 2,720 621 Transportation Austin-Round Rock-San Marcos, TX 2,497 1,503 Computer Hardware Peripherals Philadelphia-Camden-Wilmington, PA-NJ-DE-MD 2,370 402 Biotechnology Houston-Sugar Land-Baytown, TX 2,202 379 Earth Working Wells Dallas-Fort Worth-Arlington, TX 1,945 310 Communications Portland-Vancouver-Hillsboro, OR-WA 1,844 837 Computer Hardware Peripherals Atlanta-Sandy Springs-Marietta, GA 1,506 285 Communications Washington-Arlington-Alexandria, DC-VA-MD-WV 1,479 271 Communications Phoenix-Mesa-Glendale, AZ 1,437 343 Semiconductor Devices Raleigh-Cary, NC 1,273 1,164 Computer Hardware Peripherals Poughkeepsie-Newburgh-Middletown, NY 1,226 1,829 Semiconductor Devices Average of all metropolitan areas 299 296 Source: Brookings analysis of Strumsky Patent Database and American Community Survey. One patent is assigned to a metro area if at least one inventor lives there. Year refers to year of application, not grant. Since it takes a few years for an application to become granted, these patent totals are artificially low. more likely to invent a patent than the average American. The 10 most inventive metro areas account for nearly half of all patents, 46 percent, and the 100 most inventive metros account for 92 percent. These metro areas contain a hugely disproportionate number of highly specialized researchers, engi- neers, and entrepreneurs who are coming up with new technologies. This degree of concentration has not changed much since the 1980s, though two trends are worth noting. The concentration of patents in the 100 most inventive metro areas has increased from 90 in the 1980s to 92 (since 2000), even as the share concentrated in the top five fell from 32 to 30. In other words, invention is slightly more concentrated in large metro areas than it was three decades ago, but the dominant regions have lost market share to other highly inventive areas. From 1980 to 2011, a few large metros notably changed their share of U.S patents.82 At the top, San Jose moved up from ninth to first, and San Francisco moved from seventh to fourth, moving ahead of Chicago, Philadelphia, Detroit, and Boston. Seattle and San Diego moved up 15 and nine places, respec- tively, to become seventh and eighth. Meanwhile, Austin and Raleigh moved up 41 and 55 places, respectively, to become 11th and 20th. Cleveland fell 10 slots from 13th to 23rd, while Philadelphia fell from fourth to 13th. Although the high-patenting metro areas are all large, patenting per capita rates (a measure of the inventive productivity of an area) vary widely. Table 4 lists the metro areas of any size with the high- est number of granted patent over the five year period ending in 2011. In the last column, the largest patenting subcategory is listed for each metro to provide a sense of the most prominent patenting industries. With computer hardware and peripherals as the lead category, San Jose stands out with 9,237 patents per year, from 2007 to 2011. This is 2000 more patents than the next highest metro area—its neighbor, San Francisco. Of the other large metros on the list, New York, Chicago, Washington D.C., BROOKINGS | February 2013 13
  • 14. Table 5. Total Granted Patents and Patenting Rate by Metropolitan Area of Inventor, 2007–2011 Patents per million residents, Average Granted Patents Largest subcategory 2007-2011 per year, 2007-2011 of patents San Jose-Sunnyvale-Santa Clara, CA 5,066 9,237 Computer Hardware Peripherals Burlington-South Burlington, VT 3,951 826 Semiconductor Devices Rochester, MN 3,300 606 Computer Hardware Peripherals Corvallis, OR 2,319 194 Semiconductor Devices Boulder, CO 2,274 666 Communications Poughkeepsie-Newburgh-Middletown, NY 1,829 1,226 Semiconductor Devices Ann Arbor, MI 1,697 590 Motors, Engines Parts San Francisco-Oakland-Fremont, CA 1,638 7,003 Biotechnology Austin-Round Rock-San Marcos, TX 1,503 2,497 Computer Hardware Peripherals Santa Cruz-Watsonville, CA 1,204 310 Computer Hardware Peripherals Seattle-Tacoma-Bellevue, WA 1,174 3,968 Computer Software Raleigh-Cary, NC 1,164 1,273 Computer Hardware Peripherals Rochester, NY 1,149 1,198 Optics Durham-Chapel Hill, NC 1,120 552 Biotechnology Trenton-Ewing, NJ 1,073 393 Biotechnology Sheboygan, WI 1,045 120 Invalid USPTO Code San Diego-Carlsbad-San Marcos, CA 1,041 3,165 Communications Albany-Schenectady-Troy, NY 981 846 Power Systems Ithaca, NY 959 97 Biotechnology Minneapolis-St. Paul-Bloomington, MN-WI 945 3,068 Surgery Medical Instruments Source: Brookings analysis of Strumsky Patent Database and American Community Survey. One patent is assigned to a metro area if at least one inventor lives there. Year refers to year of application, not grant. Miami, and Atlanta have rather low patenting rates—less than 10 times the rate of invention in San Jose. On the other hand, San Francisco, Boston, Austin, Seattle, San Diego, Portland, Rochester, and Minneapolis are in an upper tier of large metros that produce patents at high volumes and rates. Many of the metro areas just mentioned also develop patents at extraordinarily high rates, espe- cially San Jose; with over 5,000 patents per million residents in any given year from 2007 to 2011 it is the most inventive metro area by size and intensity. As Table 5 shows, highly inventive metro areas are scattered across each region of the country. In the Northeast there is Burlington, Vermont, one in New Jersey (Trenton in Mercer County, which includes Princeton), and three more in New York. The West is represented by 7 of the top 20 metro areas, including 4 in California, as well as Corvallis, Oregon, Seattle, and Boulder Colorado. The Midwest has four—with Rochester, Minnesota rating the highest— and the south three, with Austin, Texas and two in North Carolina. The differences in patenting rates are truly large, when metro areas at the extremes are placed side by side. A resident living in one of the 100 most inventive metropolitan areas is seven times more likely to invent a patent than someone living in lower ranked metropolitan area. A resident of the San Jose metropolitan area is 600 times more likely to invent a patent than a resident of McAllen, Texas, 160 times more likely than a resident of Johnstown, Pennsylvania, and 100 times more likely than resi- dents of Fresno, California or Lakeland-Winter Haven, Florida. Even compared to a high-patenting area like metropolitan Detroit, a San Jose resident is 8 times more likely to invent. Inventions, embodied in patents, are a major driver of long-term regional economic performance, especially if the patents are of higher quality. It is well documented that inventors and companies do not benefit from the full value of their prod- ucts.83 Much goes to consumers or society, in form of better health and higher quality, more affordable goods and services. Regions too are unlikely to capture the full benefits of ideas invented there that 14 BROOKINGS | February 2013
  • 15. Figure 5. Average 10-Year Marginal Effect of Metro Area Patents and Other Variables on Total Metro Area Productivity Growth, with 95 Percent Confidence Intervals, 1980-2010 14.0% 12.0% Effect on GDP per Worker 10.0% 10.2% 8.8% 8.0% 6.0% 4.0% 2.7% 2.5% 2.0% 0.0% Patents Bachelor's Degree Sector Population Attainment Rate Employment eventually become commercialized, traded, implemented, and perhaps even copied. With this in mind, the question arises: Do regions benefit from having many inventors? To answer this question, regression analysis was used to assess the relationship between patents and productivity growth—measured as GDP per worker—from 1980 to 2010 for every metropolitan area in the United States (with available data that came to 358). Since many other factors affect productiv- ity but might be correlated with patenting, the analysis controls for the share of college graduates living in the metro area, population size, industry concentration, housing prices, and constant met- ropolitan specific characteristics (which would include geographic advantages, history, and political institutions). The econometric details are shown in the appendix The results clearly show that patenting is associated with higher metropolitan area productivity. The analysis cannot rule out that the link is caused by some missing variable or reverse causality, but given the control variables and the fact that patents were lagged ten years in the analysis, the most likely explanation is that patents cause growth. In order to translate the evidence into concrete terms, one can group metropolitan areas into quartiles of patenting, with the most inventive metros (by number of patents) in the top quartile. If the metro areas in the lowest quartile, patented as much as those in the top quartile, they would boost their economic growth by 6.5 percent over a ten year period. By comparison, the average metro area in this bottom quartile grew by 13 percent each decade over this period, so an extra 6.5 percent would be a large boost, representing an extra $4,300 per worker (adjusted for inflation). That would require, roughly, an extra 960 patents per year. Though not without difficulty, such figures could be generated by a few large corporate RD offices or universities. The other notable finding is that patents compare rather well to other growth-enhancing factors, like human capital. First of all, five variables analyzed in this analysis are all statistically significant and economically meaningful. With that said, the patenting effect is somewhat larger than the effect from bachelor’s degree attainment. A one standard deviation of growth in the number of patents (or, more precisely, the natural log of patents) granted to metro area inventors is associated with a 2.7 percent increase in economic growth—measured as output per worker. That compares to 2.5 percent for a one BROOKINGS | February 2013 15
  • 16. Figure 6. Average 10-Year Marginal Effect of Metro Area Claims and Other Variables on Total Metro Area Productivity Growth, with 95 Percent Confidence Intervals, 1980-2010 14.0% 12.0% Effect on GDP per Worker 10.0% 10.2% 8.0% 6.0% 6.4% 4.0% 3.5% 2.0% 1.9% 2.3% 0.0% -2.0% Patent Claims Bachelor's Sector Population Tech Industry Degree Employment Employment Attainment Rate standard deviation increase in the bachelor’s degree attainment rate and slightly less for the sector employment effect. The patenting effect is important, but it is smaller than the effects from population size and sector employment concentrations. The sector effect is the largest. The interpretation is intuitive: Where employment is concentrated in high-productivity industries (e.g. energy, utilities, finance, information, and professional services), metropolitan area output per worker is consistently higher. Where it is in low-productivity sectors---like health care, leisure and hospitality (tourism), education, restaurants, and agriculture—metro area productivity is low. Population also has a large effect on productivity. This is the well documented phenomena that firms are more productive when they exist in clusters of related businesses and in large urban areas.84 Patenting Quality Patent claims have a larger effect on metropolitan productivity than patents themselves. This makes sense if one considers that a patent with many claims is akin to multiple patents with few claims. In fact, after accounting for the number of claims, patents do not add value to a metropolitan economy. To test the strength of these conclusions, the analysis also considered the effects of employment in tech industries, which are high-patent industries. The motivation for this is that tech sector workers and their companies may have other characteristics—besides high patenting rates—that are associated with productivity (e.g. higher education levels, export orientation, and wages).85 The effects of patent claims are compared to other variables, as was done above with patents, in Figure 7, shown above. Patent claims are highly significant and strongly associated with productivity growth. Industrial sector and population effects are larger, though the effects of population and pat- ent claims overlap, so one cannot be sure that they differ. Meanwhile, bachelor’s degree attainment is now marginally insignificant, as is tech-sector employment. They are highly correlated, and further analysis shows that their combined effect is highly significant.86 Metropolitan Level Trends in Productivity The aggregate results reported above become more concrete when looking at specific metropolitan areas. Table 6 lists the large metropolitan areas with the largest increase in patents per worker from 1980 to 2010, along with their performance on productivity growth, the change in the bachelor degree 16 BROOKINGS | February 2013
  • 17. Figure 7. Average Unemployment Rates of Metropolitan Areas with Above and Below Average Growth in Patents from 1990 to 2010 7.0 6.4 6.0 5.3 Average Unemployment Rate 5.0 4.0 Average Unemployment Rate, 1990-2010 3.0 2.0 1.0 0.0 Above average Below average patent growth, patent growth, 1990-2010 1990-2010 attainment rate, and growth in predicted productivity (based on how national trends in sector produc- tivity would be expected to affect metro areas, given their sector mix). San Jose, again, tops the list, with an increase of 13,206 patents per million workers from the 1980 to 2010. Stated otherwise, the probability that a given worker in San Jose invented a patent increased by 1.3 percentage points—and the increase will be even higher as pending patents become granted in the next few years. As it happens, San Jose also experienced the highest productivity growth, and much of that growth cannot be explained by its re-orientation towards more productive economic sec- tors, as a comparison between the second and the third columns suggests. Patenting is correlated with productivity growth: 14 of the 20 metro areas with the largest increase in patents per worker from 1980 to 2010 (out of the 358 with complete data) experienced above average productivity growth. Indeed, in addition to San Jose, four of those other metro areas are also ranked in the top 20 on productivity growth: Corvallis, OR; Boulder, CO; Raleigh, NC; and Portland, OR. In each case, sector re-orientation towards higher-productivity industries would predict lower growth rates than they actually experienced, suggesting that other factors were at work. In addition to explo- sive patent growth, Raleigh and Boulder had rapid increases in human capital, measured by the share of adults aged 25 and older with a bachelor’s degree or higher, but this was not the case in Corvallis and Portland, where the increase in bachelor degree attainment shares was below average. For the six metro areas with a large patent increase but low productivity growth, five of them shifted employment towards low productivity but stable economic sectors like education and health care (e.g. in Provo, home to BYU, 22 percent of workers were employed in education and health care, compared to 14 percentage nationally). The other—Racine, Wisconsin—suffered from stagnant population growth and a meager increase in the bachelor’s degree attainment rate. The same relationship between patents and productivity changes can be drawn by examining met- ropolitan areas with that developed fewer patents per worker over the three decades. Rust belt metro areas with low productivity growth—like Pittsburgh, Toledo, and Buffalo—actually saw a decrease in the number of patents per worker. This is also true of Tulsa, Oklahoma, Louisville, and Baton Rouge, all BROOKINGS | February 2013 17
  • 18. Table 6. Productivity Growth in the 20 Metropolitan Areas with the Largest Increase in Patents per Worker, 1980–2010 Change in patents Annual Productivity Predicted Productivity Change in Bachelors per million workers, Growth, Growth, Degree Attainment 1980-2010 1980-2010 1980-2010 1980-2010 San Jose-Sunnyvale-Santa Clara, CA 13,206 3.3% 2.2% 18.4% Burlington-South Burlington, VT 8,355 2.1% 1.7% 16.6% Corvallis, OR 6,644 2.6% 1.1% 11.3% Winchester, VA-WV 6,633 1.6% 1.6% 10.5% Rochester, MN 6,536 1.6% 0.9% 14.0% Charlottesville, VA 4,491 1.4% 1.4% 15.1% Poughkeepsie-Newburgh-Middletown, NY 4,219 1.8% 1.4% 12.7% San Francisco-Oakland-Fremont, CA 4,059 1.9% 1.2% 17.5% Blacksburg-Christiansburg-Radford, VA 3,709 1.3% 1.2% 11.5% Austin-Round Rock-San Marcos, TX 3,591 1.9% 1.3% 12.8% Santa Cruz-Watsonville, CA 3,547 1.7% 1.1% 13.7% Boulder, CO 3,182 2.3% 1.8% 20.6% Seattle-Tacoma-Bellevue, WA 2,957 1.3% 1.5% 14.8% Raleigh-Cary, NC 2,848 2.3% 1.9% 19.8% Ann Arbor, MI 2,602 1.1% 1.5% 14.7% San Diego-Carlsbad-San Marcos, CA 2,357 2.2% 1.3% 13.1% Durham-Chapel Hill, NC 2,212 1.9% 1.5% 17.8% Provo-Orem, UT 2,062 0.5% 1.3% 12.0% Portland-Vancouver-Hillsboro, OR-WA 2,056 2.5% 1.3% 13.9% Racine, WI 2,046 1.0% 1.8% 9.0% Average for top 20 metros 4,366 1.8% 1.5% 14.5% Average of all metro areas 395 1.4% 1.4% 9.7% Source: Brookings analysis of Strumsky database, U.S. Census Bureau, and Moody’s Analytics. Patent totals for 1980 and 2010 are based on five year moving averages that end in those years, since patent data fluctuates from year to year. Figures are based on application year of patents already granted. Predicted industry productiv- ity multiplies metro area employment shares by sector by national productivity for each sector. The growth rate is calculated using 1980 and 2010 measures. three of which had very slow productivity growth. On the other hand, a metropolitan area like Detroit does not fit the model in any simple way. It ranked 37th on the increase in patents per worker, but 306th in productivity growth, 185th on pre- dicted productivity growth, 248th on tech sector job growth, and 316th on population growth. Here, the outsourcing of production to the U.S. South and other countries is likely a major factor. The case of Detroit serves as a warning that patenting alone will not guarantee prosperity; rather it must be combined with other pro-growth attributes that Detroit evidently has been lacking. Invention and Unemployment in Metropolitan Areas While granting that patents add value to a regional economy, some may be concerned about how technology-led productivity growth affects labor demand, since new technologies require few work- ers.87 On the other hand, more productive metro areas have more money available to spend on local services, which should boost job creation. This analysis finds that patent growth is strongly correlated with better employment opportuni- ties. From 1990 to 2010, metro areas with faster growth in patenting had significantly lower average unemployment rates during those two decades. The analysis, which is summarized in Figure 8, was conducted using all metro areas and controlling for changes in college educational attainment rates, population growth, housing price growth, tech sector growth, and predicted industry growth. (The results are shown in more detail in Appendix Table 2). Focusing on just the 100 largest metro areas for ease of comparison, lists those with the highest and lowest patent growth rates. 18 BROOKINGS | February 2013
  • 19. Table 7. Average Unemployment Rates from 1990 to 2010 and Patent Growth in the 100 Largest Metro Areas Unemployment Patent Growth, Change in share of Job growth, Rate, average annual average population with Bachelor’s annual average 1990-2010 1990-2010 or higher, 1990-2010 1990-2010 Metro Areas with the highest growth in patents from 1990 to 2010 Boise City-Nampa, ID 4.6 11.90% 8.40% 2.90% Provo-Orem, UT 4.1 8.90% 9.20% 2.90% Seattle-Tacoma-Bellevue, WA 5.5 8.90% 10.00% 1.20% Raleigh-Cary, NC 4 8.80% 11.40% 2.60% San Jose-Sunnyvale-Santa Clara, CA 5.9 8.10% 12.40% 0.20% Austin-Round Rock-San Marcos, TX 4.3 8.10% 8.70% 3.40% Las Vegas-Paradise, NV 6 7.20% 7.90% 3.80% San Francisco-Oakland-Fremont, CA 5.4 7.00% 11.50% 0.20% Poughkeepsie-Newburgh-Middletown, NY 4.9 6.60% 7.70% 0.40% Tucson, AZ 4.7 6.50% 6.30% 1.70% Average for high growth metro areas 4.9 8.20% 9.30% 1.90% Metro Areas with the lowest growth in patents from 1990 to 2010 Lakeland-Winter Haven, FL 7.1 -1.10% 5.10% 1.10% Pittsburgh, PA 5.6 -1.10% 10.10% 0.30% Buffalo-Niagara Falls, NY 5.9 -1.20% 8.50% -0.10% Toledo, OH 6.8 -1.30% 6.10% -0.20% El Paso, TX 9.2 -1.40% 4.10% 1.40% Dayton, OH 5.7 -1.60% 5.30% -0.60% Tulsa, OK 4.8 -1.70% 5.30% 1.10% Chattanooga, TN-GA 5.1 -2.10% 6.90% 0.60% New Orleans-Metairie-Kenner, LA 6.1 -2.50% 6.40% -0.20% Baton Rouge, LA 5.4 -5.30% 5.20% 1.60% Average for low growth metro areas 6.2 -1.90% 6.30% 0.50% Average for all large metro areas 5.7 2.30% 7.90% 1.00% Source: Brookings analysis of Moody’s Analytic, Bureau of Labor Statistics, Census Bureau Decennial Census, and Strumsky Patent Database. One patent is assigned to metro area if at least one inventor lives there. Metro areas with the fastest growth in patenting tend to have lower unemployment during the period. Boise, Provo, Raleigh, Austin, Poughkeepsie, and Tucson all had high patenting growth and average unemployment rates below five percent; the average for the ten fastest growing metro areas was 4.9 percent. By contrast, large metros with slow patenting growth had an average unemployment rate of 6.2 percent. Places like Buffalo and Dayton represent once strong manufacturing hubs that lost their inventive momentum. Patenting growth is also correlated with job growth, population growth, and increases in educa- tional attainment rates. Yet, closer analysis reveals that education is more important to metro area job growth than patenting, which becomes insignificant. One explanation is that patenting growth only leads to job growth if it draws highly educated workers to the metropolitan area. Overall, the evidence here is that patenting is good for metro area labor markets. The higher pro- ductivity does not seem to come at the expense of workers. Long-run unemployment rates are lower in metro areas with faster patent growth, meaning that opportunities for workers are more prevalent. Net job creation also tends to be higher in metros with higher patenting growth, but this effect is the result of growth in educational attainment. Invention and the Creation of Public Companies During the painfully slow recovery from the Great Recession, many have wondered whether America’s BROOKINGS | February 2013 19
  • 20. entrepreneurial vigor has been sapped.88 If patents are associated with the creation of new products and economic value, they may also help create new companies. That is, in fact, what the data suggest. The effect of patenting on high-technology start-ups can be gleaned by examining the value of Initial Public Offerings (IPOs) occurring in metropolitan areas which have high patenting intensity. IPOs have come to be associated with high-technology start-ups, and are used by companies to raise money for expansion and monetize earlier investments.89 A new database by innovation scholars has identified every tech-sector IPO from 1996 to 2006.90 For this study, the IPO data were matched to metropolitan areas using the zip codes of the companies’ headquarters. As many as 112 of 358 metro- politan areas were home to at least one company that went public between 2000 and 2006. The figure below compares the average per capita value of IPOs, over the 2000 to 2006 period, for metropolitan areas with above and below average patents per capita over the preceding 1996–2000 period to allow time for patents to have an effect. Without inferring causality, those metropolitan areas with higher patent intensity witnessed IPO activity worth more than five times the per capita value. As the appendix discusses, the significant relationship remains after controlling for tech-sector employment shares, population, educational attainment, and output per worker. Looking at either the value or number of IPOs across metropolitan areas, it is clear that patenting activity is highly correlated. Metro areas that patent more generate far more IPOs than those that do not. Table 8 sorts metros areas by those with the most value from IPOs from 2000 to 2006. Large patenting metros like San Jose, San Francisco, and Boston dominate the top five. Baltimore and Las Vegas are the only outliers in the top ten with few patents. Other metro areas with high patenting rates like San Diego, Seattle, and Austin also make the list. Research universities, a scientifically-educated workforce, and collaboration play an important role in driving metropolitan innovation. The evidence presented above is clear that patenting is strongly associated with national and regional economic performance. With so much at stake, it is worth analyzing why some metro areas patent so much more than others, and how others might boost invention. Four factors emerge as particularly Figure 8. Average IPO Value per Capita for Metropolitan Areas with Above and Below Average Patents per Capita. $2,500 $2,278 $2,000 Average Unemployment Rate $1,500 Average per capita value of $1,000 IPOs in metro area, 2000-2006 $446 $500 $0 Metro areas with above Metro areas with below average patenting rate, average patenting rate, 1996–2000 1996–2000 20 BROOKINGS | February 2013