September Market Seminar Par II
•Als PPT, PDF herunterladen•
0 gefällt mir•243 views

part II of todays presentation

Empfohlen
Weitere ähnliche Inhalte
Was ist angesagt?
Was ist angesagt? (13)
Andere mochten auch
Andere mochten auch (20)
Ähnlich wie September Market Seminar Par II
Ähnlich wie September Market Seminar Par II (20)
Mehr von Weichert Realtors
Mehr von Weichert Realtors (20)
Kürzlich hochgeladen
Kürzlich hochgeladen (20)
September Market Seminar Par II
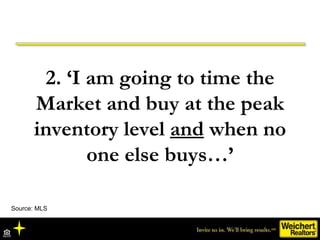
- 1. 2. ‘I am going to time the Market and buy at the peak inventory level and when no one else buys…’ Source: MLS
- 2. Source: MLS Weekly Guests Thru the Weichert Princeton Open Houses, 2007
- 3. Source: MLS Inventory Levels, Princeton, New Jersey, 2007
- 4. 3. ‘I am going to wait until the price comes down further and then make an offer…’ Source: MLS
- 5. Source: trend mls Relationship of Price Reductions to ‘Pending Sales’
- 6. Town by Town Analysis 8/18/09 Towns Active Listings Pending in Last 30 Days Absorption Rate in Months New Listings in 30 Days Net Gain (Loss) to Market Listings Reduced in 30 Days % of Invent. Reduced Expired Listings W/drawn Listings Closed Listings South Brunswick All Styles 208 24 8 43 19 35 16% 27 6 4 South Brunswick Condo/ T.Houses 70 9 7 21 12 19 14 6 3 1 South Brunswick 55+ 31 6 5 2 (4) 4 12 4 0 0 South Brunswick Single Family 109 9 12 20 11 21 19 17 3 0 Monroe: All Styles 487 39 12 92 53 105 21% 41 7 9 Monroe: 55+ 312 29 10 53 24 68 21% 22 6 1 Monroe: Single Family 175 10 21 39 29 37 21% 19 1 0
- 7. Source: trend mls Relationship of Price Reductions to ‘Pending Sales’
- 8. Source: trend mls Relationship of Price Reductions to ‘Pending Sales’
- 9. Source: trend mls Relationship of Price Reductions to ‘Pending Sales’
- 13. Jeff Smith, Gold Services Manager/ Loan Officer Financial Benefits and Process of Home-Ownership.
- 14. ‘ I don’t want to buy a house and then watch it drop in value!’
- 15. Purchase Price $329,000 Loan Amount $317400 Down Payment $11,515 Monthly P&I $1802 Appreciation/Depreciation Home Value 1st Year -3% $319,130 2nd Year 0% $319,130 3rd Year 1% $322,321 4th Year 3% $331,990 5th Year 5% $348,590 5 Year Appreciation/Depreciation $19,500 Tax Benefit Vs Paying Rent @ $1600/mo 1st Year $5,000 $19,200 2nd Year $5,000 $19,200 3rd Year $5,000 $19,200 4th Year $5,000 $19,200 5th Year $5,000 $19,200 5 Year Total $25,000 $96,000 Total Gain $44,200 Create Equity v Pay Rent
- 16. + The Amortization Schedule on a Loan = Total 5 Year Gain: $59,922 Yearly Schedule of Balances and Payments Year Beginning Balance Payment Principal Interest Cumulative Principal Cumulative Interest Ending Balance 2010 $315,646.96 $21,625.92 $4,374.96 $17,250.96 $6,128.00 $24,508.72 $311,272.00 2011 $311,272.00 $21,625.92 $4,621.30 $17,004.62 $10,749.30 $41,513.34 $306,650.70 2012 $306,650.70 $21,625.92 $4,881.98 $16,743.94 $15,631.28 $58,257.28 $301,768.72 2013 $301,768.72 $21,625.92 $5,157.36 $16,468.56 $20,788.64 $74,725.84 $296,611.36 2014 $296,611.36 $21,625.92 $5,448.28 $16,177.64 $26,236.92 $90,903.48 $291,163.08
- 17. Incentive From the Government First-time homebuyers can receive a tax credit up to $8000!
- 18. Tax Credit Overview Distribute NAR Tax Credit Overview handout Amount Ten percent of the cost of home, not to exceed $8,000 Property Any single family residence that will be used as a principal residence Refundable Reduces income tax liability for the year of purchase Income Limit Adjusted gross income of $75,000 single or $150,000 joint tax returns First-Time Must not have owned a principal residence in 3 years prior to purchase
- 20. How much house can I really afford?
- 22. Factors to consider when buying and selling… Source: MLS Inventory(supply and demand) Interest Rates
- 23. Interest Rates Remain Low Source: Freddie Mac
- 24. Joshua D. Wilton, Manager Strategies for Selling
- 25. Understand the Market You’re Selling Out Of Princeton Boro & Twp 5-6 Months Market Absorption Rate indicates a normal market. Active Pending Absorption Rate $0 - $700,000 48 11 4 months $700,000 - $999,000 35 1 35 months $1M - $1.5M 28 4 7 months $1.5M + 59 3 20 months
- 26. The Impact of Pricing on the Salability of Your Home..…
- 27. ‘ Great speech but does it really work?
- 30. 2 . The Effect of Staging on the Value of a Your Home .
- 31. The process of preparing homes for sale regardless of Price, Location, or Condition To achieve the maximum sales price in the minimum marketing time. The GOAL is to appeal to the broadest range of BUYERS .
- 32. Non-Staged The Way You Live In Your Home…
- 33. … And The Way We Market And Sell A House Are Two Different Things. Staged
- 34. “ The Investment in Home Staging is Always Less than Your First Price Reduction!”
- 35. Non-Staged Buyers Only Know What They See …
- 36. … Not The Way It Is Going To Be. Staged
- 37. Based on a StagedHomes.com survey of over 400 homes across Canada & the Continental US prepared for sale by an Accredited Staging Professional (ASP™) from June 2007 through November 2007.
- 38. Why Promote Home Staging ? The average increase in sales price of an ASP Staged vs. non-Staged home is 6.9% . That is an additional $31,050 on a $450,000 sale.
- 39. The average marketing time of an ASP Staged vs. non-Staged home is 80% less . Why Promote Home Staging ?
- 40. 3. The Effect of ‘ Pre-Inspection’ on the Sale of Your Home.
- 41. What is ‘ Pre-Inspection?’
- 42. Home Inspection WHAT DOES PRE-INSPECTION INCLUDE? The standard home inspector's report will review the condition of the home's heating system, central air conditioning system (temperature permitting), interior plumbing and electrical systems; the roof, attic, and visible insulation; walls, ceilings, floors, windows and doors; the foundation, basement, and visible structure.
- 43. PRE-LISTING Home Inspection DOESN’T THE BUYER DO THE HOME INSPECTION?
- 44. All Negotiations, including real estate, are all about negotiation and control. Who is in control? Right Price Right Staging All Repairs are done in advance. Offer a Home Warranty to the buyer..
- 45. PRE-LISTING Home Inspection Data on where most sales fall apart: attorney review, home inspection. Fall Thru Percentage 2007: 26% Fall Thru Percentage 2008: 10.2% .
- 46. Home Improvements I am moving out of the house, I do not want spend too much money to move. Or I just spent $$ on a new kitchen, I want $$$$$$ back on that investment when I move.
- 49. Reality of today’s market is that you will see the return on your investment not in an inflated sales price but in retaining the highest percentage of your list price and staying on the market the fewest # of days. Please consult with your Realtor & staging professional as to which improvements you should finish to make your home the most salable.
- 50. Weichert Family of Companies What will a real estate company do for me?
- 51. Making Your Purchase as Smooth as Possible Buying a home involves the careful coordination of many people. Choosing a real estate team you can count on will make the process smoother and easier.
- 55. Become a Fan! www.facbook.com/weichertprinceton www.slideshare.net/jdwilton www.twitter.com/joshuawilton Presentation available at all 3 sites, download file through Monday.
- 60. Good Luck with your Move!
Hinweis der Redaktion
- 28
- Create your own table to approach the aspects of the marketplace that you consider most relevant and valuable to your associates. For ideas on what to cover, refer to the tables in the Planning Day Presentation on your Planning Day 2005 CD. For example, you might discuss the market conditions of different communities or price ranges each week.
- Review the generic sample calculation and/or a customized calculation you prepared for your office market area. Follow the instructions below to update this slide with customized information for your office. Save the Sales Meeting Guide presentation to your C drive. Open the Sales Meeting Guide presentation from your C drive. Scroll down to the “Sample Market Absorption Rate” slide in the weekly training section of the presentation. Double-click on the slide to be able to make edits. Click in each section of the formula to edit text. Save the document to save edits.
- Review the generic sample calculation and/or a customized calculation you prepared for your office market area. Follow the instructions below to update this slide with customized information for your office. Save the Sales Meeting Guide presentation to your C drive. Open the Sales Meeting Guide presentation from your C drive. Scroll down to the “Sample Market Absorption Rate” slide in the weekly training section of the presentation. Double-click on the slide to be able to make edits. Click in each section of the formula to edit text. Save the document to save edits.
- New Stats Pulled Off StagedHomes.com
- Review the generic sample calculation and/or a customized calculation you prepared for your office market area. Follow the instructions below to update this slide with customized information for your office. Save the Sales Meeting Guide presentation to your C drive. Open the Sales Meeting Guide presentation from your C drive. Scroll down to the “Sample Market Absorption Rate” slide in the weekly training section of the presentation. Double-click on the slide to be able to make edits. Click in each section of the formula to edit text. Save the document to save edits.
- Review the generic sample calculation and/or a customized calculation you prepared for your office market area. Follow the instructions below to update this slide with customized information for your office. Save the Sales Meeting Guide presentation to your C drive. Open the Sales Meeting Guide presentation from your C drive. Scroll down to the “Sample Market Absorption Rate” slide in the weekly training section of the presentation. Double-click on the slide to be able to make edits. Click in each section of the formula to edit text. Save the document to save edits.
- Review the generic sample calculation and/or a customized calculation you prepared for your office market area. Follow the instructions below to update this slide with customized information for your office. Save the Sales Meeting Guide presentation to your C drive. Open the Sales Meeting Guide presentation from your C drive. Scroll down to the “Sample Market Absorption Rate” slide in the weekly training section of the presentation. Double-click on the slide to be able to make edits. Click in each section of the formula to edit text. Save the document to save edits.
- Review the generic sample calculation and/or a customized calculation you prepared for your office market area. Follow the instructions below to update this slide with customized information for your office. Save the Sales Meeting Guide presentation to your C drive. Open the Sales Meeting Guide presentation from your C drive. Scroll down to the “Sample Market Absorption Rate” slide in the weekly training section of the presentation. Double-click on the slide to be able to make edits. Click in each section of the formula to edit text. Save the document to save edits.
- Review the generic sample calculation and/or a customized calculation you prepared for your office market area. Follow the instructions below to update this slide with customized information for your office. Save the Sales Meeting Guide presentation to your C drive. Open the Sales Meeting Guide presentation from your C drive. Scroll down to the “Sample Market Absorption Rate” slide in the weekly training section of the presentation. Double-click on the slide to be able to make edits. Click in each section of the formula to edit text. Save the document to save edits.