SlideShare ist ein Scribd-Unternehmen logo
1 von 17
Downloaden Sie, um offline zu lesen
2008 Consolidated Results


       3.74                                    Leverage

                  2.89
                             2.77


                                        2.31

                                                         1.95
                                                      1.96
JBS lives an intense process of deleverage reducing

the net debt / EBITDA ratio from 3.74x in 2007 to

1.95x in 2008.

  4Q07        1Q08       2Q08       3Q08       4Q08             1Q09


    February 20th, 2009

    JBS S.A.
    “In God we Trust”
Presenters


       Joesley Mendonça Batista
                        CEO


         Jeremiah O’Callaghan
              Investor Relations Director


             Rodrigo Gagliardi
             Investor Relations Manager
                                            1
Our Values
The Foundation Of Our Culture
           Planning

         Determination

          Discipline

          Availability

          Openness

           Simplicity

                                2
Agenda


2008 Highlights


Debt Profile


Consolidated Results


Questions and Answers


                        3
2008 Highlights


•   JBS lives an intense process of deleverage reducing the net debt / EBITDA ratio from 3.74x in 2007
    to 1.95x in 2008.

•   Adjusted pro forma net income in 2008 of R$1.05 billion, if adjusted by the exchange variation of
    foreign investments and excluded the goodwill amortization.

•   Net revenue increased 114.5% YoY from R$14.1 billion in 2007 to R$30.3 billion in 2008.

•   EBITDA YOY increased 95.6% from R$591.1 million in 2007 to R$1,156.1 million in 2008.

•   Proposed dividend distribution has increased threefold from R$17.5 million in 2007 to R$51.1
    million in 2008.

•   Integration of the Tasman Group, of Smithfield Beef and the Five Rivers Feedlot grew the global
    production platform of JBS as well as increasing penetration in the world market while introducing
    cost cutting synergies.

•   Distribution network of INALCA JBS enhanced the contact with customers in Africa and Eastern
    Europe.

•   Proven risk control and management policy preserved the financial health of JBS during a period of
    uncertainty and high volatility particularly during the second semester of 2008.
                                                                                                         4

                                                                                                             4
Debt Profile – 4Q08


  • The Administration of the Company is secure that even if the present financial crisis has not abated, the Company will not have
      difficulties in refinancing its short term debt and believes that in the final analysis there will be a possible increase in the cost of the
      debt.

JBS S.A. Consolidated (R$ million)                                                                                  Probable Scenario

                                                                           Short Term Debt
 Short Term Debt
                                                                   1Q09 2Q09 3Q09 4Q09        Total         %**     1Q09     2Q09    3Q09    4Q09
 Financing for purchase of fixed assets
 FINAME / FINEM - Enterprise financing                               11    11    11     59            91     100%       11      11      11      59
 Notes Payable                                                        1     1     1      2             5     100%        1       1       1       2
 Subtotal 1                                                          12    12    11     61            96    100%        12      12      11      61

 Loans for working capital purposes
 ACC - Exchange advance contracts                                   214   322   150     29         715         0%        -       -       -           -
 EXIM - BNDES export credit facility                                 72     0     0      0          72       100%       72       -       -           -
 Fixed Rate Notes with final maturity in February 2011                9     -      -      -          9       100%        9       -       -           -
 Working Capital - American Dollars *                                33    71     0      0         104         0%        -       -       -           -
 Working Capital - Australian Dollars                                86    74     0       -        160         0%        -       -       -           -
 Working Capital - Euros ***                                          1    11     2    288         302         0%        -       -       -           -
 Working Capital - Reais                                             51     -      -      -         51         0%        -       -       -           -
 Export prepayment                                                  160    16    16     16         208         0%        -       -       -           -
 Fixed Rate Notes with final maturity February 2016 (144-A)           -    30      -      -         30       100%        -      30       -           -
 NCE / COMPROR                                                      330     -   100     37         467         0%        -       -       -           -
 Subtotal 2                                                         957   524   268    371       2.119        5%        81      30       0           0

  Total                                                             969   536   279    431       2.215        9%        93      42      11      61

  Amortization of Short Term Debt                                                                2.215                                         207

Cash, cash equivalents and Short-term investments 12/31/2008                                     2.292              2.199    2.157   2.145   2.085
Working Capital                                                                                  2.704


* Including Finimp
** Percentual to be paid in the period.
 *** Working Capital due short term and automatically renewable.


                                                                                                                                                         5
2008 Consolidated Results


                Net Sales Revenue (R$ million)
                Net Sales Revenue (R$ million)           EBITDA and EBITDA Margin (R$ million)
                                                         EBITDA and EBITDA Margin (R$ million)


                                                                         14.2%
                                              30,340.3


                                                          9.6%
                                                                                                   1,156.1


                                                                                        4.2%           3.8%

                                   14,141.6
                                                                         564.9          591.1


                                                         345.1                                 95.6%
                                        114.5%
     3,577.1             3,967.6
                                                                 63.7%           4.6%
                 10.9%         256.4%


      12M05              12M06      12M07     12M08      12M05           12M06          12M07      12M08

Source: JBS
     EBITDA Margin (%)                                                                                        6
2008 Consolidated Results by Quarter


               Net Sales Revenue (R$ million)
               Net Sales Revenue (R$ million)                            EBITDA and Margin (R$ million)
                                                                         EBITDA and Margin (R$ million)


                                                                                                         6.1%

                                                                                        4.1%
                                                                             3.0%                                2.8%
                                                                  1.4%
                                                        9,633.2                                      470.5


                                              7,771.5
                                 7,129.5
   6,650.7
                    5,859.1                                                              290.8
                                                                                                                  265.9

                                                                             176.3
             -11.9%           21.7%        9.0%     24.0%
                                                                  94.8
                                                                         86.0%       64.9%       61.8%       -43.5%


    4Q07             1Q08         2Q08        3Q08      4Q08      4Q07      1Q08        2Q08         3Q08         4Q08

                                                                                         180.5%
Source JBS
     EBITDA Margin (%)
                                                                                                                          7
Performance by Business Unit

          JBS USA (Beef)
       Including Australia                   JBS USA (Pork)                           INALCA JBS                 JBS MERCOSUL
             Net Sales
             Net Sales                               Net Sales
                                                     Net Sales                          Net Sales
                                                                                        Net Sales                        Net Sales
                                                                                                                         Net Sales
             (US$ million)                         (US$ million)                        (€ million)                     (R$ million)
             (US$ million)                         (US$ million)                        (€ million)                     (R$ million)


                           2.8     2.8                           682                                                                      1.8
                  2.6                                                                                  162
 2.3                                                     620            600                                                                        1.6
                                           598    536                                   140    143                            1.4
           1.9                                                                 132                             1.3     1.3


4Q07       1Q08   2Q08     3Q08    4Q08    4Q07   1Q08    2Q08   3Q08   4Q08   1Q08     2Q08   3Q08    4Q08   4Q07     1Q08   2Q08        3Q08     4Q08


     EBITDA (US$ mi)
     EBITDA (US$ mi)                          EBITDA (US$ mi)
                                              EBITDA (US$ mi)                         EBITDA (€ mi)
                                                                                      EBITDA (€ mi)                  EBITDA (R$ mi)
                                                                                                                     EBITDA (R$ mi)
      margin EBITDA
      margin EBITDA                            margin EBITDA
                                               margin EBITDA                          margin EBITDA
                                                                                      margin EBITDA                  margin EBITDA
                                                                                                                     margin EBITDA


                    5.1%   5.6%                                  7.6%
                                           6.8%                                                                 1 %
                                                                                                                 5.1
                                                                               5.6%                    5.1%
                                                                        4.3%            4.7%    5.3%
                                    2.2%
                                                  2.9%   3.2%
                                                                                                                          10.4%
          -0,1%
                                                                                                                                            5.6%
                                                                                                                                  4.1%             4.3%
  -3.7%
                           155.6
                  132.9                                          52.1
                                                                                               7.6     8.3    199,1
                                                                               7.4
                                   60.4    40.5                                          6.6
                                                                                                                      132.7
                                                                        25.6                                                             102.2
          -0.9                                           19.9                                                                                      69.4
                                                  15.7                                                                        58,2
-84.5
4Q07       1Q08    2Q08    3Q08    4Q08    4Q07   1Q08   2Q08    3Q08   4Q08   1Q08     2Q08   3Q08    4Q08   4Q07     1Q08   2Q08        3Q08     4Q08


Source JBS
                                                                                                                                                          8
     EBITDA Margin (%)
Debt Profile


•    JBS’s Net debt in relation to its               Net Debt / EBITDA Pro Forma per TRIMESTER
     EBITDA (last twelve months pro
     forma) is affected by weak results in                Net Debt = R$ 3,325 MM
                                                         Net Debt = R$ 3,325 MM
                                                                                            = 1,95
                                                                                              1.95
                                                                                           = 1.95
                                                  EBITDA pro forma = R$ 1,706 MM
     the 4th quarter 2007 and 1st                EBITDA pro forma = R$ 1,706 MM

     quarter 2008.
                                                       3.74

•    Good results expected for 1st
     quarter 2009 will reduce the                                2.89
                                                                          2.77
     relation between Net Debt over
     Ebtida.                                                                     2.31
                                                                                               *
                                                                                          1.95


Exchange Rate:
R$ / US$ = 2.34 – 12/31/2008
                                                 4Q07        1Q08       2Q08   3Q08     4Q08     1Q09
US$ / €$ = 1.39 – 12/31/2008
                                             Source: JBS
                                                  Net Debt / EBITDA
                                                                                                        9
JBS USA Beef EBITDA Margin Evolution


                                                                                EBITDA Margin (%)
                                                                                EBITDA Margin (%)

                          Peers Average Beef USA                                                                                    6.4%
                          JBS Beef USA
                                                                                                                         4.2%
    3.6%                                                                                                                            5.3%
                      2.3%                                                                                                                      2.0%
                                                                                                                            3.2%
                                                                        1.3%          1.3%
    0.9%                               0.9%                                                               0.9%
                      0.7%
                                                      -0.4%
                                                                                                                                                1.1%

                                                                        -0.4%
                                                                                    -0.7%     -0.9%
                                     -1.2%                                                                       -1.3%          7.3 p.p Gain
                                                       -1.7%


                                                                                                      -5.3%

    FY03*            FY04*            FY05*            FY06*             FY07*       3Q07**   4Q07**          1Q08**     2Q08**    3Q08**      4Q08**


                           Previous Management                                                            JBS S.A. Management
Source: JBS and estimates of JBS based upon public data from peers
EBITDA margins of the Companies taking into consideration beef only in the US
*Fiscal years for the Companies differ one from the other:
FY Tyson: October to September
FY Smithfield: May to April
FY National Beef: September to August
FY JBS USA: June to May (altered after the acquisition)
**The relevant quarterly period and adjustments made to the calendar year                                                                               10
Consolidated Gross Revenue Distribution


   Revenue Distribution by Business Units 12M08
   Revenue Distribution by Business Units 12M08                        Revenue Distribution by Market 12M08
                                                                       Revenue Distribution by Market 12M08


                              Beef Italy
               Beef Australia   5%           Beef Argentina
                   12%                            3%

              Pork USA                     Beef Brazil                       Exports
                                                                              32%
                14%                          19%
                                                                                             Domestic Market
                                                                                                 68%
                             Beef USA
                               47%


Source: JBS                                                   Source: JBS


                                                                                                               11
Consolidated Exports Distribution


                                  Exports Distribution 12M08
                                  Exports Distribution 12M08


               China               Others                           Mexico
            USA 3%                  15%                              18%
            3%                                                                      Russia
    Taiwan                                                                           13%
      4%                                                                     E.U,
                         Middle East     Canada           Japan              11%
South Korea                 7%             8%              9%
    4%


       Hong Kong
          5%


   Source: JBS                 Exports JBS 12M08: US$ 5.6 billion


                                                                                             12
Enterprise Value and EBITDA Multiple


          SMITHFIELD BEEF ACQUISITION
          SMITHFIELD BEEF ACQUISITION              SWIFT USA ACQUISITION
                                                   SWIFT USA ACQUISITION

                                  EV / EBITDA                        EV / EBITDA
  US$565.0 mm                                   US$1,458.8 mm


                                                    15.1x

               8.1x
                                                                   370.5
                                 3.5x
                                                                   3.9x


                                163.1

                                                    96.3
              70.0
                         133%                               285%

              Oct-07            Dec-08             Jul-07          Dec-08

Source: JBS

                                                                                   13
Final Considerations


• Commitment from the Management to reduce the leverage of the
 Company.


• Appropriate liquidity level.


• We will continue to grow. We see the present crisis as an immense
 opportunity.


• Regardless of the negative aspects of the present macroeconomic
 scenario, the Management of this Company forecasts substantially
 improved consolidated operational results for 2009.


• Planning and discipline contributed to risk reduction.

                                                                      14
Questions & Answers


       3.74                                    Leverage

                  2.89
                             2.77


                                        2.31

                                                         1.95
                                                      1.96
JBS lives an intense process of deleverage reducing

the net debt / EBITDA ratio from 3.74x in 2007 to

1.95x in 2008.

  4Q07        1Q08       2Q08       3Q08       4Q08             1Q09


    February 20th, 2009

    JBS S.A.
    “In God we Trust”
Disclaimer


The forward-looking statements presented herein are subject to risks and uncertainties. These
statements are based on the beliefs and assumptions of our management, and on information
currently available to us.

Forward-looking statements are not guarantees of performance. They involve risks, uncertainties
and assumptions because they relate to future events and therefore depend on circumstances that
may or may not occur. Our future operating results, financial condition, strategies, market share
and values may differ materially from those expressed in or suggested by these forward-looking
statements. Many of the factors that will determine these results and values are beyond our
ability to control or predict.

Forward-looking statements also include information concerning our possible or assumed future
operating results, as well as statements preceded by, followed by, or including the words
''believes,'' ''may,'' ''will,'' ''continues,'' ''expects,'‘ ''anticipates,'' ''intends,'' ''plans,''
''estimates'' or similar expressions.

Weitere ähnliche Inhalte

Was ist angesagt?

BNSF 96 annrpt
BNSF 96 annrptBNSF 96 annrpt
BNSF 96 annrptfinance16
 
VTB Capital "Russia Calling: London Session May-June 2011
VTB Capital "Russia Calling: London Session May-June 2011VTB Capital "Russia Calling: London Session May-June 2011
VTB Capital "Russia Calling: London Session May-June 2011MRSK Centre
 
15 09-2008 Almir Guilherme Barbassa - Supply Chain for the Pre-salt Developme...
15 09-2008 Almir Guilherme Barbassa - Supply Chain for the Pre-salt Developme...15 09-2008 Almir Guilherme Barbassa - Supply Chain for the Pre-salt Developme...
15 09-2008 Almir Guilherme Barbassa - Supply Chain for the Pre-salt Developme...Petrobras
 
viacom Q208%20Web%20Deck%20FINAL%207.29
viacom Q208%20Web%20Deck%20FINAL%207.29viacom Q208%20Web%20Deck%20FINAL%207.29
viacom Q208%20Web%20Deck%20FINAL%207.29finance20
 
Financial analysis - MBIA Inc. provides financial guarantee insurance and …
Financial analysis - MBIA Inc. provides financial guarantee insurance and …Financial analysis - MBIA Inc. provides financial guarantee insurance and …
Financial analysis - MBIA Inc. provides financial guarantee insurance and …BCV
 
BNSF 98 annrpt
BNSF 98 annrptBNSF 98 annrpt
BNSF 98 annrptfinance16
 
BNSF 99 annrpt
BNSF 99 annrptBNSF 99 annrpt
BNSF 99 annrptfinance16
 
fifth third bancorp 5033603C-B0AA-45B0-B2AF-058D5B12B34C_FITB_Citi_012809
fifth third bancorp 5033603C-B0AA-45B0-B2AF-058D5B12B34C_FITB_Citi_012809fifth third bancorp 5033603C-B0AA-45B0-B2AF-058D5B12B34C_FITB_Citi_012809
fifth third bancorp 5033603C-B0AA-45B0-B2AF-058D5B12B34C_FITB_Citi_012809finance28
 
arvinmeritor UBS_Debt_Conference_050907
arvinmeritor UBS_Debt_Conference_050907arvinmeritor UBS_Debt_Conference_050907
arvinmeritor UBS_Debt_Conference_050907finance27
 
Psion Preliminary Results Presentation
Psion Preliminary Results PresentationPsion Preliminary Results Presentation
Psion Preliminary Results PresentationIdea Transplant
 
northrop grumman Slide Presentation 2008 1st
northrop grumman Slide Presentation 2008 1stnorthrop grumman Slide Presentation 2008 1st
northrop grumman Slide Presentation 2008 1stfinance8
 
BNSF 2000 annrpt
BNSF 2000 annrptBNSF 2000 annrpt
BNSF 2000 annrptfinance16
 

Was ist angesagt? (14)

BNSF 96 annrpt
BNSF 96 annrptBNSF 96 annrpt
BNSF 96 annrpt
 
VTB Capital "Russia Calling: London Session May-June 2011
VTB Capital "Russia Calling: London Session May-June 2011VTB Capital "Russia Calling: London Session May-June 2011
VTB Capital "Russia Calling: London Session May-June 2011
 
15 09-2008 Almir Guilherme Barbassa - Supply Chain for the Pre-salt Developme...
15 09-2008 Almir Guilherme Barbassa - Supply Chain for the Pre-salt Developme...15 09-2008 Almir Guilherme Barbassa - Supply Chain for the Pre-salt Developme...
15 09-2008 Almir Guilherme Barbassa - Supply Chain for the Pre-salt Developme...
 
viacom Q208%20Web%20Deck%20FINAL%207.29
viacom Q208%20Web%20Deck%20FINAL%207.29viacom Q208%20Web%20Deck%20FINAL%207.29
viacom Q208%20Web%20Deck%20FINAL%207.29
 
Financial analysis - MBIA Inc. provides financial guarantee insurance and …
Financial analysis - MBIA Inc. provides financial guarantee insurance and …Financial analysis - MBIA Inc. provides financial guarantee insurance and …
Financial analysis - MBIA Inc. provides financial guarantee insurance and …
 
BNSF 98 annrpt
BNSF 98 annrptBNSF 98 annrpt
BNSF 98 annrpt
 
BNSF 99 annrpt
BNSF 99 annrptBNSF 99 annrpt
BNSF 99 annrpt
 
fifth third bancorp 5033603C-B0AA-45B0-B2AF-058D5B12B34C_FITB_Citi_012809
fifth third bancorp 5033603C-B0AA-45B0-B2AF-058D5B12B34C_FITB_Citi_012809fifth third bancorp 5033603C-B0AA-45B0-B2AF-058D5B12B34C_FITB_Citi_012809
fifth third bancorp 5033603C-B0AA-45B0-B2AF-058D5B12B34C_FITB_Citi_012809
 
arvinmeritor UBS_Debt_Conference_050907
arvinmeritor UBS_Debt_Conference_050907arvinmeritor UBS_Debt_Conference_050907
arvinmeritor UBS_Debt_Conference_050907
 
Psion Preliminary Results Presentation
Psion Preliminary Results PresentationPsion Preliminary Results Presentation
Psion Preliminary Results Presentation
 
.credit-suisse - Presentation
 .credit-suisse - Presentation .credit-suisse - Presentation
.credit-suisse - Presentation
 
northrop grumman Slide Presentation 2008 1st
northrop grumman Slide Presentation 2008 1stnorthrop grumman Slide Presentation 2008 1st
northrop grumman Slide Presentation 2008 1st
 
BNSF 2000 annrpt
BNSF 2000 annrptBNSF 2000 annrpt
BNSF 2000 annrpt
 
1 Q09 Investor Presentation
1 Q09 Investor Presentation1 Q09 Investor Presentation
1 Q09 Investor Presentation
 

Andere mochten auch

Earnings Results 2Q07
Earnings Results 2Q07Earnings Results 2Q07
Earnings Results 2Q07JBS RI
 
2007 Results Presentation
2007 Results Presentation2007 Results Presentation
2007 Results PresentationJBS RI
 
1Q08 Results Presentation
1Q08 Results Presentation1Q08 Results Presentation
1Q08 Results PresentationJBS RI
 
Presentation jbs sep oct english 2 q12
Presentation jbs sep oct english 2 q12Presentation jbs sep oct english 2 q12
Presentation jbs sep oct english 2 q12JBS RI
 
Presentation jbs bonds fixed income ingl
Presentation jbs bonds fixed income inglPresentation jbs bonds fixed income ingl
Presentation jbs bonds fixed income inglJBS RI
 
Presentation jbs fixed income
Presentation jbs fixed incomePresentation jbs fixed income
Presentation jbs fixed incomeJBS RI
 
Jbs presentation 3 q10
Jbs presentation 3 q10Jbs presentation 3 q10
Jbs presentation 3 q10JBS RI
 
Presentation jbs s.a. february 2010
Presentation jbs s.a.   february 2010Presentation jbs s.a.   february 2010
Presentation jbs s.a. february 2010JBS RI
 
Presentation 2 q12 conference call v1(1)
Presentation 2 q12 conference call v1(1)Presentation 2 q12 conference call v1(1)
Presentation 2 q12 conference call v1(1)JBS RI
 

Andere mochten auch (9)

Earnings Results 2Q07
Earnings Results 2Q07Earnings Results 2Q07
Earnings Results 2Q07
 
2007 Results Presentation
2007 Results Presentation2007 Results Presentation
2007 Results Presentation
 
1Q08 Results Presentation
1Q08 Results Presentation1Q08 Results Presentation
1Q08 Results Presentation
 
Presentation jbs sep oct english 2 q12
Presentation jbs sep oct english 2 q12Presentation jbs sep oct english 2 q12
Presentation jbs sep oct english 2 q12
 
Presentation jbs bonds fixed income ingl
Presentation jbs bonds fixed income inglPresentation jbs bonds fixed income ingl
Presentation jbs bonds fixed income ingl
 
Presentation jbs fixed income
Presentation jbs fixed incomePresentation jbs fixed income
Presentation jbs fixed income
 
Jbs presentation 3 q10
Jbs presentation 3 q10Jbs presentation 3 q10
Jbs presentation 3 q10
 
Presentation jbs s.a. february 2010
Presentation jbs s.a.   february 2010Presentation jbs s.a.   february 2010
Presentation jbs s.a. february 2010
 
Presentation 2 q12 conference call v1(1)
Presentation 2 q12 conference call v1(1)Presentation 2 q12 conference call v1(1)
Presentation 2 q12 conference call v1(1)
 

Ähnlich wie 2008 Conference Call Presentation

northrop grumman Q3 08 Earnings Presentation
northrop grumman	Q3 08 Earnings Presentationnorthrop grumman	Q3 08 Earnings Presentation
northrop grumman Q3 08 Earnings Presentationfinance8
 
northrop grumman Slide Presentation 2008 3rd
northrop grumman  Slide Presentation 2008 3rdnorthrop grumman  Slide Presentation 2008 3rd
northrop grumman Slide Presentation 2008 3rdfinance8
 
Credit suisse event_presentation
Credit suisse event_presentationCredit suisse event_presentation
Credit suisse event_presentationrisantander
 
Apresentação do evento santander securities – 17 e 18052010
Apresentação do evento santander securities – 17 e 18052010Apresentação do evento santander securities – 17 e 18052010
Apresentação do evento santander securities – 17 e 18052010risantander
 
shaw group 656631FE-D4E6-4F14-A3DB-B8C5E6B7BB07_1Q2009
shaw group 656631FE-D4E6-4F14-A3DB-B8C5E6B7BB07_1Q2009shaw group 656631FE-D4E6-4F14-A3DB-B8C5E6B7BB07_1Q2009
shaw group 656631FE-D4E6-4F14-A3DB-B8C5E6B7BB07_1Q2009finance36
 
shaw group 656631FE-D4E6-4F14-A3DB-B8C5E6B7BB07_1Q2009
shaw group 656631FE-D4E6-4F14-A3DB-B8C5E6B7BB07_1Q2009shaw group 656631FE-D4E6-4F14-A3DB-B8C5E6B7BB07_1Q2009
shaw group 656631FE-D4E6-4F14-A3DB-B8C5E6B7BB07_1Q2009finance36
 
viacom FINAL%20Q108%20Web%20Deck
viacom FINAL%20Q108%20Web%20Deckviacom FINAL%20Q108%20Web%20Deck
viacom FINAL%20Q108%20Web%20Deckfinance20
 
Exchange Income Corporation AGM presentation
Exchange Income Corporation AGM presentationExchange Income Corporation AGM presentation
Exchange Income Corporation AGM presentationTMX Equicom
 
credit-suisse Slides - Presentation to analysts and media
credit-suisse Slides - Presentation to analysts and mediacredit-suisse Slides - Presentation to analysts and media
credit-suisse Slides - Presentation to analysts and mediaQuarterlyEarningsReports2
 
Angel Ron presenta los resultados del tercer trimestre 2012
Angel Ron presenta los resultados del tercer trimestre 2012Angel Ron presenta los resultados del tercer trimestre 2012
Angel Ron presenta los resultados del tercer trimestre 2012Banco Popular
 
JPMorgan Chase Third Quarter 2008 Financial Results Conference Call Investor ...
JPMorgan Chase Third Quarter 2008 Financial Results Conference Call Investor ...JPMorgan Chase Third Quarter 2008 Financial Results Conference Call Investor ...
JPMorgan Chase Third Quarter 2008 Financial Results Conference Call Investor ...finance2
 
devon energy 2000 annual
devon energy 2000 annualdevon energy 2000 annual
devon energy 2000 annualfinance23
 
fifth third bancorp 5033603C-B0AA-45B0-B2AF-058D5B12B34C_FITB_Citi_012809
fifth third bancorp 5033603C-B0AA-45B0-B2AF-058D5B12B34C_FITB_Citi_012809fifth third bancorp 5033603C-B0AA-45B0-B2AF-058D5B12B34C_FITB_Citi_012809
fifth third bancorp 5033603C-B0AA-45B0-B2AF-058D5B12B34C_FITB_Citi_012809finance28
 

Ähnlich wie 2008 Conference Call Presentation (20)

northrop grumman Q3 08 Earnings Presentation
northrop grumman	Q3 08 Earnings Presentationnorthrop grumman	Q3 08 Earnings Presentation
northrop grumman Q3 08 Earnings Presentation
 
northrop grumman Slide Presentation 2008 3rd
northrop grumman  Slide Presentation 2008 3rdnorthrop grumman  Slide Presentation 2008 3rd
northrop grumman Slide Presentation 2008 3rd
 
Credit suisse event_presentation
Credit suisse event_presentationCredit suisse event_presentation
Credit suisse event_presentation
 
Apresentação do evento santander securities – 17 e 18052010
Apresentação do evento santander securities – 17 e 18052010Apresentação do evento santander securities – 17 e 18052010
Apresentação do evento santander securities – 17 e 18052010
 
Q1 2009 Earning Report of Banco Santander
Q1 2009 Earning Report of Banco SantanderQ1 2009 Earning Report of Banco Santander
Q1 2009 Earning Report of Banco Santander
 
Q1 2009 Earning Report of Banco Santander
Q1 2009 Earning Report of Banco SantanderQ1 2009 Earning Report of Banco Santander
Q1 2009 Earning Report of Banco Santander
 
shaw group 656631FE-D4E6-4F14-A3DB-B8C5E6B7BB07_1Q2009
shaw group 656631FE-D4E6-4F14-A3DB-B8C5E6B7BB07_1Q2009shaw group 656631FE-D4E6-4F14-A3DB-B8C5E6B7BB07_1Q2009
shaw group 656631FE-D4E6-4F14-A3DB-B8C5E6B7BB07_1Q2009
 
shaw group 656631FE-D4E6-4F14-A3DB-B8C5E6B7BB07_1Q2009
shaw group 656631FE-D4E6-4F14-A3DB-B8C5E6B7BB07_1Q2009shaw group 656631FE-D4E6-4F14-A3DB-B8C5E6B7BB07_1Q2009
shaw group 656631FE-D4E6-4F14-A3DB-B8C5E6B7BB07_1Q2009
 
credit-suisse Presentation slides
credit-suisse Presentation slidescredit-suisse Presentation slides
credit-suisse Presentation slides
 
viacom FINAL%20Q108%20Web%20Deck
viacom FINAL%20Q108%20Web%20Deckviacom FINAL%20Q108%20Web%20Deck
viacom FINAL%20Q108%20Web%20Deck
 
Exchange Income Corporation AGM presentation
Exchange Income Corporation AGM presentationExchange Income Corporation AGM presentation
Exchange Income Corporation AGM presentation
 
credit-suisse Slides - Presentation to analysts and media
credit-suisse Slides - Presentation to analysts and mediacredit-suisse Slides - Presentation to analysts and media
credit-suisse Slides - Presentation to analysts and media
 
3Q07 Presentation
3Q07 Presentation3Q07 Presentation
3Q07 Presentation
 
Resultados bancopopular
Resultados bancopopularResultados bancopopular
Resultados bancopopular
 
Resultados bancopopular
Resultados bancopopularResultados bancopopular
Resultados bancopopular
 
Angel Ron presenta los resultados del tercer trimestre 2012
Angel Ron presenta los resultados del tercer trimestre 2012Angel Ron presenta los resultados del tercer trimestre 2012
Angel Ron presenta los resultados del tercer trimestre 2012
 
JPMorgan Chase Third Quarter 2008 Financial Results Conference Call Investor ...
JPMorgan Chase Third Quarter 2008 Financial Results Conference Call Investor ...JPMorgan Chase Third Quarter 2008 Financial Results Conference Call Investor ...
JPMorgan Chase Third Quarter 2008 Financial Results Conference Call Investor ...
 
devon energy 2000 annual
devon energy 2000 annualdevon energy 2000 annual
devon energy 2000 annual
 
HSBC Global Banking and Markets
HSBC Global Banking and MarketsHSBC Global Banking and Markets
HSBC Global Banking and Markets
 
fifth third bancorp 5033603C-B0AA-45B0-B2AF-058D5B12B34C_FITB_Citi_012809
fifth third bancorp 5033603C-B0AA-45B0-B2AF-058D5B12B34C_FITB_Citi_012809fifth third bancorp 5033603C-B0AA-45B0-B2AF-058D5B12B34C_FITB_Citi_012809
fifth third bancorp 5033603C-B0AA-45B0-B2AF-058D5B12B34C_FITB_Citi_012809
 

Mehr von JBS RI

Presentation 4 q12
Presentation 4 q12Presentation 4 q12
Presentation 4 q12JBS RI
 
Apresentação 4 t12
Apresentação 4 t12Apresentação 4 t12
Apresentação 4 t12JBS RI
 
Presentation jbs conference call 3 q
Presentation jbs  conference call 3 qPresentation jbs  conference call 3 q
Presentation jbs conference call 3 qJBS RI
 
Apresentação jbs day 3 t12 final
Apresentação jbs  day 3 t12 finalApresentação jbs  day 3 t12 final
Apresentação jbs day 3 t12 finalJBS RI
 
Presentation jbs bonds fixed income ingl
Presentation jbs bonds fixed income inglPresentation jbs bonds fixed income ingl
Presentation jbs bonds fixed income inglJBS RI
 
Presentation jbs bonds fixed income port
Presentation jbs bonds fixed income portPresentation jbs bonds fixed income port
Presentation jbs bonds fixed income portJBS RI
 
Apresentação jbs set out português 2 t12
Apresentação jbs set out português 2 t12Apresentação jbs set out português 2 t12
Apresentação jbs set out português 2 t12JBS RI
 
Presentation jbs sep oct english 2 q12
Presentation jbs sep oct english 2 q12Presentation jbs sep oct english 2 q12
Presentation jbs sep oct english 2 q12JBS RI
 
Apresentação jbs set out português 2 t12
Apresentação jbs set out português 2 t12Apresentação jbs set out português 2 t12
Apresentação jbs set out português 2 t12JBS RI
 
Apresentação 2 t12 teleconferência v1(1)
Apresentação 2 t12 teleconferência v1(1)Apresentação 2 t12 teleconferência v1(1)
Apresentação 2 t12 teleconferência v1(1)JBS RI
 
Folder jbs susten_pen_drive final
Folder jbs susten_pen_drive finalFolder jbs susten_pen_drive final
Folder jbs susten_pen_drive finalJBS RI
 
Presentation jbs bonds fixed income port
Presentation jbs bonds fixed income portPresentation jbs bonds fixed income port
Presentation jbs bonds fixed income portJBS RI
 
Presentation 1 q12 conference call
Presentation 1 q12 conference callPresentation 1 q12 conference call
Presentation 1 q12 conference callJBS RI
 
Apresentação 1 t12 teleconferência
Apresentação 1 t12 teleconferênciaApresentação 1 t12 teleconferência
Apresentação 1 t12 teleconferênciaJBS RI
 
Apresentação frangosul ingles
Apresentação frangosul inglesApresentação frangosul ingles
Apresentação frangosul inglesJBS RI
 
Apresentação frangosul português
Apresentação frangosul portuguêsApresentação frangosul português
Apresentação frangosul portuguêsJBS RI
 
Apresentação 4Q11 conference call
Apresentação 4Q11 conference callApresentação 4Q11 conference call
Apresentação 4Q11 conference callJBS RI
 
Apresentação 4T11 teleconferência
Apresentação 4T11 teleconferênciaApresentação 4T11 teleconferência
Apresentação 4T11 teleconferênciaJBS RI
 
Market presentation vigor final
Market presentation vigor finalMarket presentation vigor final
Market presentation vigor finalJBS RI
 
Apresentação ao mercado vigor
Apresentação ao mercado vigorApresentação ao mercado vigor
Apresentação ao mercado vigorJBS RI
 

Mehr von JBS RI (20)

Presentation 4 q12
Presentation 4 q12Presentation 4 q12
Presentation 4 q12
 
Apresentação 4 t12
Apresentação 4 t12Apresentação 4 t12
Apresentação 4 t12
 
Presentation jbs conference call 3 q
Presentation jbs  conference call 3 qPresentation jbs  conference call 3 q
Presentation jbs conference call 3 q
 
Apresentação jbs day 3 t12 final
Apresentação jbs  day 3 t12 finalApresentação jbs  day 3 t12 final
Apresentação jbs day 3 t12 final
 
Presentation jbs bonds fixed income ingl
Presentation jbs bonds fixed income inglPresentation jbs bonds fixed income ingl
Presentation jbs bonds fixed income ingl
 
Presentation jbs bonds fixed income port
Presentation jbs bonds fixed income portPresentation jbs bonds fixed income port
Presentation jbs bonds fixed income port
 
Apresentação jbs set out português 2 t12
Apresentação jbs set out português 2 t12Apresentação jbs set out português 2 t12
Apresentação jbs set out português 2 t12
 
Presentation jbs sep oct english 2 q12
Presentation jbs sep oct english 2 q12Presentation jbs sep oct english 2 q12
Presentation jbs sep oct english 2 q12
 
Apresentação jbs set out português 2 t12
Apresentação jbs set out português 2 t12Apresentação jbs set out português 2 t12
Apresentação jbs set out português 2 t12
 
Apresentação 2 t12 teleconferência v1(1)
Apresentação 2 t12 teleconferência v1(1)Apresentação 2 t12 teleconferência v1(1)
Apresentação 2 t12 teleconferência v1(1)
 
Folder jbs susten_pen_drive final
Folder jbs susten_pen_drive finalFolder jbs susten_pen_drive final
Folder jbs susten_pen_drive final
 
Presentation jbs bonds fixed income port
Presentation jbs bonds fixed income portPresentation jbs bonds fixed income port
Presentation jbs bonds fixed income port
 
Presentation 1 q12 conference call
Presentation 1 q12 conference callPresentation 1 q12 conference call
Presentation 1 q12 conference call
 
Apresentação 1 t12 teleconferência
Apresentação 1 t12 teleconferênciaApresentação 1 t12 teleconferência
Apresentação 1 t12 teleconferência
 
Apresentação frangosul ingles
Apresentação frangosul inglesApresentação frangosul ingles
Apresentação frangosul ingles
 
Apresentação frangosul português
Apresentação frangosul portuguêsApresentação frangosul português
Apresentação frangosul português
 
Apresentação 4Q11 conference call
Apresentação 4Q11 conference callApresentação 4Q11 conference call
Apresentação 4Q11 conference call
 
Apresentação 4T11 teleconferência
Apresentação 4T11 teleconferênciaApresentação 4T11 teleconferência
Apresentação 4T11 teleconferência
 
Market presentation vigor final
Market presentation vigor finalMarket presentation vigor final
Market presentation vigor final
 
Apresentação ao mercado vigor
Apresentação ao mercado vigorApresentação ao mercado vigor
Apresentação ao mercado vigor
 

Kürzlich hochgeladen

2024-04-09 - Pension Playpen roundtable - slides.pptx
2024-04-09 - Pension Playpen roundtable - slides.pptx2024-04-09 - Pension Playpen roundtable - slides.pptx
2024-04-09 - Pension Playpen roundtable - slides.pptxHenry Tapper
 
2024 Q1 Crypto Industry Report | CoinGecko
2024 Q1 Crypto Industry Report | CoinGecko2024 Q1 Crypto Industry Report | CoinGecko
2024 Q1 Crypto Industry Report | CoinGeckoCoinGecko
 
Banking: Commercial and Central Banking.pptx
Banking: Commercial and Central Banking.pptxBanking: Commercial and Central Banking.pptx
Banking: Commercial and Central Banking.pptxANTHONYAKINYOSOYE1
 
What is sip and What are its Benefits in 2024
What is sip and What are its Benefits in 2024What is sip and What are its Benefits in 2024
What is sip and What are its Benefits in 2024prajwalgopocket
 
Financial Preparation for Millennia.pptx
Financial Preparation for Millennia.pptxFinancial Preparation for Millennia.pptx
Financial Preparation for Millennia.pptxsimon978302
 
Financial analysis on Risk and Return.ppt
Financial analysis on Risk and Return.pptFinancial analysis on Risk and Return.ppt
Financial analysis on Risk and Return.ppttadegebreyesus
 
The Inspirational Story of Julio Herrera Velutini - Global Finance Leader
The Inspirational Story of Julio Herrera Velutini - Global Finance LeaderThe Inspirational Story of Julio Herrera Velutini - Global Finance Leader
The Inspirational Story of Julio Herrera Velutini - Global Finance LeaderArianna Varetto
 
10 QuickBooks Tips 2024 - Globus Finanza.pdf
10 QuickBooks Tips 2024 - Globus Finanza.pdf10 QuickBooks Tips 2024 - Globus Finanza.pdf
10 QuickBooks Tips 2024 - Globus Finanza.pdfglobusfinanza
 
Unveiling Poonawalla Fincorp’s Phenomenal Performance Under Abhay Bhutada’s L...
Unveiling Poonawalla Fincorp’s Phenomenal Performance Under Abhay Bhutada’s L...Unveiling Poonawalla Fincorp’s Phenomenal Performance Under Abhay Bhutada’s L...
Unveiling Poonawalla Fincorp’s Phenomenal Performance Under Abhay Bhutada’s L...beulahfernandes8
 
Stock Market Brief Deck FOR 4/17 video.pdf
Stock Market Brief Deck FOR 4/17 video.pdfStock Market Brief Deck FOR 4/17 video.pdf
Stock Market Brief Deck FOR 4/17 video.pdfMichael Silva
 
The top 4 AI cryptocurrencies to know in 2024 .pdf
The top 4 AI cryptocurrencies to know in 2024 .pdfThe top 4 AI cryptocurrencies to know in 2024 .pdf
The top 4 AI cryptocurrencies to know in 2024 .pdfJhon Thompson
 
Kempen ' UK DB Endgame Paper Apr 24 final3.pdf
Kempen ' UK DB Endgame Paper Apr 24 final3.pdfKempen ' UK DB Endgame Paper Apr 24 final3.pdf
Kempen ' UK DB Endgame Paper Apr 24 final3.pdfHenry Tapper
 
The AES Investment Code - the go-to counsel for the most well-informed, wise...
The AES Investment Code -  the go-to counsel for the most well-informed, wise...The AES Investment Code -  the go-to counsel for the most well-informed, wise...
The AES Investment Code - the go-to counsel for the most well-informed, wise...AES International
 
Introduction to Health Economics Dr. R. Kurinji Malar.pptx
Introduction to Health Economics Dr. R. Kurinji Malar.pptxIntroduction to Health Economics Dr. R. Kurinji Malar.pptx
Introduction to Health Economics Dr. R. Kurinji Malar.pptxDrRkurinjiMalarkurin
 
Hello this ppt is about seminar final project
Hello this ppt is about seminar final projectHello this ppt is about seminar final project
Hello this ppt is about seminar final projectninnasirsi
 
NO1 Certified kala jadu karne wale ka contact number kala jadu karne wale bab...
NO1 Certified kala jadu karne wale ka contact number kala jadu karne wale bab...NO1 Certified kala jadu karne wale ka contact number kala jadu karne wale bab...
NO1 Certified kala jadu karne wale ka contact number kala jadu karne wale bab...Amil baba
 
Global Economic Outlook, 2024 - Scholaride Consulting
Global Economic Outlook, 2024 - Scholaride ConsultingGlobal Economic Outlook, 2024 - Scholaride Consulting
Global Economic Outlook, 2024 - Scholaride Consultingswastiknandyofficial
 
Uae-NO1 Pakistani Amil Baba Real Amil baba In Pakistan Najoomi Baba in Pakist...
Uae-NO1 Pakistani Amil Baba Real Amil baba In Pakistan Najoomi Baba in Pakist...Uae-NO1 Pakistani Amil Baba Real Amil baba In Pakistan Najoomi Baba in Pakist...
Uae-NO1 Pakistani Amil Baba Real Amil baba In Pakistan Najoomi Baba in Pakist...Amil baba
 
NO1 Certified Black Magic Specialist Expert In Bahawalpur, Sargodha, Sialkot,...
NO1 Certified Black Magic Specialist Expert In Bahawalpur, Sargodha, Sialkot,...NO1 Certified Black Magic Specialist Expert In Bahawalpur, Sargodha, Sialkot,...
NO1 Certified Black Magic Specialist Expert In Bahawalpur, Sargodha, Sialkot,...Amil baba
 
Market Morning Updates for 16th April 2024
Market Morning Updates for 16th April 2024Market Morning Updates for 16th April 2024
Market Morning Updates for 16th April 2024Devarsh Vakil
 

Kürzlich hochgeladen (20)

2024-04-09 - Pension Playpen roundtable - slides.pptx
2024-04-09 - Pension Playpen roundtable - slides.pptx2024-04-09 - Pension Playpen roundtable - slides.pptx
2024-04-09 - Pension Playpen roundtable - slides.pptx
 
2024 Q1 Crypto Industry Report | CoinGecko
2024 Q1 Crypto Industry Report | CoinGecko2024 Q1 Crypto Industry Report | CoinGecko
2024 Q1 Crypto Industry Report | CoinGecko
 
Banking: Commercial and Central Banking.pptx
Banking: Commercial and Central Banking.pptxBanking: Commercial and Central Banking.pptx
Banking: Commercial and Central Banking.pptx
 
What is sip and What are its Benefits in 2024
What is sip and What are its Benefits in 2024What is sip and What are its Benefits in 2024
What is sip and What are its Benefits in 2024
 
Financial Preparation for Millennia.pptx
Financial Preparation for Millennia.pptxFinancial Preparation for Millennia.pptx
Financial Preparation for Millennia.pptx
 
Financial analysis on Risk and Return.ppt
Financial analysis on Risk and Return.pptFinancial analysis on Risk and Return.ppt
Financial analysis on Risk and Return.ppt
 
The Inspirational Story of Julio Herrera Velutini - Global Finance Leader
The Inspirational Story of Julio Herrera Velutini - Global Finance LeaderThe Inspirational Story of Julio Herrera Velutini - Global Finance Leader
The Inspirational Story of Julio Herrera Velutini - Global Finance Leader
 
10 QuickBooks Tips 2024 - Globus Finanza.pdf
10 QuickBooks Tips 2024 - Globus Finanza.pdf10 QuickBooks Tips 2024 - Globus Finanza.pdf
10 QuickBooks Tips 2024 - Globus Finanza.pdf
 
Unveiling Poonawalla Fincorp’s Phenomenal Performance Under Abhay Bhutada’s L...
Unveiling Poonawalla Fincorp’s Phenomenal Performance Under Abhay Bhutada’s L...Unveiling Poonawalla Fincorp’s Phenomenal Performance Under Abhay Bhutada’s L...
Unveiling Poonawalla Fincorp’s Phenomenal Performance Under Abhay Bhutada’s L...
 
Stock Market Brief Deck FOR 4/17 video.pdf
Stock Market Brief Deck FOR 4/17 video.pdfStock Market Brief Deck FOR 4/17 video.pdf
Stock Market Brief Deck FOR 4/17 video.pdf
 
The top 4 AI cryptocurrencies to know in 2024 .pdf
The top 4 AI cryptocurrencies to know in 2024 .pdfThe top 4 AI cryptocurrencies to know in 2024 .pdf
The top 4 AI cryptocurrencies to know in 2024 .pdf
 
Kempen ' UK DB Endgame Paper Apr 24 final3.pdf
Kempen ' UK DB Endgame Paper Apr 24 final3.pdfKempen ' UK DB Endgame Paper Apr 24 final3.pdf
Kempen ' UK DB Endgame Paper Apr 24 final3.pdf
 
The AES Investment Code - the go-to counsel for the most well-informed, wise...
The AES Investment Code -  the go-to counsel for the most well-informed, wise...The AES Investment Code -  the go-to counsel for the most well-informed, wise...
The AES Investment Code - the go-to counsel for the most well-informed, wise...
 
Introduction to Health Economics Dr. R. Kurinji Malar.pptx
Introduction to Health Economics Dr. R. Kurinji Malar.pptxIntroduction to Health Economics Dr. R. Kurinji Malar.pptx
Introduction to Health Economics Dr. R. Kurinji Malar.pptx
 
Hello this ppt is about seminar final project
Hello this ppt is about seminar final projectHello this ppt is about seminar final project
Hello this ppt is about seminar final project
 
NO1 Certified kala jadu karne wale ka contact number kala jadu karne wale bab...
NO1 Certified kala jadu karne wale ka contact number kala jadu karne wale bab...NO1 Certified kala jadu karne wale ka contact number kala jadu karne wale bab...
NO1 Certified kala jadu karne wale ka contact number kala jadu karne wale bab...
 
Global Economic Outlook, 2024 - Scholaride Consulting
Global Economic Outlook, 2024 - Scholaride ConsultingGlobal Economic Outlook, 2024 - Scholaride Consulting
Global Economic Outlook, 2024 - Scholaride Consulting
 
Uae-NO1 Pakistani Amil Baba Real Amil baba In Pakistan Najoomi Baba in Pakist...
Uae-NO1 Pakistani Amil Baba Real Amil baba In Pakistan Najoomi Baba in Pakist...Uae-NO1 Pakistani Amil Baba Real Amil baba In Pakistan Najoomi Baba in Pakist...
Uae-NO1 Pakistani Amil Baba Real Amil baba In Pakistan Najoomi Baba in Pakist...
 
NO1 Certified Black Magic Specialist Expert In Bahawalpur, Sargodha, Sialkot,...
NO1 Certified Black Magic Specialist Expert In Bahawalpur, Sargodha, Sialkot,...NO1 Certified Black Magic Specialist Expert In Bahawalpur, Sargodha, Sialkot,...
NO1 Certified Black Magic Specialist Expert In Bahawalpur, Sargodha, Sialkot,...
 
Market Morning Updates for 16th April 2024
Market Morning Updates for 16th April 2024Market Morning Updates for 16th April 2024
Market Morning Updates for 16th April 2024
 

2008 Conference Call Presentation

  • 1. 2008 Consolidated Results
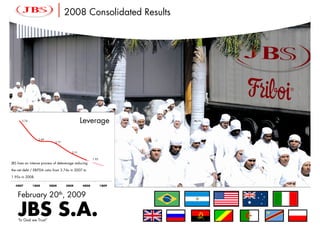
 3.74 Leverage 2.89 2.77 2.31 1.95 1.96 JBS lives an intense process of deleverage reducing the net debt / EBITDA ratio from 3.74x in 2007 to 1.95x in 2008. 4Q07 1Q08 2Q08 3Q08 4Q08 1Q09 February 20th, 2009 JBS S.A. “In God we Trust”
  • 2. Presenters Joesley Mendonça Batista CEO Jeremiah O’Callaghan Investor Relations Director Rodrigo Gagliardi Investor Relations Manager 1
  • 3. Our Values The Foundation Of Our Culture Planning Determination Discipline Availability Openness Simplicity 2
  • 4. Agenda 2008 Highlights Debt Profile Consolidated Results Questions and Answers 3
  • 5. 2008 Highlights • JBS lives an intense process of deleverage reducing the net debt / EBITDA ratio from 3.74x in 2007 to 1.95x in 2008. • Adjusted pro forma net income in 2008 of R$1.05 billion, if adjusted by the exchange variation of foreign investments and excluded the goodwill amortization. • Net revenue increased 114.5% YoY from R$14.1 billion in 2007 to R$30.3 billion in 2008. • EBITDA YOY increased 95.6% from R$591.1 million in 2007 to R$1,156.1 million in 2008. • Proposed dividend distribution has increased threefold from R$17.5 million in 2007 to R$51.1 million in 2008. • Integration of the Tasman Group, of Smithfield Beef and the Five Rivers Feedlot grew the global production platform of JBS as well as increasing penetration in the world market while introducing cost cutting synergies. • Distribution network of INALCA JBS enhanced the contact with customers in Africa and Eastern Europe. • Proven risk control and management policy preserved the financial health of JBS during a period of uncertainty and high volatility particularly during the second semester of 2008. 4 4
  • 6. Debt Profile – 4Q08 • The Administration of the Company is secure that even if the present financial crisis has not abated, the Company will not have difficulties in refinancing its short term debt and believes that in the final analysis there will be a possible increase in the cost of the debt. JBS S.A. Consolidated (R$ million) Probable Scenario Short Term Debt Short Term Debt 1Q09 2Q09 3Q09 4Q09 Total %** 1Q09 2Q09 3Q09 4Q09 Financing for purchase of fixed assets FINAME / FINEM - Enterprise financing 11 11 11 59 91 100% 11 11 11 59 Notes Payable 1 1 1 2 5 100% 1 1 1 2 Subtotal 1 12 12 11 61 96 100% 12 12 11 61 Loans for working capital purposes ACC - Exchange advance contracts 214 322 150 29 715 0% - - - - EXIM - BNDES export credit facility 72 0 0 0 72 100% 72 - - - Fixed Rate Notes with final maturity in February 2011 9 - - - 9 100% 9 - - - Working Capital - American Dollars * 33 71 0 0 104 0% - - - - Working Capital - Australian Dollars 86 74 0 - 160 0% - - - - Working Capital - Euros *** 1 11 2 288 302 0% - - - - Working Capital - Reais 51 - - - 51 0% - - - - Export prepayment 160 16 16 16 208 0% - - - - Fixed Rate Notes with final maturity February 2016 (144-A) - 30 - - 30 100% - 30 - - NCE / COMPROR 330 - 100 37 467 0% - - - - Subtotal 2 957 524 268 371 2.119 5% 81 30 0 0 Total 969 536 279 431 2.215 9% 93 42 11 61 Amortization of Short Term Debt 2.215 207 Cash, cash equivalents and Short-term investments 12/31/2008 2.292 2.199 2.157 2.145 2.085 Working Capital 2.704 * Including Finimp ** Percentual to be paid in the period. *** Working Capital due short term and automatically renewable. 5
  • 7. 2008 Consolidated Results Net Sales Revenue (R$ million) Net Sales Revenue (R$ million) EBITDA and EBITDA Margin (R$ million) EBITDA and EBITDA Margin (R$ million) 14.2% 30,340.3 9.6% 1,156.1 4.2% 3.8% 14,141.6 564.9 591.1 345.1 95.6% 114.5% 3,577.1 3,967.6 63.7% 4.6% 10.9% 256.4% 12M05 12M06 12M07 12M08 12M05 12M06 12M07 12M08 Source: JBS EBITDA Margin (%) 6
  • 8. 2008 Consolidated Results by Quarter Net Sales Revenue (R$ million) Net Sales Revenue (R$ million) EBITDA and Margin (R$ million) EBITDA and Margin (R$ million) 6.1% 4.1% 3.0% 2.8% 1.4% 9,633.2 470.5 7,771.5 7,129.5 6,650.7 5,859.1 290.8 265.9 176.3 -11.9% 21.7% 9.0% 24.0% 94.8 86.0% 64.9% 61.8% -43.5% 4Q07 1Q08 2Q08 3Q08 4Q08 4Q07 1Q08 2Q08 3Q08 4Q08 180.5% Source JBS EBITDA Margin (%) 7
  • 9. Performance by Business Unit JBS USA (Beef) Including Australia JBS USA (Pork) INALCA JBS JBS MERCOSUL Net Sales Net Sales Net Sales Net Sales Net Sales Net Sales Net Sales Net Sales (US$ million) (US$ million) (€ million) (R$ million) (US$ million) (US$ million) (€ million) (R$ million) 2.8 2.8 682 1.8 2.6 162 2.3 620 600 1.6 598 536 140 143 1.4 1.9 132 1.3 1.3 4Q07 1Q08 2Q08 3Q08 4Q08 4Q07 1Q08 2Q08 3Q08 4Q08 1Q08 2Q08 3Q08 4Q08 4Q07 1Q08 2Q08 3Q08 4Q08 EBITDA (US$ mi) EBITDA (US$ mi) EBITDA (US$ mi) EBITDA (US$ mi) EBITDA (€ mi) EBITDA (€ mi) EBITDA (R$ mi) EBITDA (R$ mi) margin EBITDA margin EBITDA margin EBITDA margin EBITDA margin EBITDA margin EBITDA margin EBITDA margin EBITDA 5.1% 5.6% 7.6% 6.8% 1 % 5.1 5.6% 5.1% 4.3% 4.7% 5.3% 2.2% 2.9% 3.2% 10.4% -0,1% 5.6% 4.1% 4.3% -3.7% 155.6 132.9 52.1 7.6 8.3 199,1 7.4 60.4 40.5 6.6 132.7 25.6 102.2 -0.9 19.9 69.4 15.7 58,2 -84.5 4Q07 1Q08 2Q08 3Q08 4Q08 4Q07 1Q08 2Q08 3Q08 4Q08 1Q08 2Q08 3Q08 4Q08 4Q07 1Q08 2Q08 3Q08 4Q08 Source JBS 8 EBITDA Margin (%)
  • 10. Debt Profile • JBS’s Net debt in relation to its Net Debt / EBITDA Pro Forma per TRIMESTER EBITDA (last twelve months pro forma) is affected by weak results in Net Debt = R$ 3,325 MM Net Debt = R$ 3,325 MM = 1,95 1.95 = 1.95 EBITDA pro forma = R$ 1,706 MM the 4th quarter 2007 and 1st EBITDA pro forma = R$ 1,706 MM quarter 2008. 3.74 • Good results expected for 1st quarter 2009 will reduce the 2.89 2.77 relation between Net Debt over Ebtida. 2.31 * 1.95 Exchange Rate: R$ / US$ = 2.34 – 12/31/2008 4Q07 1Q08 2Q08 3Q08 4Q08 1Q09 US$ / €$ = 1.39 – 12/31/2008 Source: JBS Net Debt / EBITDA 9
  • 11. JBS USA Beef EBITDA Margin Evolution EBITDA Margin (%) EBITDA Margin (%) Peers Average Beef USA 6.4% JBS Beef USA 4.2% 3.6% 5.3% 2.3% 2.0% 3.2% 1.3% 1.3% 0.9% 0.9% 0.9% 0.7% -0.4% 1.1% -0.4% -0.7% -0.9% -1.2% -1.3% 7.3 p.p Gain -1.7% -5.3% FY03* FY04* FY05* FY06* FY07* 3Q07** 4Q07** 1Q08** 2Q08** 3Q08** 4Q08** Previous Management JBS S.A. Management Source: JBS and estimates of JBS based upon public data from peers EBITDA margins of the Companies taking into consideration beef only in the US *Fiscal years for the Companies differ one from the other: FY Tyson: October to September FY Smithfield: May to April FY National Beef: September to August FY JBS USA: June to May (altered after the acquisition) **The relevant quarterly period and adjustments made to the calendar year 10
  • 12. Consolidated Gross Revenue Distribution Revenue Distribution by Business Units 12M08 Revenue Distribution by Business Units 12M08 Revenue Distribution by Market 12M08 Revenue Distribution by Market 12M08 Beef Italy Beef Australia 5% Beef Argentina 12% 3% Pork USA Beef Brazil Exports 32% 14% 19% Domestic Market 68% Beef USA 47% Source: JBS Source: JBS 11
  • 13. Consolidated Exports Distribution Exports Distribution 12M08 Exports Distribution 12M08 China Others Mexico USA 3% 15% 18% 3% Russia Taiwan 13% 4% E.U, Middle East Canada Japan 11% South Korea 7% 8% 9% 4% Hong Kong 5% Source: JBS Exports JBS 12M08: US$ 5.6 billion 12
  • 14. Enterprise Value and EBITDA Multiple SMITHFIELD BEEF ACQUISITION SMITHFIELD BEEF ACQUISITION SWIFT USA ACQUISITION SWIFT USA ACQUISITION EV / EBITDA EV / EBITDA US$565.0 mm US$1,458.8 mm 15.1x 8.1x 370.5 3.5x 3.9x 163.1 96.3 70.0 133% 285% Oct-07 Dec-08 Jul-07 Dec-08 Source: JBS 13
  • 15. Final Considerations • Commitment from the Management to reduce the leverage of the Company. • Appropriate liquidity level. • We will continue to grow. We see the present crisis as an immense opportunity. • Regardless of the negative aspects of the present macroeconomic scenario, the Management of this Company forecasts substantially improved consolidated operational results for 2009. • Planning and discipline contributed to risk reduction. 14
  • 16. Questions & Answers 3.74 Leverage 2.89 2.77 2.31 1.95 1.96 JBS lives an intense process of deleverage reducing the net debt / EBITDA ratio from 3.74x in 2007 to 1.95x in 2008. 4Q07 1Q08 2Q08 3Q08 4Q08 1Q09 February 20th, 2009 JBS S.A. “In God we Trust”
  • 17. Disclaimer The forward-looking statements presented herein are subject to risks and uncertainties. These statements are based on the beliefs and assumptions of our management, and on information currently available to us. Forward-looking statements are not guarantees of performance. They involve risks, uncertainties and assumptions because they relate to future events and therefore depend on circumstances that may or may not occur. Our future operating results, financial condition, strategies, market share and values may differ materially from those expressed in or suggested by these forward-looking statements. Many of the factors that will determine these results and values are beyond our ability to control or predict. Forward-looking statements also include information concerning our possible or assumed future operating results, as well as statements preceded by, followed by, or including the words ''believes,'' ''may,'' ''will,'' ''continues,'' ''expects,'‘ ''anticipates,'' ''intends,'' ''plans,'' ''estimates'' or similar expressions.