2. Ecosystem Made up of living and non living parts POND WOODLAND SOIL MOOR Abiotic Food availability Predation Temperature Light intensity Moisture Biotic
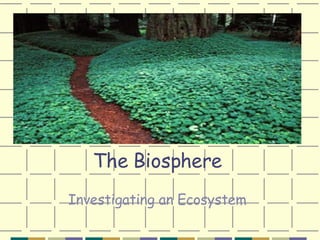
3.
4. Quadrat Estimates the abundance of non moving organisms Throw randomly Count the number of squares an organism is found in Errors ? Non random throwing Counting the same organism over two squares Too few quadrats done
5. LMM Can measure both light intensity and moisture content of a particular area Errors ? Shadow Read wrong scale Stone Too few readings
6. Pitfall Trap Alcohol (if you The samples Killed) Pitfall Trap
20. Also we can change our clothes to best suit the temperature around us. White clothes reflect the heat Animal skin and fur act as insulators and keep heat in.
37. Some plants store their food for winter underground in their roots and stems.
38.
39. Some animals like tortoises, hedgehogs and bears, cannot store food to keep them warm. Instead they go to sleep in a warm sheltered place, such as under pile of old leaves or inside an old tree trunk. This is called hibernation.
40. Energy Flow in a Habitat Plants trap energy converting it to biomass. Producers Plant biomass eaten by animals Primary Consumers Larger animals eat animals that eat plants Secondary Consumers All energy initially comes from the sun as light energy
44. Food Web Write out four food chains found in the food web .
45.
46.
47. Pyramids of Numbers - examples 5000 Dandelions 100 Rabbits 1000 Pea Pods 100 Slugs 10 Frogs 1 Fox 1 Bird
48. Pyramid of Numbers 1 Partridge Now draw the pyramids of numbers for these food chains. 1 Pear Tree 3000 Greenfly 1000 Ladybirds 5000 Dandelions 100 Rabbits 1 Fox 500 Fleas
49. Pyramids of Numbers - examples 2 5000 Dandelions 100 Rabbits 3000 Greenfly 1000 Ladybirds 500 Fleas 1 Tree 1 Partridge 1 Fox
50. Pyramid of Biomass Biomass is how much dry mass is present in each trophic level. For this reason Biomass Pyramids always look the same .
59. Write down what happens to the missing 90% of the energy in a deer ( Kudu) that is not transferred to the lion.
60.
61.
62.
63.
64.
65. Match the words and phrases. A food chain shows Most food chains start with Plants are Animals are Animals that hunt and eat others are called Animals that are caught and eaten are called producers consumers predators prey a green plant what is eaten by what
66.
67.
68. Population Growth The growth rate of a population is the increase in the number of individuals over time. Exponential growth is when the number of individuals grows at a constant rate. Growing bacteria in a lab is a good example
81. What is the cause of these population changes? When hare numbers increase, 2 things happen: 1. Shortage of food for hares 2. Increase in Lynx number (predation)
82. Lynx numbers increase when Hare numbers high, but if food for hares is low and predation is high…………………….. ………… soon the Hare population will crash (drop).
83. (1) Some Lynxes leave ( emigrate) to where food is more plentiful. (2) Lynxes eat other prey when hare numbers low. (3) More competition between Lynxes. A CRASH in the Lynx population This drop in Hare numbers leads to 3 things …
84. Lower Hare numbers – vegetation starts to grow again + Hares have fewer Lynx to watch out for + There is more vegetation to eat SO, the number of Hares begins to increase The PREDATOR PREY cycle begins again MEANWHILE…..
85. Highest peaks always belong to PREY Why? The predator is ALWAYS at a higher level in the pyramid of numbers Than the prey, so the numbers of prey are always HIGHER than predators
89. The Nitrogen Cycle Nitrogen in the air Denitrifying bacteria Eating Nitrates in the soil N 2 fixing bacteria waste NH 3 and its compounds Nitrates absorbed by roots N 2 fixing bacteria Decomposing Fertilisers Nitrifying bacteria Lightning Formation of oxides of nitrogen