SlideShare ist ein Scribd-Unternehmen logo
1 von 12
Histograms
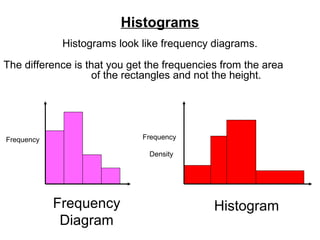
Histograms look like frequency diagrams.
The difference is that you get the frequencies from the area
of the rectangles and not the height.

Frequency

Frequency

Density

Frequency
Diagram

Histogram
Histograms can be used when
the class intervals are unequal.
Time
Frequency
0 < t < 10
20
10 < t < 20
15
20 < t < 30
10
30 < t < 40
9
40 < t < 50
6

Time
Frequency
0 < t < 10
20
10 < t < 15
15
15 < t < 20
10
20 < t < 25
9
25 < t < 40
6

Equal Class Intervals

Unequal Class Intervals
With a histogram you cant not get the
frequency from the height of the bar.
Instead you get the frequency from the area of the bar.
Frequency is equal to the Area of the Bar.
Frequency Density is equal to the Height of the Bar.
frequency
Frequency density =
width of interval
0.4
95
110
105
Width of interval = 10
Height (Frequency density) = 0.4
Area (Frequency) = 4
Find the relevant information for each bar.
0.5

?

10
Width of interval = 10
Frequency density = 0.5
Frequency = 5

1.2

?

?

2

Width of interval = 5
Frequency = 2
Frequency density = 0.4

5

2

8
?

20
Width of interval = 20
Frequency density = 1.2
Frequency = 24

Frequency = 8
Frequency density = 2
Width of interval = 4
Time
Frequency
0 < t < 10
20
10 < t < 15
15
15 < t < 20
10
20 < t < 25
9
25 < t < 40
6

Frequency
Frequency
=
Density
Class width

Frequency
Density

2
3
2
1.8
0.4

20 ÷ 10
15 ÷ 5
10 ÷ 5
9÷5
6 ÷ 15

3.0
2.5
Frequency 2.0
Density
1.5
1.0
0.5
0

Time
0

5

10

15

20

25

30

35

40
Distance

Frequency
0 < t < 20
2
20 < t < 40
4
40 < t < 50
5
50 < t < 70
12
70 < t < 100
9

Frequency
Density

0.1
0.2
0.5
0.6
0.3

2 ÷ 20
4 ÷ 20
5 ÷ 10
12 ÷ 20
9 ÷ 30

0.6
0.5
Frequency
Density

0.4
0.3
0.2
0.1
0

10

20

30

40

50

Distance

60

70

80

90

100
Remember for a histogram the:
Frequency is equal to the Area of the bar.
Frequency Density is equal to the Height of the bar.

0.5

?

1.25

?

0.8

?

15
8
Area = 15 x 0.5 = 7.5

Area = 1.25 x 8 = 10

20
Area = 20 x 0.8 = 16
Copy and complete the table.
Frequency = frequency density × width of interval

Frequency density

2.4
2.0

Time in
seconds

1.6

Frequency
Area
density × (frequency)
width

1.2

95 ≤ t < 105

0.4 × 10

4

0.8

105 ≤ t < 110

1.2 × 5

6

0.4

110 ≤ t < 115

1.4 × 5

7

115 ≤ t < 120

2.2 × 5

11

120 ≤ t < 135

0.4 × 15

6

0
95 100 105 110 115 120 125 130 135
Time in seconds
1.0
0.8
Frequency
Density 0.6

0.4
0.2
0

0

20

40

60

80

100

120

Frequency
0 < t < 40
4
40 < t < 80
8
80 < t < 100
16
100 < t <
12
120
120 < t <
12

140

160

Length

200

40 x 0.1
20 x 0.4
20 x 0.8
20 x 1.0
60 x 0.2

180

Distance
Graph to compare the distances that males and females travel in the car per week.
50
40
30
20
10
0

Distance

0

20

40

60

80

100

120

140

160

180

0

20

40

60

80

100

120

140

160

180 Distance

50
40
30
20
10
0
Length

Frequency

0 < t < 40
40 < t < 80
80 < t < 100
100 < t <
120
120 < t <
200

Length
0 < t < 40
40 < t < 80
80 < t < 100
100 < t <
120
120 < t <
200

Frequency
Review
Write a definition of each word below.
Include methods for calculating.
Data set

Frequency

Class interval

Frequency polygon

Midpoint

Class interval

Range

Histogram

Frequency diagram

Frequency density

Weitere ähnliche Inhalte

Was ist angesagt?

Probability Powerpoint
Probability PowerpointProbability Powerpoint
Probability Powerpointspike2904
 
FREQUENCY DISTRIBUTION.pptx
FREQUENCY DISTRIBUTION.pptxFREQUENCY DISTRIBUTION.pptx
FREQUENCY DISTRIBUTION.pptxSreeLatha98
 
Visualising solid shapes kaustubh singh
Visualising solid shapes kaustubh singhVisualising solid shapes kaustubh singh
Visualising solid shapes kaustubh singhankur solanki
 
Frequency Polygon.pptx
Frequency Polygon.pptxFrequency Polygon.pptx
Frequency Polygon.pptxMeenu M
 
Qt graphical representation of data
Qt   graphical representation of dataQt   graphical representation of data
Qt graphical representation of dataJoel Pais
 
Types of graphs
Types of graphsTypes of graphs
Types of graphsLALIT BIST
 
STATISTICS: Normal Distribution
STATISTICS: Normal Distribution STATISTICS: Normal Distribution
STATISTICS: Normal Distribution jundumaug1
 
Types of data and graphical representation
Types of data and graphical representationTypes of data and graphical representation
Types of data and graphical representationReena Titoria
 
Analysis of variance (ANOVA) everything you need to know
Analysis of variance (ANOVA) everything you need to knowAnalysis of variance (ANOVA) everything you need to know
Analysis of variance (ANOVA) everything you need to knowStat Analytica
 
Numerical & graphical presentation of data
Numerical & graphical presentation of dataNumerical & graphical presentation of data
Numerical & graphical presentation of dataSarfraz Ahmad
 
presentation of data
presentation of datapresentation of data
presentation of dataShafeek S
 
Chapter 2: Frequency Distribution and Graphs
Chapter 2: Frequency Distribution and GraphsChapter 2: Frequency Distribution and Graphs
Chapter 2: Frequency Distribution and GraphsMong Mara
 

Was ist angesagt? (20)

Probability Powerpoint
Probability PowerpointProbability Powerpoint
Probability Powerpoint
 
FREQUENCY DISTRIBUTION.pptx
FREQUENCY DISTRIBUTION.pptxFREQUENCY DISTRIBUTION.pptx
FREQUENCY DISTRIBUTION.pptx
 
Frequency Polygon
Frequency PolygonFrequency Polygon
Frequency Polygon
 
Histogram
HistogramHistogram
Histogram
 
Visualising solid shapes kaustubh singh
Visualising solid shapes kaustubh singhVisualising solid shapes kaustubh singh
Visualising solid shapes kaustubh singh
 
Frequency Polygon.pptx
Frequency Polygon.pptxFrequency Polygon.pptx
Frequency Polygon.pptx
 
Qt graphical representation of data
Qt   graphical representation of dataQt   graphical representation of data
Qt graphical representation of data
 
Types of graphs
Types of graphsTypes of graphs
Types of graphs
 
Binomial distribution
Binomial distributionBinomial distribution
Binomial distribution
 
Frequency distribution
Frequency distributionFrequency distribution
Frequency distribution
 
STATISTICS: Normal Distribution
STATISTICS: Normal Distribution STATISTICS: Normal Distribution
STATISTICS: Normal Distribution
 
Geometric Mean
Geometric MeanGeometric Mean
Geometric Mean
 
Types of data and graphical representation
Types of data and graphical representationTypes of data and graphical representation
Types of data and graphical representation
 
Analysis of variance (ANOVA) everything you need to know
Analysis of variance (ANOVA) everything you need to knowAnalysis of variance (ANOVA) everything you need to know
Analysis of variance (ANOVA) everything you need to know
 
Histogram
HistogramHistogram
Histogram
 
Histograms
HistogramsHistograms
Histograms
 
Graph ppt
Graph pptGraph ppt
Graph ppt
 
Numerical & graphical presentation of data
Numerical & graphical presentation of dataNumerical & graphical presentation of data
Numerical & graphical presentation of data
 
presentation of data
presentation of datapresentation of data
presentation of data
 
Chapter 2: Frequency Distribution and Graphs
Chapter 2: Frequency Distribution and GraphsChapter 2: Frequency Distribution and Graphs
Chapter 2: Frequency Distribution and Graphs
 

Andere mochten auch

Class Interval Histograms
Class Interval HistogramsClass Interval Histograms
Class Interval HistogramsPassy World
 
Histogram equalization
Histogram equalizationHistogram equalization
Histogram equalization11mr11mahesh
 
Histogram Equalization(Image Processing Presentation)
Histogram Equalization(Image Processing Presentation)Histogram Equalization(Image Processing Presentation)
Histogram Equalization(Image Processing Presentation)CherryBerry2
 
05 histogram processing DIP
05 histogram processing DIP05 histogram processing DIP
05 histogram processing DIPbabak danyal
 
Grouped Mean Median Mode
Grouped Mean Median ModeGrouped Mean Median Mode
Grouped Mean Median ModePassy World
 
CBC Histogram DR NARMADA PRASAD TIWARI
 CBC Histogram DR NARMADA PRASAD TIWARI CBC Histogram DR NARMADA PRASAD TIWARI
CBC Histogram DR NARMADA PRASAD TIWARINarmada Tiwari
 
Histogram Equalization
Histogram EqualizationHistogram Equalization
Histogram EqualizationEr. Nancy
 
Histogram equalization
Histogram equalizationHistogram equalization
Histogram equalizationtreasure17
 
Photo analysis (photoshoot)
Photo analysis (photoshoot)Photo analysis (photoshoot)
Photo analysis (photoshoot)laurenwhelanx
 
S S08 D I P Lec07 Pixel Operations
S S08  D I P  Lec07  Pixel OperationsS S08  D I P  Lec07  Pixel Operations
S S08 D I P Lec07 Pixel OperationsNoah Kim
 
Histogram based enhancement
Histogram based enhancementHistogram based enhancement
Histogram based enhancementliba manopriya.J
 
Image Processing(Beta1)
Image Processing(Beta1)Image Processing(Beta1)
Image Processing(Beta1)Thedarkangel1
 
Analyzing Photographs
Analyzing PhotographsAnalyzing Photographs
Analyzing PhotographsN.C. State
 

Andere mochten auch (20)

Class Interval Histograms
Class Interval HistogramsClass Interval Histograms
Class Interval Histograms
 
What is a histogram
What is a histogramWhat is a histogram
What is a histogram
 
Histograms
HistogramsHistograms
Histograms
 
Histogram equalization
Histogram equalizationHistogram equalization
Histogram equalization
 
Histogram
HistogramHistogram
Histogram
 
Histogram Equalization(Image Processing Presentation)
Histogram Equalization(Image Processing Presentation)Histogram Equalization(Image Processing Presentation)
Histogram Equalization(Image Processing Presentation)
 
05 histogram processing DIP
05 histogram processing DIP05 histogram processing DIP
05 histogram processing DIP
 
Bar Graphs
Bar GraphsBar Graphs
Bar Graphs
 
Bar chart
Bar chartBar chart
Bar chart
 
Grouped Mean Median Mode
Grouped Mean Median ModeGrouped Mean Median Mode
Grouped Mean Median Mode
 
CBC Histogram DR NARMADA PRASAD TIWARI
 CBC Histogram DR NARMADA PRASAD TIWARI CBC Histogram DR NARMADA PRASAD TIWARI
CBC Histogram DR NARMADA PRASAD TIWARI
 
7 qc toolsTraining pdf
7 qc toolsTraining pdf7 qc toolsTraining pdf
7 qc toolsTraining pdf
 
Histogram Equalization
Histogram EqualizationHistogram Equalization
Histogram Equalization
 
Histogram equalization
Histogram equalizationHistogram equalization
Histogram equalization
 
Photo analysis (photoshoot)
Photo analysis (photoshoot)Photo analysis (photoshoot)
Photo analysis (photoshoot)
 
RBC Group
RBC GroupRBC Group
RBC Group
 
S S08 D I P Lec07 Pixel Operations
S S08  D I P  Lec07  Pixel OperationsS S08  D I P  Lec07  Pixel Operations
S S08 D I P Lec07 Pixel Operations
 
Histogram based enhancement
Histogram based enhancementHistogram based enhancement
Histogram based enhancement
 
Image Processing(Beta1)
Image Processing(Beta1)Image Processing(Beta1)
Image Processing(Beta1)
 
Analyzing Photographs
Analyzing PhotographsAnalyzing Photographs
Analyzing Photographs
 

Ähnlich wie Histograms

RiseFalltime031114.pptx
RiseFalltime031114.pptxRiseFalltime031114.pptx
RiseFalltime031114.pptxVignesh899811
 
Handling_Data-_Frequency_Diagrams_and_Frequency_Polygons.pptx
Handling_Data-_Frequency_Diagrams_and_Frequency_Polygons.pptxHandling_Data-_Frequency_Diagrams_and_Frequency_Polygons.pptx
Handling_Data-_Frequency_Diagrams_and_Frequency_Polygons.pptxGabriela162538
 
CNIM Questions related to Mathematics and Formulas
CNIM Questions related to Mathematics and Formulas CNIM Questions related to Mathematics and Formulas
CNIM Questions related to Mathematics and Formulas Anurag Tewari MD
 
Descriptive Statistics Part II: Graphical Description
Descriptive Statistics Part II: Graphical DescriptionDescriptive Statistics Part II: Graphical Description
Descriptive Statistics Part II: Graphical Descriptiongetyourcheaton
 
signal homework
signal homeworksignal homework
signal homeworksokok22867
 
Reverberation time
Reverberation timeReverberation time
Reverberation timeManoj Mota
 
Time-Frequency Representation of Microseismic Signals using the SST
Time-Frequency Representation of Microseismic Signals using the SSTTime-Frequency Representation of Microseismic Signals using the SST
Time-Frequency Representation of Microseismic Signals using the SSTUT Technology
 
MR IMAGE QUALITY PARAMETERS.pptx
MR IMAGE QUALITY PARAMETERS.pptxMR IMAGE QUALITY PARAMETERS.pptx
MR IMAGE QUALITY PARAMETERS.pptxKoti Damodara Naidu
 
01 beginning vibration analysis
01 beginning vibration analysis01 beginning vibration analysis
01 beginning vibration analysisDương Phúc
 
beginning vibration analysis
beginning vibration analysisbeginning vibration analysis
beginning vibration analysisMANA PAENG
 
01 beginning vibration analysis
01 beginning vibration analysis01 beginning vibration analysis
01 beginning vibration analysisHugo Alaniz
 
QC of CT using Catphan 600
QC of CT using Catphan 600QC of CT using Catphan 600
QC of CT using Catphan 600Asim Gilani
 
Cumulative frequency distribution
Cumulative frequency distributionCumulative frequency distribution
Cumulative frequency distributionMahrukhShehzadi1
 
Math - Class V: Area (IGCSE)
Math - Class V: Area (IGCSE)Math - Class V: Area (IGCSE)
Math - Class V: Area (IGCSE)Pooja M
 
CLASS V - Area
CLASS V - AreaCLASS V - Area
CLASS V - AreaPooja M
 

Ähnlich wie Histograms (20)

S1 starting points
S1 starting pointsS1 starting points
S1 starting points
 
RiseFalltime031114.pptx
RiseFalltime031114.pptxRiseFalltime031114.pptx
RiseFalltime031114.pptx
 
Handling_Data-_Frequency_Diagrams_and_Frequency_Polygons.pptx
Handling_Data-_Frequency_Diagrams_and_Frequency_Polygons.pptxHandling_Data-_Frequency_Diagrams_and_Frequency_Polygons.pptx
Handling_Data-_Frequency_Diagrams_and_Frequency_Polygons.pptx
 
CNIM Questions related to Mathematics and Formulas
CNIM Questions related to Mathematics and Formulas CNIM Questions related to Mathematics and Formulas
CNIM Questions related to Mathematics and Formulas
 
Descriptive Statistics Part II: Graphical Description
Descriptive Statistics Part II: Graphical DescriptionDescriptive Statistics Part II: Graphical Description
Descriptive Statistics Part II: Graphical Description
 
Statistic chapter 1 & 2
Statistic chapter 1 & 2Statistic chapter 1 & 2
Statistic chapter 1 & 2
 
signal homework
signal homeworksignal homework
signal homework
 
Reverberation time
Reverberation timeReverberation time
Reverberation time
 
waveforms.ppt
waveforms.pptwaveforms.ppt
waveforms.ppt
 
Time-Frequency Representation of Microseismic Signals using the SST
Time-Frequency Representation of Microseismic Signals using the SSTTime-Frequency Representation of Microseismic Signals using the SST
Time-Frequency Representation of Microseismic Signals using the SST
 
MR IMAGE QUALITY PARAMETERS.pptx
MR IMAGE QUALITY PARAMETERS.pptxMR IMAGE QUALITY PARAMETERS.pptx
MR IMAGE QUALITY PARAMETERS.pptx
 
01 beginning vibration analysis
01 beginning vibration analysis01 beginning vibration analysis
01 beginning vibration analysis
 
beginning vibration analysis
beginning vibration analysisbeginning vibration analysis
beginning vibration analysis
 
RES701 Research Methodology_FFT
RES701 Research Methodology_FFTRES701 Research Methodology_FFT
RES701 Research Methodology_FFT
 
01 beginning vibration analysis
01 beginning vibration analysis01 beginning vibration analysis
01 beginning vibration analysis
 
QC of CT using Catphan 600
QC of CT using Catphan 600QC of CT using Catphan 600
QC of CT using Catphan 600
 
Cumulative frequency distribution
Cumulative frequency distributionCumulative frequency distribution
Cumulative frequency distribution
 
Shereef_MP3_decoder
Shereef_MP3_decoderShereef_MP3_decoder
Shereef_MP3_decoder
 
Math - Class V: Area (IGCSE)
Math - Class V: Area (IGCSE)Math - Class V: Area (IGCSE)
Math - Class V: Area (IGCSE)
 
CLASS V - Area
CLASS V - AreaCLASS V - Area
CLASS V - Area
 

Kürzlich hochgeladen

Mastering MySQL Database Architecture: Deep Dive into MySQL Shell and MySQL R...
Mastering MySQL Database Architecture: Deep Dive into MySQL Shell and MySQL R...Mastering MySQL Database Architecture: Deep Dive into MySQL Shell and MySQL R...
Mastering MySQL Database Architecture: Deep Dive into MySQL Shell and MySQL R...Miguel Araújo
 
A Call to Action for Generative AI in 2024
A Call to Action for Generative AI in 2024A Call to Action for Generative AI in 2024
A Call to Action for Generative AI in 2024Results
 
What Are The Drone Anti-jamming Systems Technology?
What Are The Drone Anti-jamming Systems Technology?What Are The Drone Anti-jamming Systems Technology?
What Are The Drone Anti-jamming Systems Technology?Antenna Manufacturer Coco
 
🐬 The future of MySQL is Postgres 🐘
🐬  The future of MySQL is Postgres   🐘🐬  The future of MySQL is Postgres   🐘
🐬 The future of MySQL is Postgres 🐘RTylerCroy
 
Strategies for Unlocking Knowledge Management in Microsoft 365 in the Copilot...
Strategies for Unlocking Knowledge Management in Microsoft 365 in the Copilot...Strategies for Unlocking Knowledge Management in Microsoft 365 in the Copilot...
Strategies for Unlocking Knowledge Management in Microsoft 365 in the Copilot...Drew Madelung
 
Scaling API-first – The story of a global engineering organization
Scaling API-first – The story of a global engineering organizationScaling API-first – The story of a global engineering organization
Scaling API-first – The story of a global engineering organizationRadu Cotescu
 
Histor y of HAM Radio presentation slide
Histor y of HAM Radio presentation slideHistor y of HAM Radio presentation slide
Histor y of HAM Radio presentation slidevu2urc
 
GenCyber Cyber Security Day Presentation
GenCyber Cyber Security Day PresentationGenCyber Cyber Security Day Presentation
GenCyber Cyber Security Day PresentationMichael W. Hawkins
 
The 7 Things I Know About Cyber Security After 25 Years | April 2024
The 7 Things I Know About Cyber Security After 25 Years | April 2024The 7 Things I Know About Cyber Security After 25 Years | April 2024
The 7 Things I Know About Cyber Security After 25 Years | April 2024Rafal Los
 
Boost Fertility New Invention Ups Success Rates.pdf
Boost Fertility New Invention Ups Success Rates.pdfBoost Fertility New Invention Ups Success Rates.pdf
Boost Fertility New Invention Ups Success Rates.pdfsudhanshuwaghmare1
 
IAC 2024 - IA Fast Track to Search Focused AI Solutions
IAC 2024 - IA Fast Track to Search Focused AI SolutionsIAC 2024 - IA Fast Track to Search Focused AI Solutions
IAC 2024 - IA Fast Track to Search Focused AI SolutionsEnterprise Knowledge
 
Bajaj Allianz Life Insurance Company - Insurer Innovation Award 2024
Bajaj Allianz Life Insurance Company - Insurer Innovation Award 2024Bajaj Allianz Life Insurance Company - Insurer Innovation Award 2024
Bajaj Allianz Life Insurance Company - Insurer Innovation Award 2024The Digital Insurer
 
A Domino Admins Adventures (Engage 2024)
A Domino Admins Adventures (Engage 2024)A Domino Admins Adventures (Engage 2024)
A Domino Admins Adventures (Engage 2024)Gabriella Davis
 
08448380779 Call Girls In Greater Kailash - I Women Seeking Men
08448380779 Call Girls In Greater Kailash - I Women Seeking Men08448380779 Call Girls In Greater Kailash - I Women Seeking Men
08448380779 Call Girls In Greater Kailash - I Women Seeking MenDelhi Call girls
 
Boost PC performance: How more available memory can improve productivity
Boost PC performance: How more available memory can improve productivityBoost PC performance: How more available memory can improve productivity
Boost PC performance: How more available memory can improve productivityPrincipled Technologies
 
From Event to Action: Accelerate Your Decision Making with Real-Time Automation
From Event to Action: Accelerate Your Decision Making with Real-Time AutomationFrom Event to Action: Accelerate Your Decision Making with Real-Time Automation
From Event to Action: Accelerate Your Decision Making with Real-Time AutomationSafe Software
 
EIS-Webinar-Prompt-Knowledge-Eng-2024-04-08.pptx
EIS-Webinar-Prompt-Knowledge-Eng-2024-04-08.pptxEIS-Webinar-Prompt-Knowledge-Eng-2024-04-08.pptx
EIS-Webinar-Prompt-Knowledge-Eng-2024-04-08.pptxEarley Information Science
 
Data Cloud, More than a CDP by Matt Robison
Data Cloud, More than a CDP by Matt RobisonData Cloud, More than a CDP by Matt Robison
Data Cloud, More than a CDP by Matt RobisonAnna Loughnan Colquhoun
 
Tata AIG General Insurance Company - Insurer Innovation Award 2024
Tata AIG General Insurance Company - Insurer Innovation Award 2024Tata AIG General Insurance Company - Insurer Innovation Award 2024
Tata AIG General Insurance Company - Insurer Innovation Award 2024The Digital Insurer
 
Driving Behavioral Change for Information Management through Data-Driven Gree...
Driving Behavioral Change for Information Management through Data-Driven Gree...Driving Behavioral Change for Information Management through Data-Driven Gree...
Driving Behavioral Change for Information Management through Data-Driven Gree...Enterprise Knowledge
 

Kürzlich hochgeladen (20)

Mastering MySQL Database Architecture: Deep Dive into MySQL Shell and MySQL R...
Mastering MySQL Database Architecture: Deep Dive into MySQL Shell and MySQL R...Mastering MySQL Database Architecture: Deep Dive into MySQL Shell and MySQL R...
Mastering MySQL Database Architecture: Deep Dive into MySQL Shell and MySQL R...
 
A Call to Action for Generative AI in 2024
A Call to Action for Generative AI in 2024A Call to Action for Generative AI in 2024
A Call to Action for Generative AI in 2024
 
What Are The Drone Anti-jamming Systems Technology?
What Are The Drone Anti-jamming Systems Technology?What Are The Drone Anti-jamming Systems Technology?
What Are The Drone Anti-jamming Systems Technology?
 
🐬 The future of MySQL is Postgres 🐘
🐬  The future of MySQL is Postgres   🐘🐬  The future of MySQL is Postgres   🐘
🐬 The future of MySQL is Postgres 🐘
 
Strategies for Unlocking Knowledge Management in Microsoft 365 in the Copilot...
Strategies for Unlocking Knowledge Management in Microsoft 365 in the Copilot...Strategies for Unlocking Knowledge Management in Microsoft 365 in the Copilot...
Strategies for Unlocking Knowledge Management in Microsoft 365 in the Copilot...
 
Scaling API-first – The story of a global engineering organization
Scaling API-first – The story of a global engineering organizationScaling API-first – The story of a global engineering organization
Scaling API-first – The story of a global engineering organization
 
Histor y of HAM Radio presentation slide
Histor y of HAM Radio presentation slideHistor y of HAM Radio presentation slide
Histor y of HAM Radio presentation slide
 
GenCyber Cyber Security Day Presentation
GenCyber Cyber Security Day PresentationGenCyber Cyber Security Day Presentation
GenCyber Cyber Security Day Presentation
 
The 7 Things I Know About Cyber Security After 25 Years | April 2024
The 7 Things I Know About Cyber Security After 25 Years | April 2024The 7 Things I Know About Cyber Security After 25 Years | April 2024
The 7 Things I Know About Cyber Security After 25 Years | April 2024
 
Boost Fertility New Invention Ups Success Rates.pdf
Boost Fertility New Invention Ups Success Rates.pdfBoost Fertility New Invention Ups Success Rates.pdf
Boost Fertility New Invention Ups Success Rates.pdf
 
IAC 2024 - IA Fast Track to Search Focused AI Solutions
IAC 2024 - IA Fast Track to Search Focused AI SolutionsIAC 2024 - IA Fast Track to Search Focused AI Solutions
IAC 2024 - IA Fast Track to Search Focused AI Solutions
 
Bajaj Allianz Life Insurance Company - Insurer Innovation Award 2024
Bajaj Allianz Life Insurance Company - Insurer Innovation Award 2024Bajaj Allianz Life Insurance Company - Insurer Innovation Award 2024
Bajaj Allianz Life Insurance Company - Insurer Innovation Award 2024
 
A Domino Admins Adventures (Engage 2024)
A Domino Admins Adventures (Engage 2024)A Domino Admins Adventures (Engage 2024)
A Domino Admins Adventures (Engage 2024)
 
08448380779 Call Girls In Greater Kailash - I Women Seeking Men
08448380779 Call Girls In Greater Kailash - I Women Seeking Men08448380779 Call Girls In Greater Kailash - I Women Seeking Men
08448380779 Call Girls In Greater Kailash - I Women Seeking Men
 
Boost PC performance: How more available memory can improve productivity
Boost PC performance: How more available memory can improve productivityBoost PC performance: How more available memory can improve productivity
Boost PC performance: How more available memory can improve productivity
 
From Event to Action: Accelerate Your Decision Making with Real-Time Automation
From Event to Action: Accelerate Your Decision Making with Real-Time AutomationFrom Event to Action: Accelerate Your Decision Making with Real-Time Automation
From Event to Action: Accelerate Your Decision Making with Real-Time Automation
 
EIS-Webinar-Prompt-Knowledge-Eng-2024-04-08.pptx
EIS-Webinar-Prompt-Knowledge-Eng-2024-04-08.pptxEIS-Webinar-Prompt-Knowledge-Eng-2024-04-08.pptx
EIS-Webinar-Prompt-Knowledge-Eng-2024-04-08.pptx
 
Data Cloud, More than a CDP by Matt Robison
Data Cloud, More than a CDP by Matt RobisonData Cloud, More than a CDP by Matt Robison
Data Cloud, More than a CDP by Matt Robison
 
Tata AIG General Insurance Company - Insurer Innovation Award 2024
Tata AIG General Insurance Company - Insurer Innovation Award 2024Tata AIG General Insurance Company - Insurer Innovation Award 2024
Tata AIG General Insurance Company - Insurer Innovation Award 2024
 
Driving Behavioral Change for Information Management through Data-Driven Gree...
Driving Behavioral Change for Information Management through Data-Driven Gree...Driving Behavioral Change for Information Management through Data-Driven Gree...
Driving Behavioral Change for Information Management through Data-Driven Gree...
 

Histograms

  • 1. Histograms Histograms look like frequency diagrams. The difference is that you get the frequencies from the area of the rectangles and not the height. Frequency Frequency Density Frequency Diagram Histogram
  • 2. Histograms can be used when the class intervals are unequal. Time Frequency 0 < t < 10 20 10 < t < 20 15 20 < t < 30 10 30 < t < 40 9 40 < t < 50 6 Time Frequency 0 < t < 10 20 10 < t < 15 15 15 < t < 20 10 20 < t < 25 9 25 < t < 40 6 Equal Class Intervals Unequal Class Intervals
  • 3. With a histogram you cant not get the frequency from the height of the bar. Instead you get the frequency from the area of the bar. Frequency is equal to the Area of the Bar. Frequency Density is equal to the Height of the Bar. frequency Frequency density = width of interval 0.4 95 110 105 Width of interval = 10 Height (Frequency density) = 0.4 Area (Frequency) = 4
  • 4. Find the relevant information for each bar. 0.5 ? 10 Width of interval = 10 Frequency density = 0.5 Frequency = 5 1.2 ? ? 2 Width of interval = 5 Frequency = 2 Frequency density = 0.4 5 2 8 ? 20 Width of interval = 20 Frequency density = 1.2 Frequency = 24 Frequency = 8 Frequency density = 2 Width of interval = 4
  • 5. Time Frequency 0 < t < 10 20 10 < t < 15 15 15 < t < 20 10 20 < t < 25 9 25 < t < 40 6 Frequency Frequency = Density Class width Frequency Density 2 3 2 1.8 0.4 20 ÷ 10 15 ÷ 5 10 ÷ 5 9÷5 6 ÷ 15 3.0 2.5 Frequency 2.0 Density 1.5 1.0 0.5 0 Time 0 5 10 15 20 25 30 35 40
  • 6. Distance Frequency 0 < t < 20 2 20 < t < 40 4 40 < t < 50 5 50 < t < 70 12 70 < t < 100 9 Frequency Density 0.1 0.2 0.5 0.6 0.3 2 ÷ 20 4 ÷ 20 5 ÷ 10 12 ÷ 20 9 ÷ 30 0.6 0.5 Frequency Density 0.4 0.3 0.2 0.1 0 10 20 30 40 50 Distance 60 70 80 90 100
  • 7. Remember for a histogram the: Frequency is equal to the Area of the bar. Frequency Density is equal to the Height of the bar. 0.5 ? 1.25 ? 0.8 ? 15 8 Area = 15 x 0.5 = 7.5 Area = 1.25 x 8 = 10 20 Area = 20 x 0.8 = 16
  • 8. Copy and complete the table. Frequency = frequency density × width of interval Frequency density 2.4 2.0 Time in seconds 1.6 Frequency Area density × (frequency) width 1.2 95 ≤ t < 105 0.4 × 10 4 0.8 105 ≤ t < 110 1.2 × 5 6 0.4 110 ≤ t < 115 1.4 × 5 7 115 ≤ t < 120 2.2 × 5 11 120 ≤ t < 135 0.4 × 15 6 0 95 100 105 110 115 120 125 130 135 Time in seconds
  • 9. 1.0 0.8 Frequency Density 0.6 0.4 0.2 0 0 20 40 60 80 100 120 Frequency 0 < t < 40 4 40 < t < 80 8 80 < t < 100 16 100 < t < 12 120 120 < t < 12 140 160 Length 200 40 x 0.1 20 x 0.4 20 x 0.8 20 x 1.0 60 x 0.2 180 Distance
  • 10. Graph to compare the distances that males and females travel in the car per week. 50 40 30 20 10 0 Distance 0 20 40 60 80 100 120 140 160 180 0 20 40 60 80 100 120 140 160 180 Distance 50 40 30 20 10 0
  • 11. Length Frequency 0 < t < 40 40 < t < 80 80 < t < 100 100 < t < 120 120 < t < 200 Length 0 < t < 40 40 < t < 80 80 < t < 100 100 < t < 120 120 < t < 200 Frequency
  • 12. Review Write a definition of each word below. Include methods for calculating. Data set Frequency Class interval Frequency polygon Midpoint Class interval Range Histogram Frequency diagram Frequency density

Hinweis der Redaktion

  1. The results obtained should be compared with the original graph.